After five critical drought years and only two wet years in the decade from 2013 through 2022, there is hope that Wet year 2023 and Above Normal year 2024 will help recover California salmon populations. However, some salmon survival factors that were not improved and some that were made worse in these two years compared to previous wet years will limit salmon recovery from the 2020-2022 drought.
The 2020-2022 drought caused poor runs of adult salmon returning to spawn in 2022 and 2023 (and likely also in 2024). Low spawner numbers contributed to low production of juvenile outmigrants to the ocean in 2023 and 2024, despite good in-river habitat conditions.
The poor production of juvenile salmon in brood years 2022-2024 will limit fisheries from 2024 to 2027. Whether good river flows in the winter and spring of 2023 and 2024 lead to some recovery remains to be seen.
Negative Factors
There are a several factors that seriously limit salmon recovery in Wet and Above Normal years in California’s Central Valley. If not addressed, these factors will result in an uncertain future with continuing poor salmon runs and fishery closures.
- Low Adults Returns from Poor Drought-Year Smolt Production
Brood years 2020 and 2021 smolt production to the ocean in drought years 2021 and 2022 was poor. This poor production led to the lower-than-expected adult returns in 2023 and probably in 2024. Despite a complete fishery closure in 2023 (fisheries generally harvest 50-70% of salmon brood year production), the 2023 salmon escapement to the rivers was poor (Figures 1 and 2). The same patterns are likely to repeat in 2024. In other words, two years of fishery closures may not be sufficient to mitigate the poor smolt production in drought years 2021 and 2022. The poor adult returns will compromise brood year 2023 and 2024 smolt production from low numbers of eggs spawned. There were limited actions taken to increase smolt production in these drought-plagued brood years. As a result, adult returns (escapement) are likely to remain depressed through 2027.
- Lower Sacramento River Flow and Water Temperatures
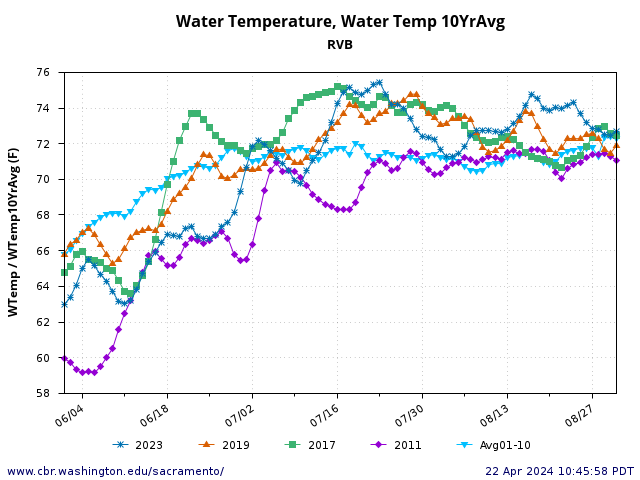
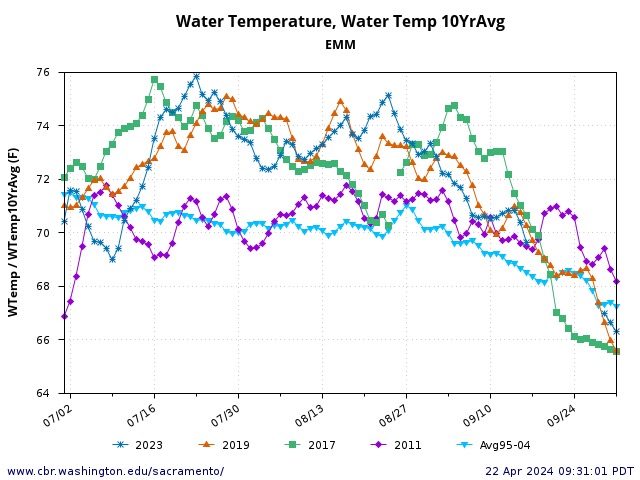
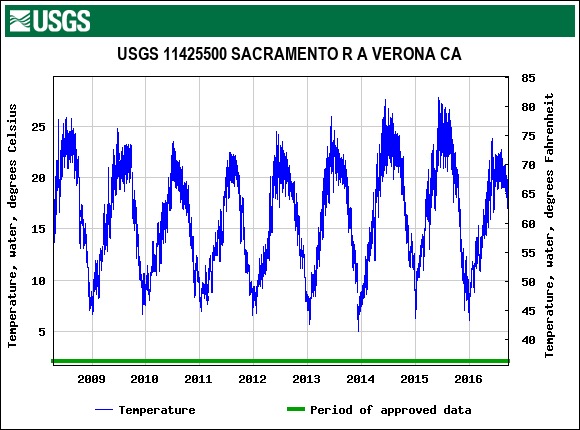
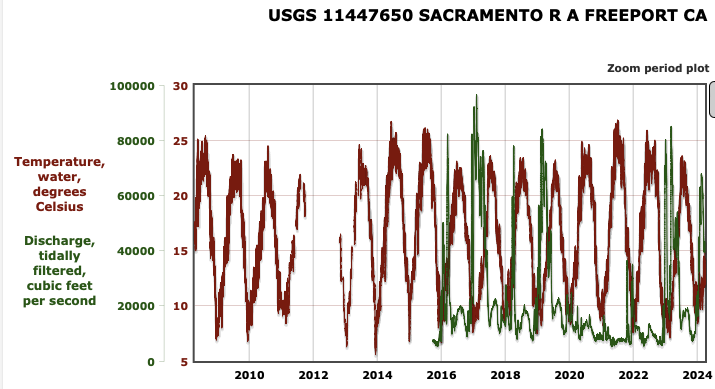
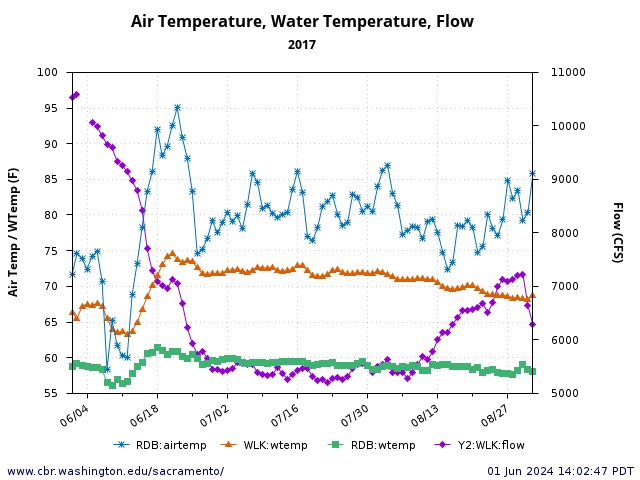
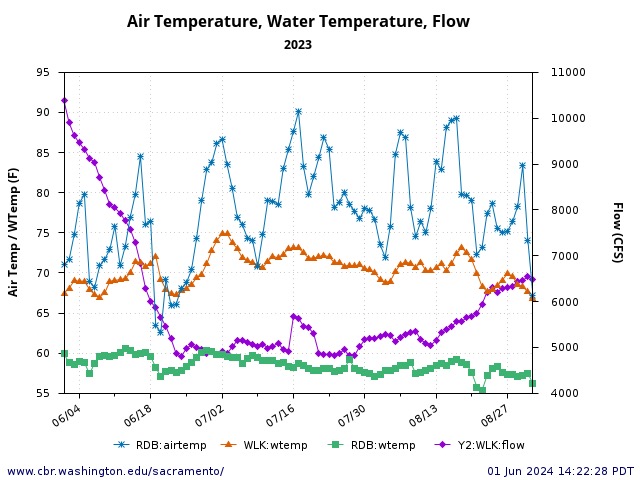
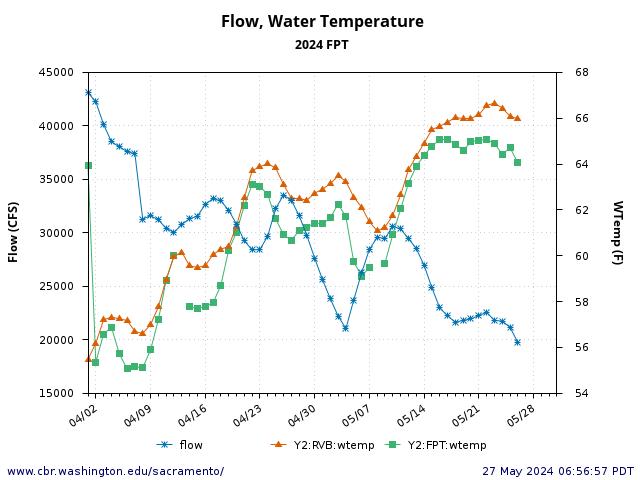
Another factor in the poor adult run up the Sacramento River in Wet year 2023 was unusually low flows (Figure 2) and higher water temperatures (Figure 3) in the lower Sacramento River and Bay-Delta during the summer-to-early-fall immigration period. Adult salmon migrate into San Francisco Bay in summer and up the Sacramento River to spawning grounds in late summer for fall spawning. Delta outflow to the Bay in summer-fall 2023 was lower than the most recent wet years (Figure 3). Water temperatures of the summer outflow in the Sacramento River channel entering the Bay near Rio Vista were 70-75oF (Figure 4). Such temperatures are highly stressful to the adult salmon, and adult salmon generally avoid them. Water temperatures in San Pablo Bay (North Bay) and Suisun Bay (East Bay) reached 70oF or higher (Figure 5 and 6), especially during that portion of the monthly tidal cycle when the Delta drained into the Bay (during the full moon spring tides). Ocean coastal water temperatures were also elevated (a condition termed the Blob) (Figures 6 and 7).
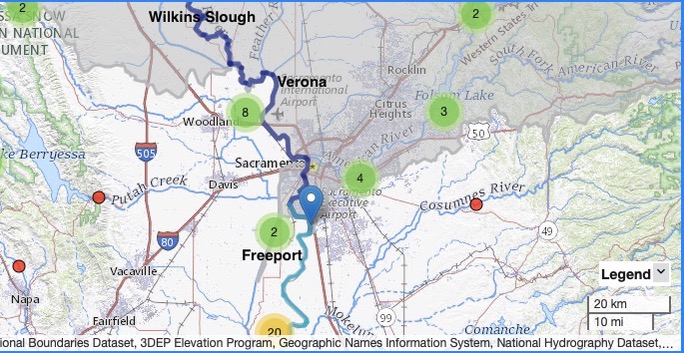
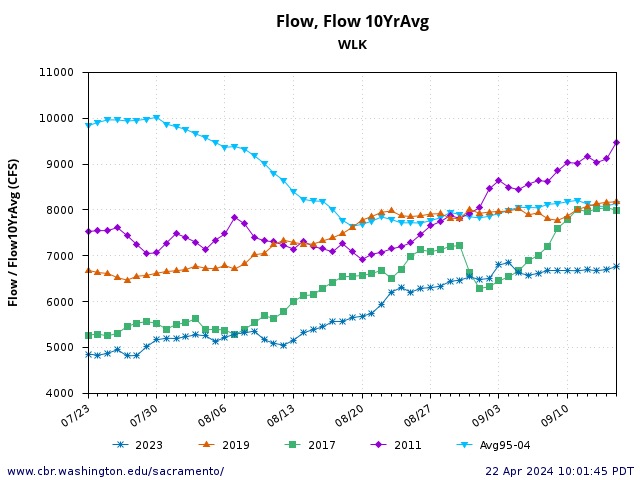
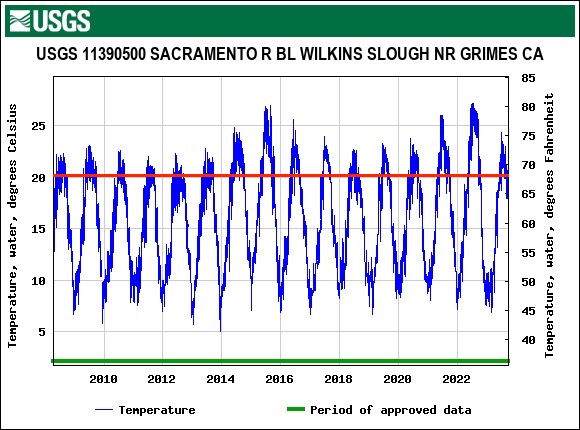
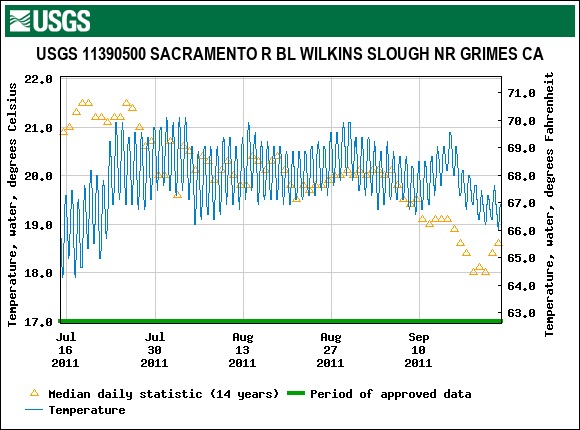
Water temperatures were also elevated through the summer in the lower Sacramento River upstream of the Delta (Wilkins Slough near Grimes, Figure 4), frequently exceeding 70oF from June through August. The water quality standard for the lower Sacramento River in summer is water temperatures no higher than 68oF. That standard was met in Wet water year 2011 (as required under the 2009 federal salmon biological opinion) but not in Wet years 2017, 2019, or 2023.
Lower-than-normal Wet-year river flows (Figure 8) and associated higher water temperatures (Figure 9) in spring of Wet year 2023 also stressed spring immigrating adult winter-run and spring-run salmon. Such conditions also compromised salmon smolt production of brood year 2022 salmon by reducing late emigrating smolt (June) survival. The standard of 20ºC/68ºF for the lower river above and below the mouth of the Feather River is designed to protect late migrating adult and smolt salmon.
- High Delta Exports
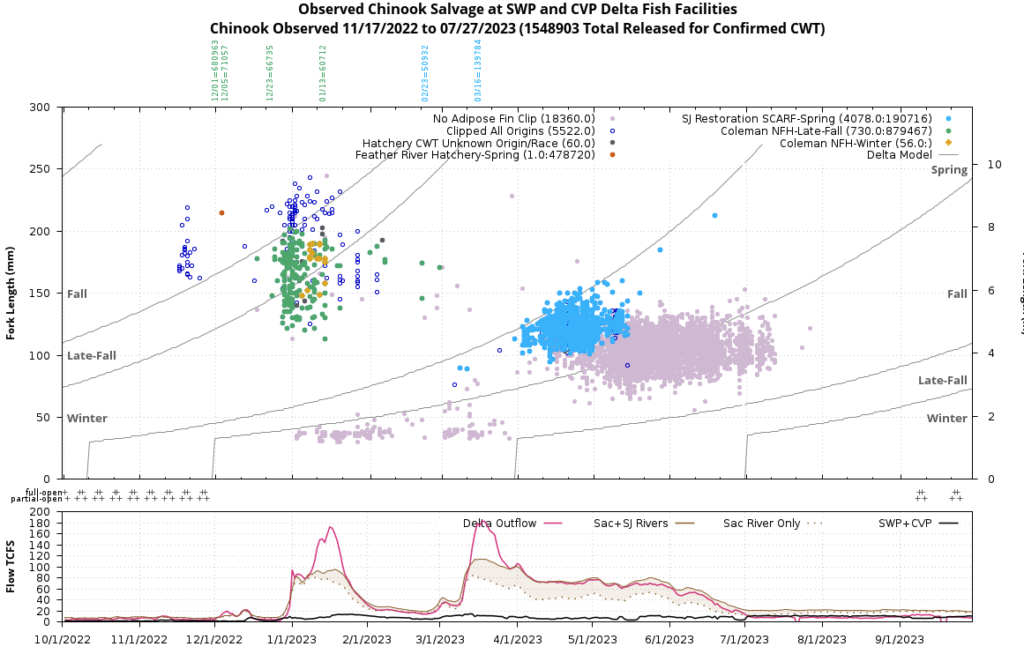
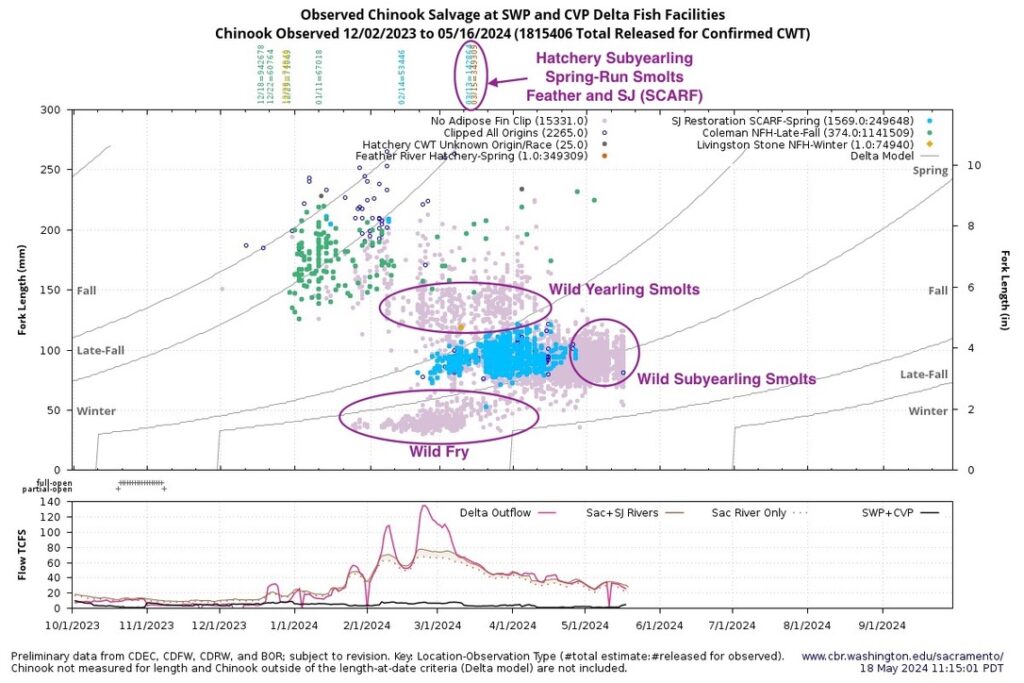
Salvage of juvenile salmon at Delta export pumps generally peaks from mid-May to mid-June, during peak smolt emigration of spring-run and fall-run Chinook salmon (Figure 10). Often salvage numbers are higher in Wet years because of high production (survival of fry) in Wet years. Export rates in water year 2023 were abnormally high for a Wet year (often near the 11,000 cfs maximum) during May (Figure 11). In contrast, Wet year 2011 rates were only 2000-4000 cfs. Historically allowed rates under D-1485 standards (pre-1995) were a maximum of 6,000 cfs in May and June. Under the CVPIA and VAMP programs (1990s and 2000s), spring exports were also restricted to protect emigrating juvenile salmon. That is no longer the case with weakened restrictions in the federal 2019 biological opinions governing recent Delta export operations.
Salmon salvage at export pumping facilities is generally considered an indicator of juvenile salmon being drawn into the central and southern Delta from the main channels of the Sacramento and San Joaquin rivers. If salvage rates are high, then salmon losses throughout the Delta are likely high. The risk of juvenile salmon being drawn into the south Delta (and lost) is highest at high export levels when south Delta exports dominate interior Delta hydrodynamics.
- Loss of Salmon in the Flood Bypasses in Wet Years
In winter-spring of wet years like 2023 and 2024, high flows in the Sacramento River channel spill into the Sutter and Yolo bypasses via five flood control overflow weirs (Moulton, Colusa, Tisdale, Fremont, and Sacramento weirs). Wet-year spills combined can account for over half the total river flow in the middle and lower Sacramento Valley. In 2023 and 2024, flood spills to bypasses peaked from January to March (Fremont Weir and Yolo Bypass flows shown in Figure 13), during peak emigration of juvenile salmon of brood years 2022 and 2023 (Figure 14 and 15). While the flooded bypasses are generally believed to be good juvenile salmon rearing habitat, the bypasses are often only flooded for a week or two and then drain quickly, as flood weir spills generally end abruptly. The sudden draining strands millions of juvenile salmon in borrow pits, rice fields, duck ponds, and ditch networks – over 100,000 acres of flooded bypass habitat – habitats that warm significantly in April as the bypasses drain (Figure 16).
Adult spring-run and winter-run salmon also become stranded in winter-spring of Wet years if they are attracted to the bypass routes in their upstream migration toward the upper Sacramento River and tributary spawning grounds. Upon reaching the weirs, the adult salmon are blocked by the concrete weirs from re-entering the river and continuing their journey upstream. Of note is the recently constructed fish-passage notch in the Fremont Weir that continues flows to the Yolo Bypass from the Sacramento River after the weir spill ends (see March-April 2024 flows over 1000 cfs in Yolo Bypass in Figure 13). The notch allows the adult salmon to pass through the Fremont Weir at lower (descending) river flows. Such notches are planned in the other weirs but have not yet been built.
Positive Factors
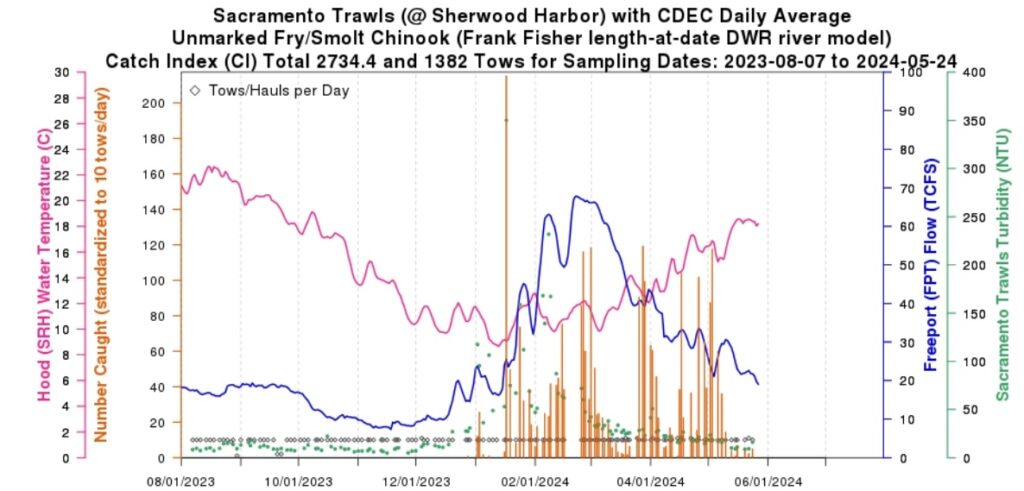
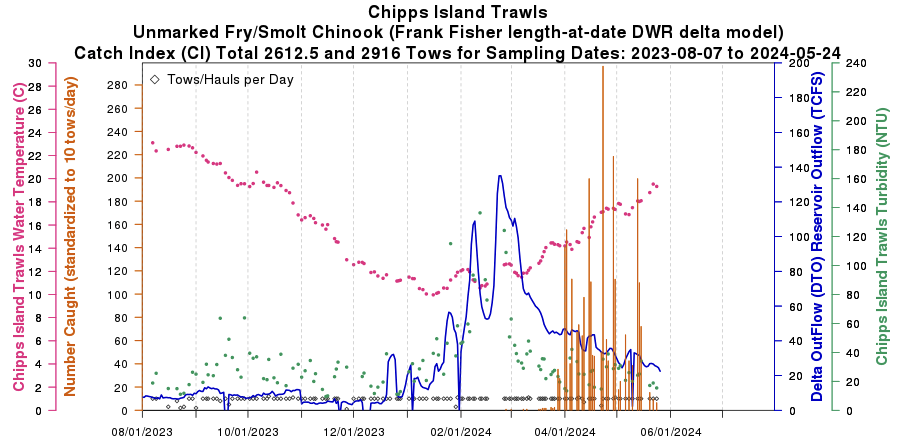
There are some positive factors for salmon production in Wet year 2023 and Above Normal year 2024. The higher river and Delta flows support the emigration of the juvenile salmon and keep the water temperatures down (Figure 14 and 15) before the river, bypasses, and Delta get too warm (Figure 16). As a result, hatchery and wild smolt survival rates are higher in Wet years. Wild and hatchery juvenile salmon need sufficient Delta outflows to reach the Bay in spring to finish off their development before heading into the ocean (Figure 17).
Summary and Conclusions
The past two winter-springs (2023 and 2024) ought to be major recovery years for Central Valley salmon. However, ongoing problems continue to plague salmon recovery. Production indices that guide fishery management options remain low (see 2024 Sacramento River ocean-salmon-index forecast in Figure 18). It is going to take forecasts into the 500,000 to 1,000,000 range to bring back historic fisheries. The only way to do that is rebuilding the stocks in Wet and Above Normal years when the production potential is higher. That may be difficult in the years ahead, because we cannot control marine heat waves, ocean-derived Thiamine deficiencies, ocean foodwebs, and Sierra snowpacks.
For more on the future of California salmon fisheries see the following perspectives from NOAA Fisheries:
https://www.fisheries.noaa.gov/feature-story/looking-back-blob-chapter-2-marine-heat-wave-intensifies-completely-chart
https://www.fisheries.noaa.gov/news/oceans-influence-salmon-plays-out-varied-returns-different-rivers-and-regions
https://www.fisheries.noaa.gov/feature-story/survivor-salmon-withstand-drought-and-ocean-warming-provide-lifeline-california
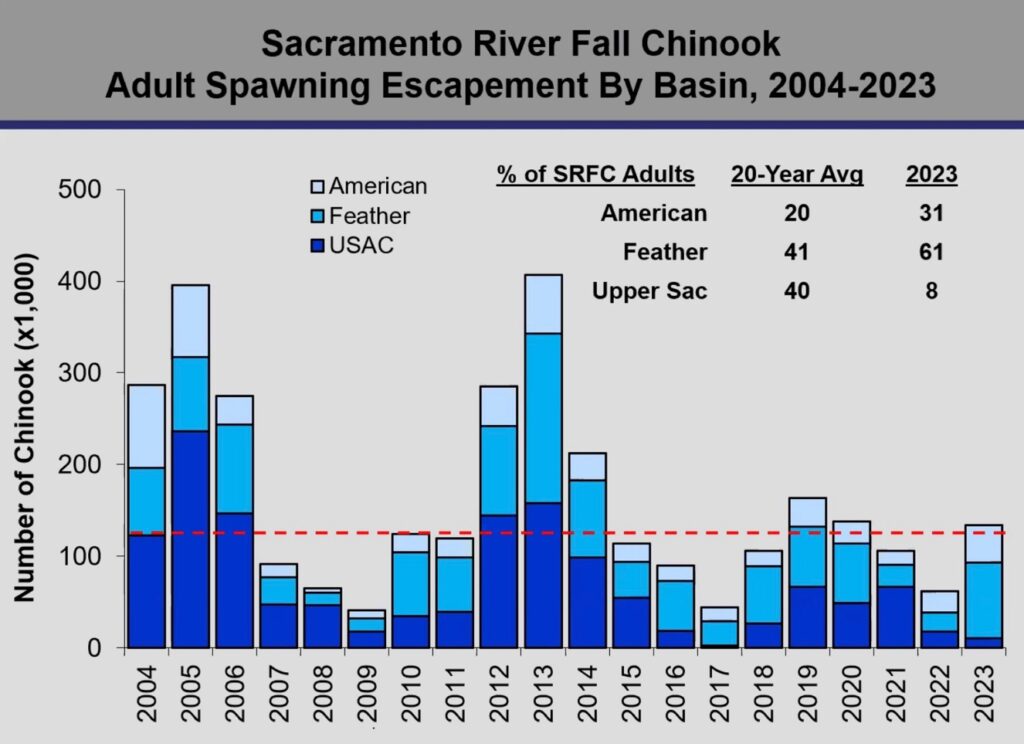
Figure 1. Fall Chinook escapement from 2004 to 2023. Major components of the fall Chinook population are upper Sacramento River including the mainstem and tributaries as well as the Battle Creek Hatchery, the Feather River and the Feather River Hatchery, and the American River and the Nimbus Hatchery. The red dashed line is the target escapement number to sustain a maximum sustained yield for ocean and river fisheries. Note the near record low run in the upper Sacramento River in 2023, generally attributed to poor smolt production in drought years 2021 and 2022. Higher Feather and American River escapement in 2023 is attributed to releases of hatchery smolts to the Bay and ocean during drought years 2021 and 2022 (practices not employed by the Upper Sacramento River’s Battle Creek Hatchery until 2024 on a large scale), as well as the fishery closure in 2023.
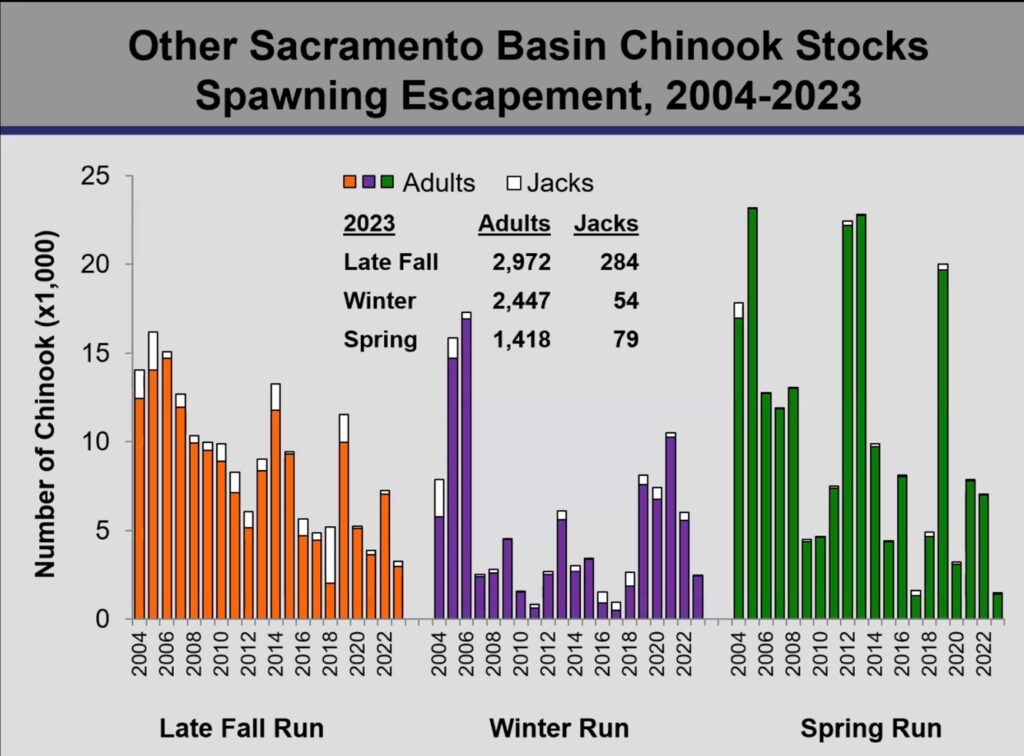
Figure 2. Escapement of other salmon runs to the Sacramento River Basin 2004-2023. Note near record low numbers except for winter run. Also, low numbers of jacks indicate 2024 adult runs are expected to be low for winter and spring run.
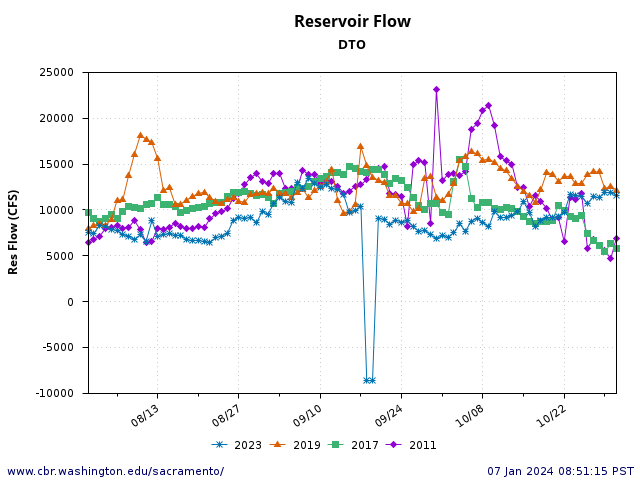
Figure 3. Delta outflow in summer of Wet year 2023 compared to three most recent Wet years.
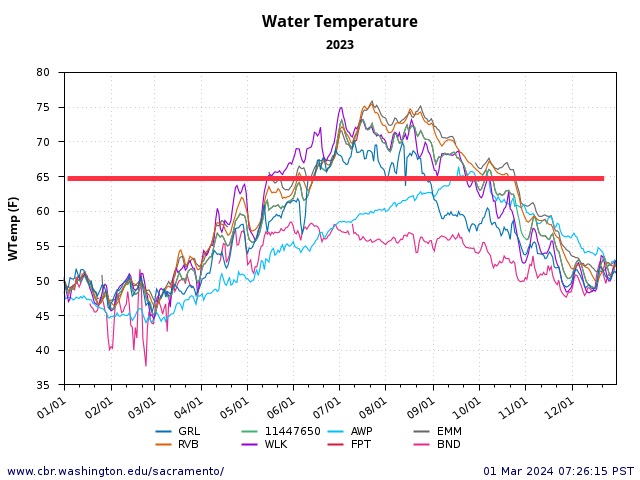
Figure 4. Water temperatures in the Sacramento River system in 2023: BND is upper river and Bend Bridge near Red Bluff; WLK is middle river near Grimes; FPT (and 11447650) is north Delta near Freeport; EMM and RVB are Emmaton and Rio Vista Bridge in the western Delta; GRL is lower Feather River near Gridley; and AWP is lower American River at William Pond. Red line denotes stressful water temperature boundary – above 65ºF water temperatures are stressful to migrating adult salmon – adult salmon avoid water temperatures exceeding 72ºF.
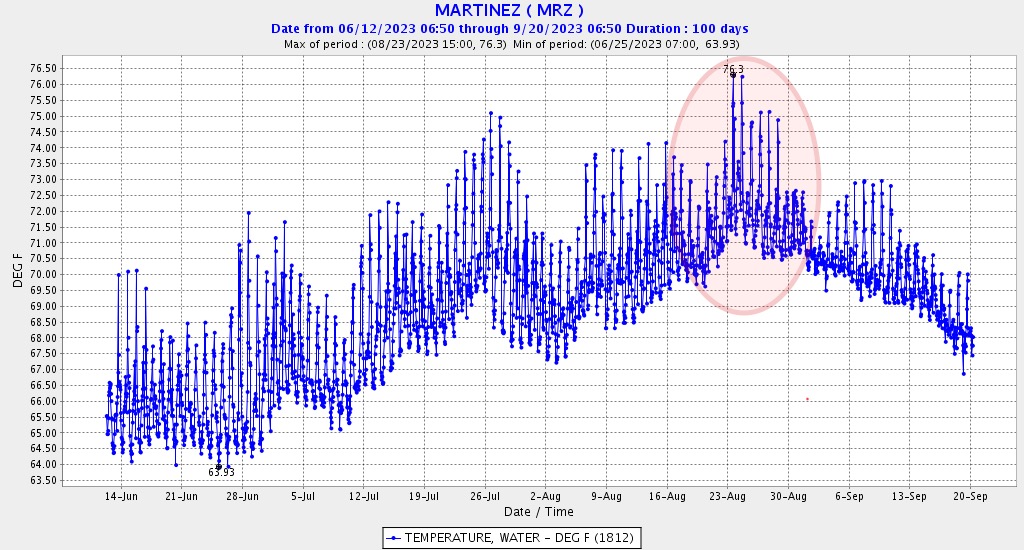
Figure 5. Water temperature in north Bay near Martinez in summer 2023. Red circle depicts unusually high water temperature event attributable to high Bay air temperatures, high Delta outflow temperatures, and high coastal ocean temperatures.
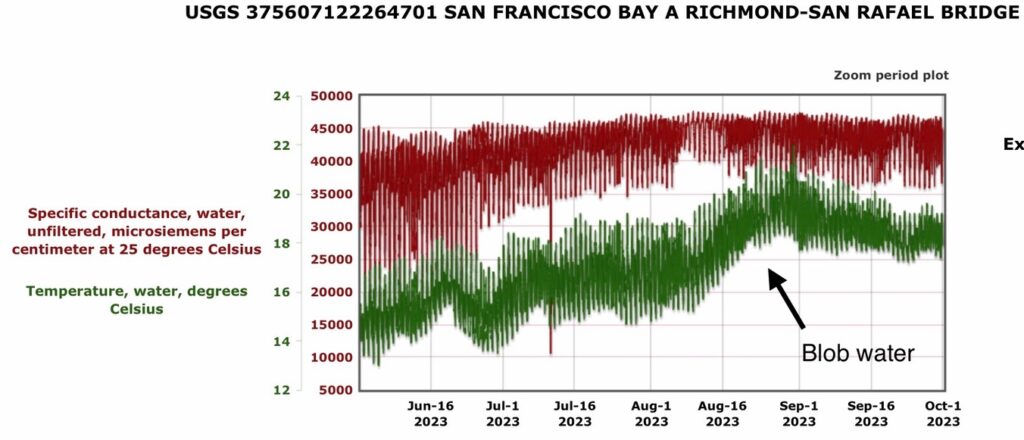
Figure 6. Salinity and water temperature in central San Francisco Bay in summer 2023. The effect of the ocean “Blob” on the Bay is noted.
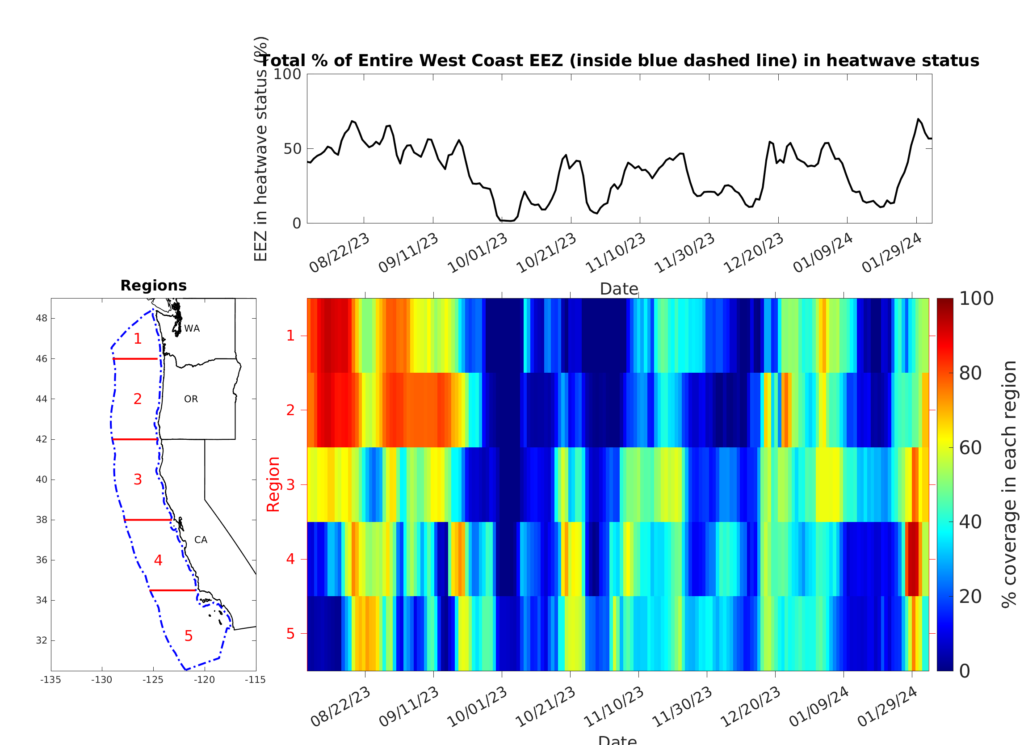
Figure 7. Coastal zone heat wave in summer 2023 (commonly referred to as the Blob). Source: NOAA.
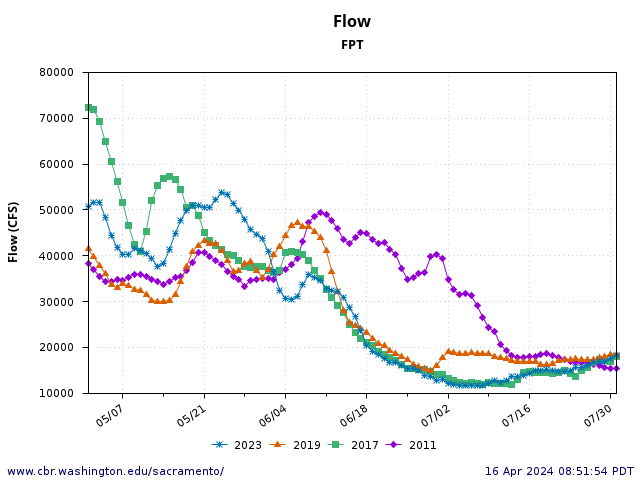
Figure 8. May through July daily average flow of the Sacramento River at Freeport in the four most recent Wet years. Note trend toward lower flows in early summer. Lower Delta inflows and higher Delta exports in late spring and early summer hinder salmon recovery in Wet years.
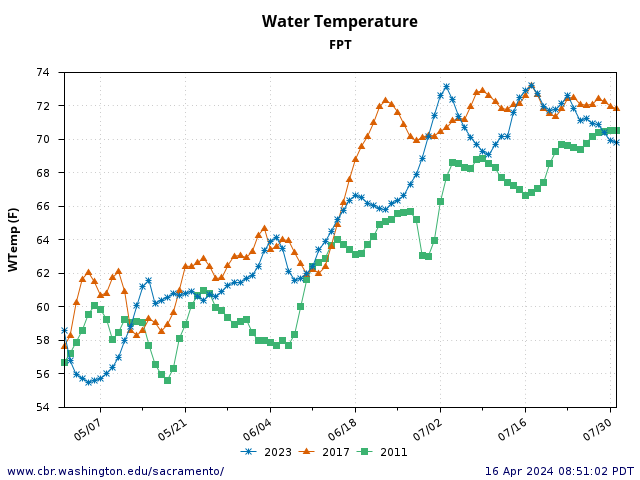
Figure 9. May through July daily average water temperatures of the Sacramento River at Freeport in three recent Wet years. Note the lower water temperatures in 2011, corresponding to higher Delta inflows in 2011 shown in Figure 8.
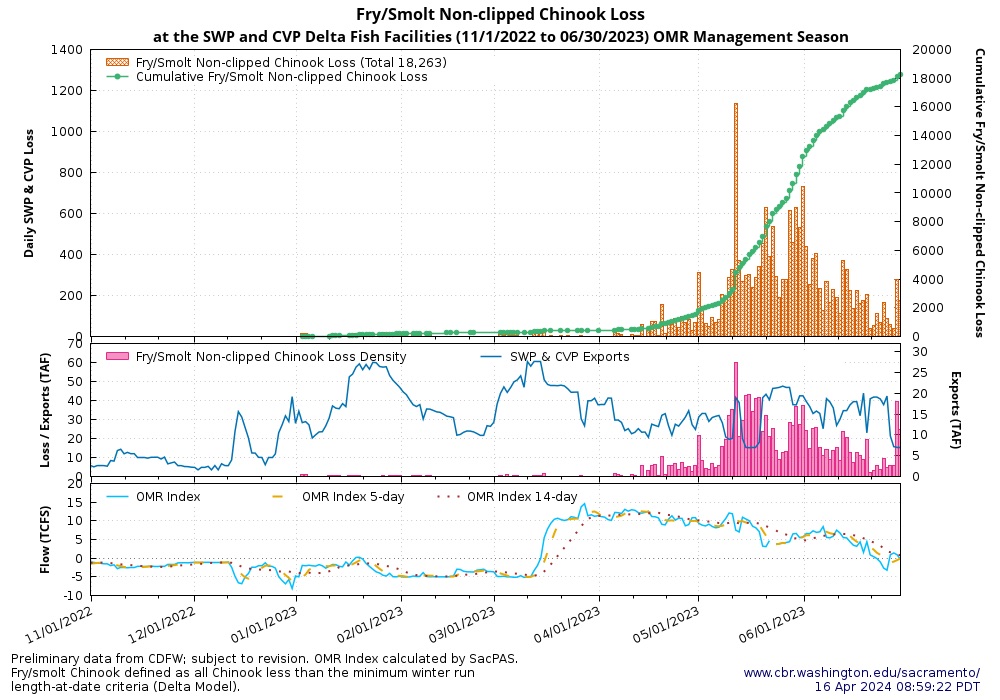
Figure 10. Salvage of juvenile Chinook salmon at south Delta export facilities in spring 2023. Also shown are export rates and net flows in Old and Middle Rivers (OMR) that represent pull toward the export pumps. Note juvenile salmon are present through June under high exports of near 10,000 cfs (20,000 acre-ft per day).
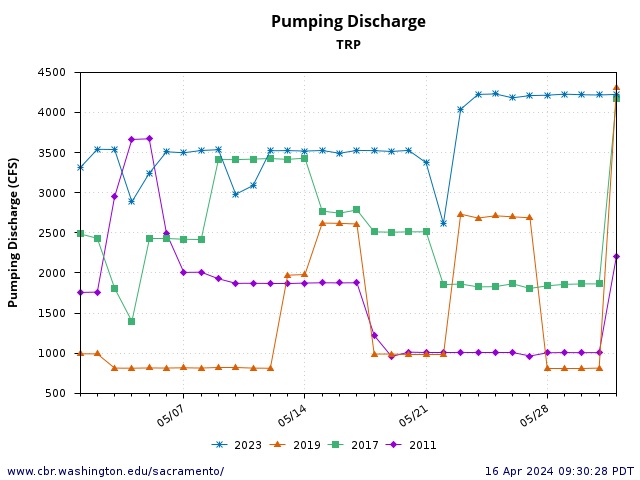
Figure 11. Export rates in May in four most recent Wet years at federal Tracy Pumping Plant in south Delta. Note high May 2023 rates that reached 4250 cfs – the maximum allowed rate.
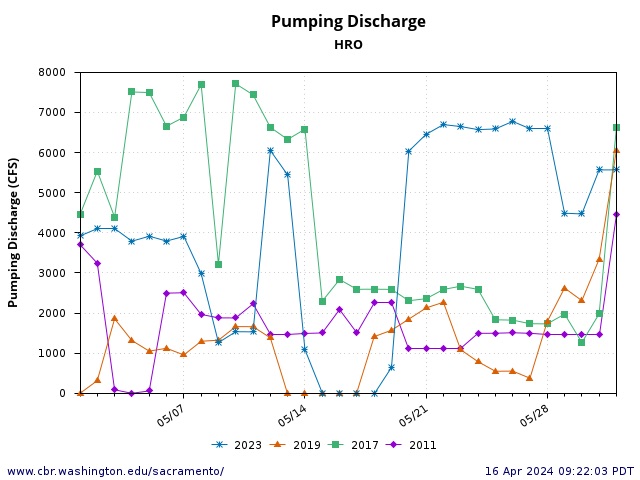
Figure 12. Export rates in May in four most recent Wet years at state Harvey Banks Pumping Plant in south Delta. Note May 2023 reached 6800 cfs – near the maximum allowed rate.
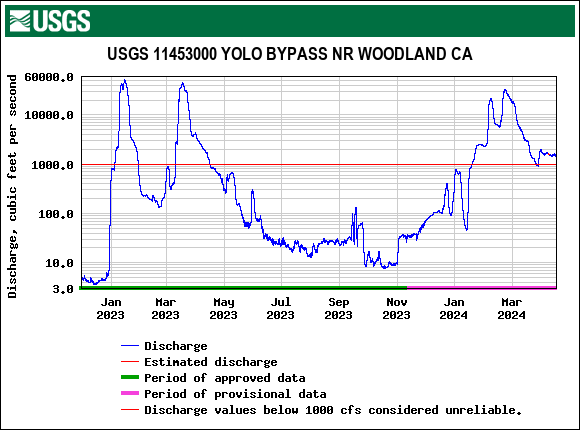
Figure 13. Flow rate (cfs) in Yolo Bypass canal below Fremont Weir in 2023 and 2024. Flow above 1000 cfs are generally associated with Fremont Weir spills from the Sacramento River. Note March-April 2024 flows provided in part by the new weir notch.
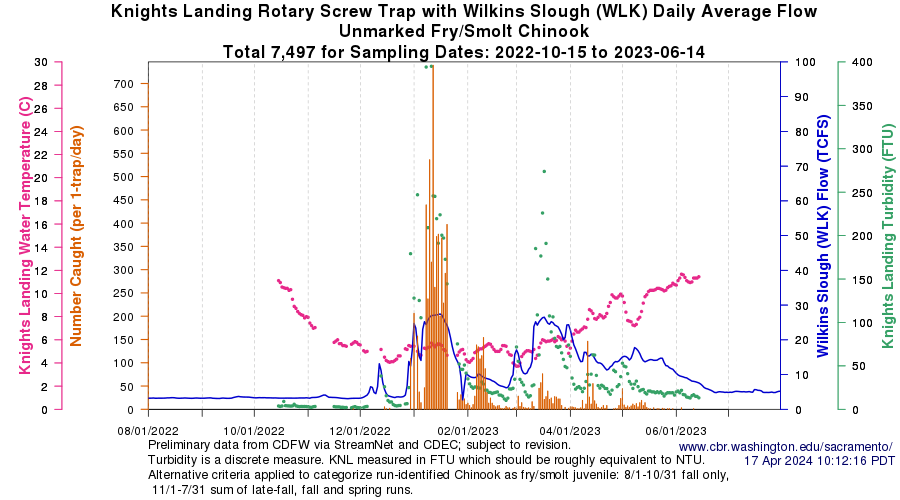
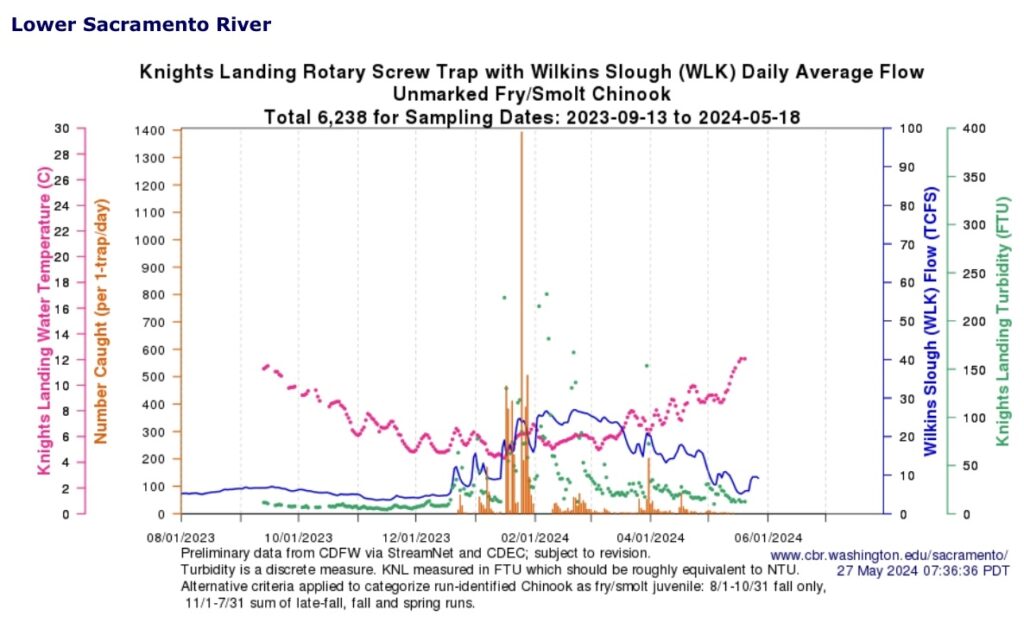
Figure 14. Lower Sacramento River juvenile salmon catch in screw traps at Knights Landing in winter-spring 2023. Note upper river emigration ceased about mid-May, indicating most of the juvenile salmon were in the Bay-Delta by mid-spring.
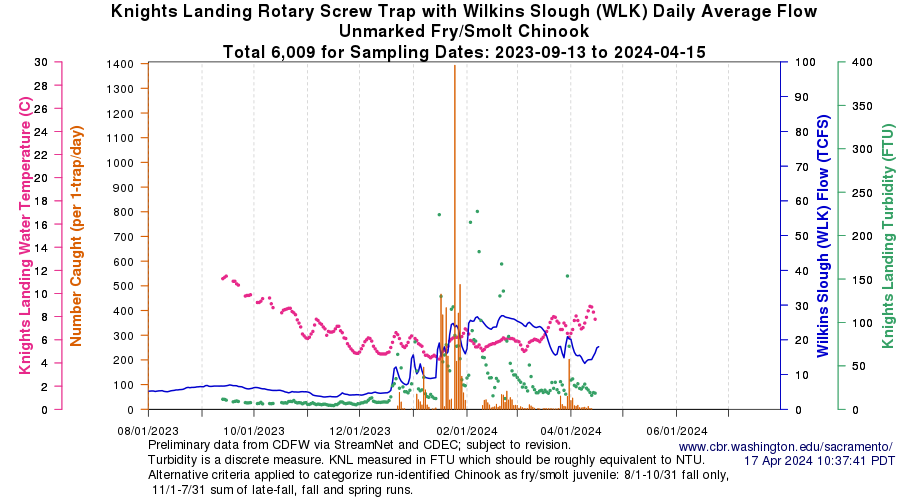
Figure 15. Lower Sacramento River juvenile salmon catch in screw traps at Knights Landing in winter-spring 2024.
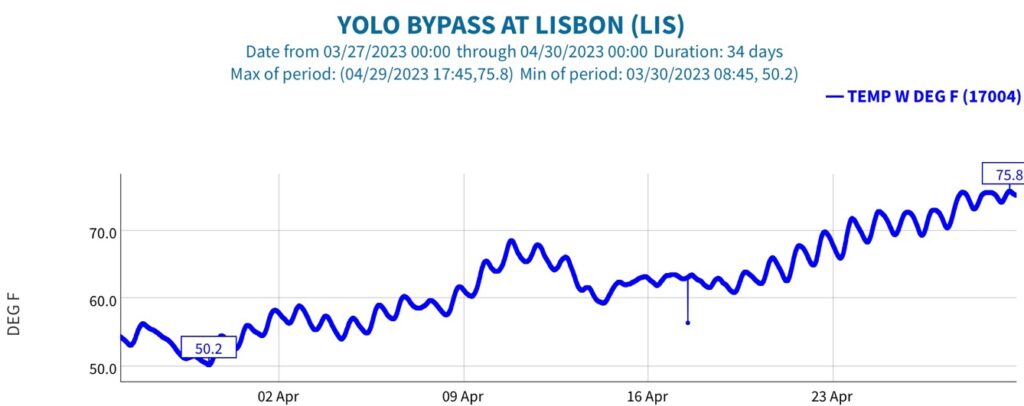
Figure 16. Water temperature in mid Yolo Bypass in April 2023. Lethal water temperatures (70-75ºF) were reached by late April.
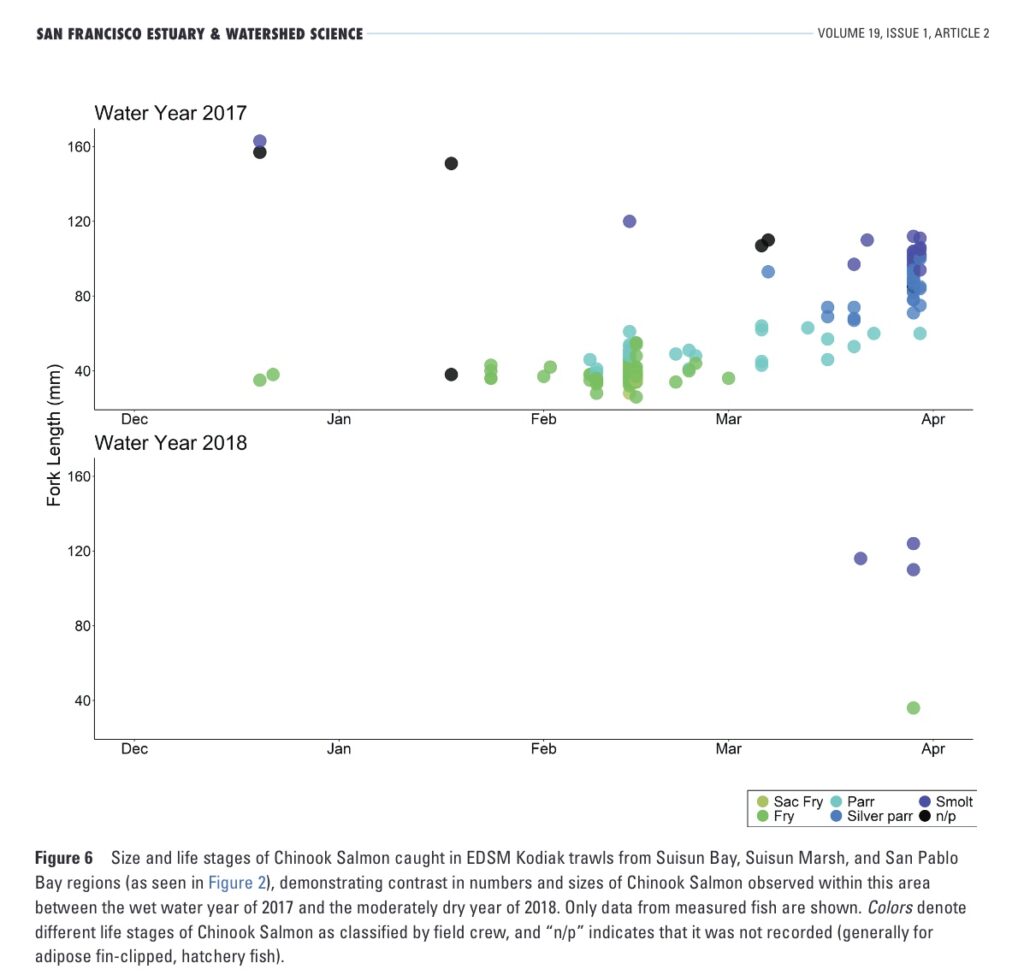
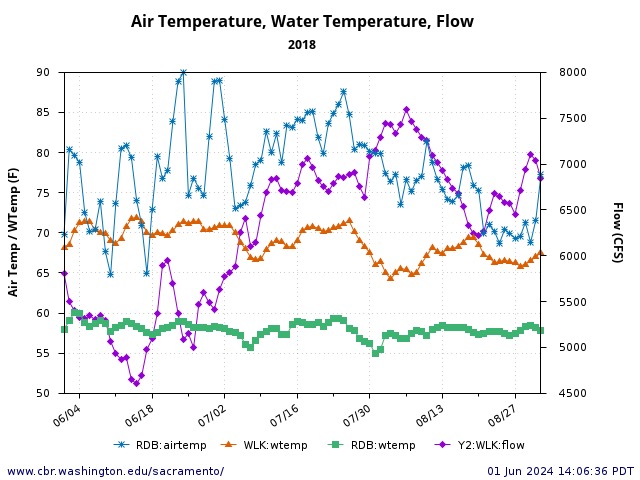
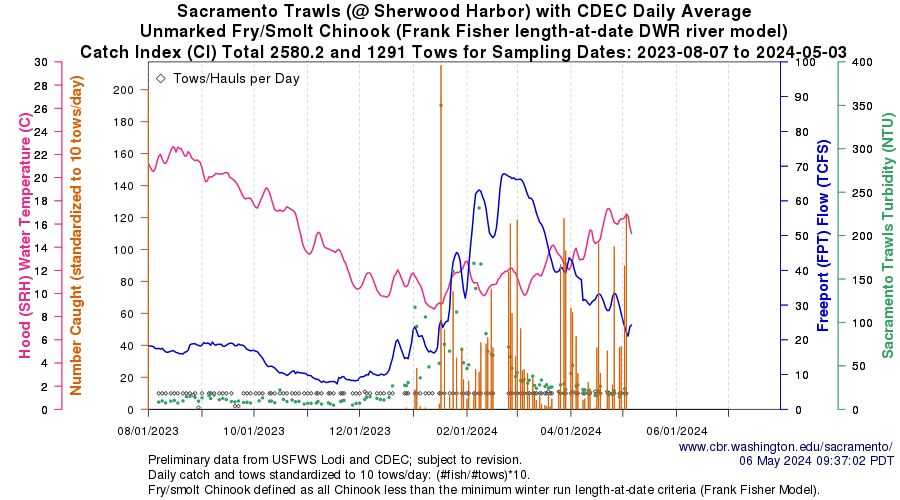
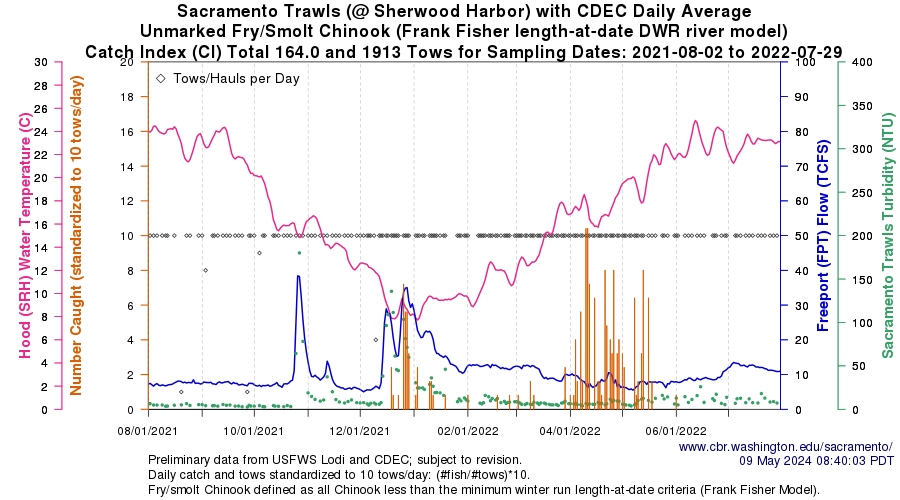
Figure 17. Juvenile salmon present in Bay trawl collections in wet year 2017 and below normal year 2018. Note low catch in 2018 is representative of low transport and survival of juvenile salmon to the Bay in drier years.
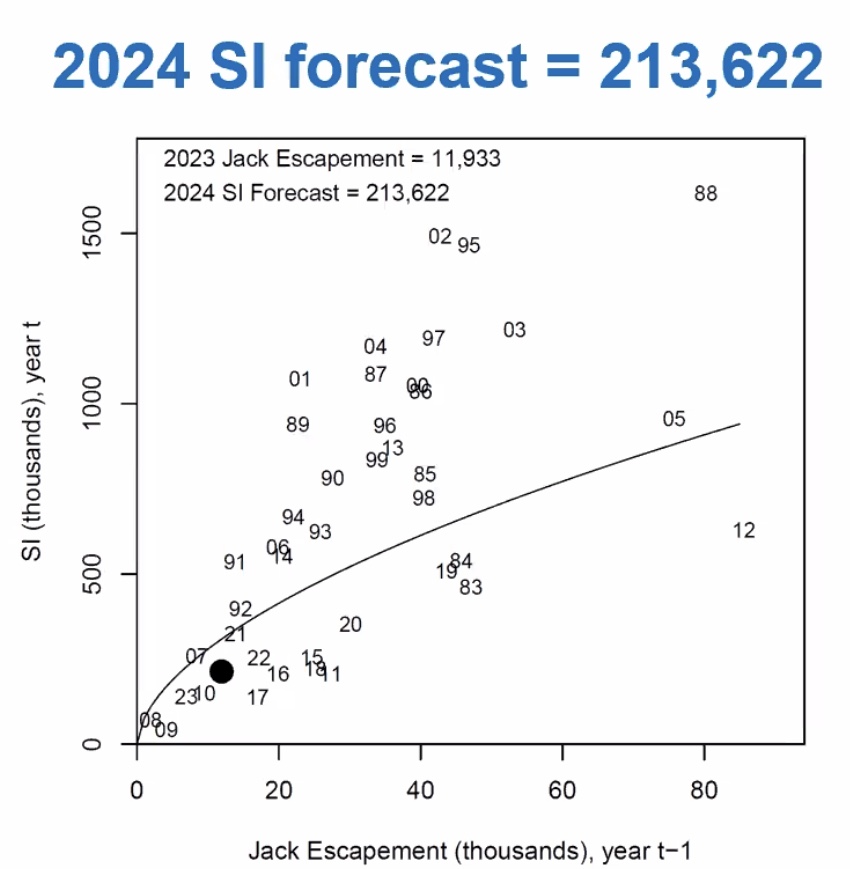
Figure 18. Sacramento River fall-run salmon ocean-abundance-index forecast (2024 is large black dot). Source: NOAA and PFMC.