
A March 16, 2017 Yubanet article by South Yuba Citizens League (SYRCL) noted that the 2016 fall run of salmon for the Yuba River has dropped to the low level observed since 2007 and 2008 (Figure 1):
“The low salmon run size for the Yuba River appears to be part of another regional salmon collapse.”
Comment: the 2007-2008 Central Valley salmon collapse was attributed to several potential causes: poor ocean conditions for spawn/brood years 2004 and 2005, poor 2004-2005 Bay–Delta conditions, and lack of hatchery pen acclimation in the Bay.1 Most likely that collapse was related to drier river conditions from years 2001-2005 and critically dry years in 2007-2008, after wet conditions in years 1995-2000 resulted in high population levels. The new 2016 low is likely a consequence of the drought years 2012-2015, and specifically of poor conditions in the Yuba River.
The article also noted a high proportion of hatchery fish in the Yuba salmon run, and cited a Fishbio blog post for the following:
“It is time to decide whether we want to base our salmon production goals on sheer numbers of genetically similar hatchery fish, or on diverse, wild fish naturally supported by our local rivers.”
Comment: Since the Yuba River is the largest tributary of the lower Feather River, one would expect it to receive a portion of the wild and hatchery salmon production of the lower Feather. To define this as “straying,” given that the genetic stocks are identical, is debatable. What is unusual is that the Yuba run is made up of predominantly Feather River hatchery fish, thus indicating poor natural production from the Yuba itself, particularly in drier years. There is something about the Yuba that leads to poor natural salmon production at least during or after drought periods.
Having worked and fished on the Yuba over the past two decades, I thought I would share my insights in this post. Starting with the stock-recruitment (S-R) (recruits per spawner) relationship, I have found that, like other Central Valley salmon rivers, the Yuba has a telling and highly statistically significant S-R relationship (Figure 2) that supports the following findings:
- There is a basic underlying positive S-R relationship – lower spawner levels produce less recruits and visa-versa.
- There is a strong effect of water year conditions – wet years enhance production and dry years have generally poor production.
- Poor runs often come in dry years with low summer flows and high water temperatures (1988-1989, 1992, 2007-2009, 2015-2016), which may affect adult survival or the number of adults that seek the Yuba from the Feather River. Good runs occur in wet years that have higher summer flows and lower water temperatures (1982, 1996-1998). (See Figures 3 and 4.)
- Poor runs are also related to poor winter-spring rearing and emigrating conditions two years earlier in the Yuba and/or Bay-Delta (1989, 1992, 2009, 2015-2016). Stronger runs occurred when early rearing and emigrating conditions were good (e.g., 1986, 1995-2000).
- Poor runs in some years may be related to poor Feather hatchery smolt survival or poor early conditions for ocean rearing.
- Poor early ocean rearing conditions and lack of hatchery smolt pen acclimation in the Bay may have contributed to poor runs (e.g., 2006-2008).
In summary, there are a lot of factors that potentially affect the salmon run in the Yuba River. It is difficult to evaluate the importance of the various factors, but my bet is on two factors that stand out:
- Higher winter-spring flows help carry young to and through the Delta, provide habitat and protection from predators, and initiate and speed migration.
- Higher August through October flows (Figure 3): (a) attract adult salmon, (b) improve passage habitat, and (c) keep water temperatures down (Figure 4).
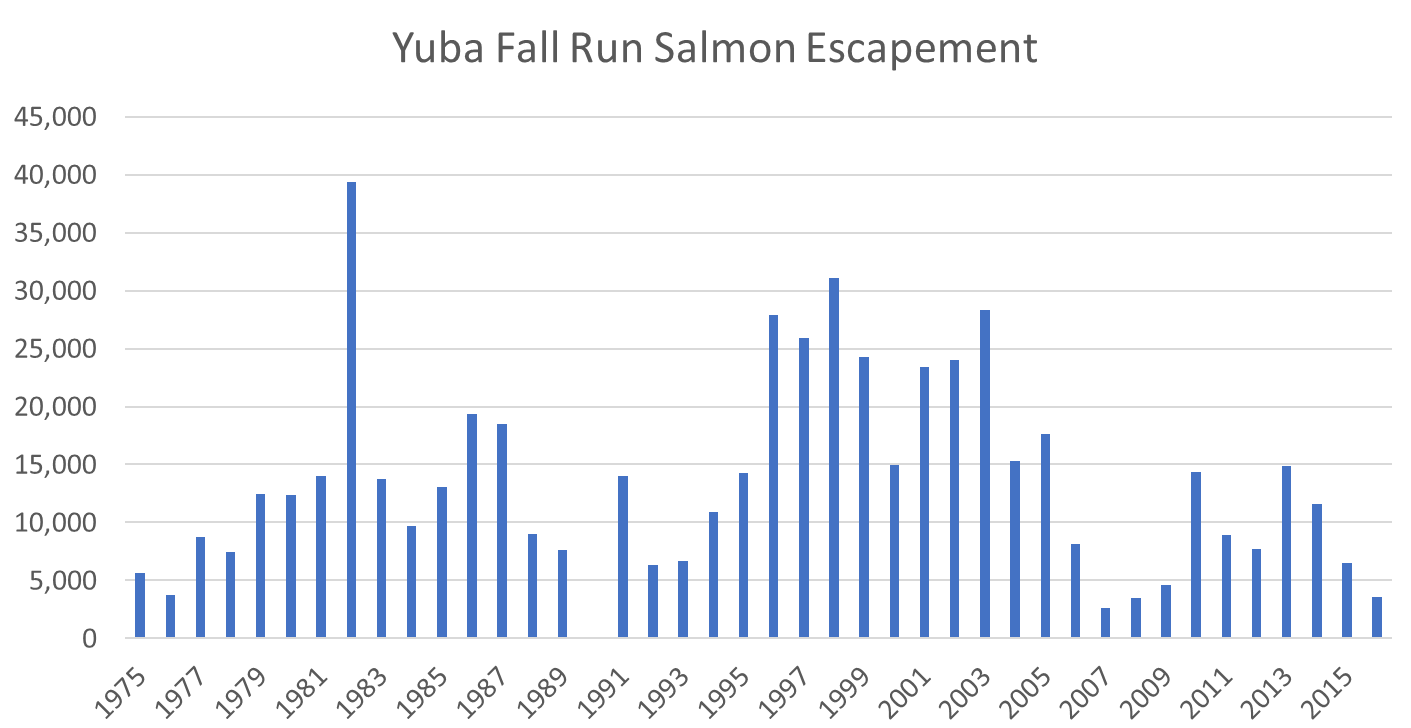
Figure 1. Fall-run Chinook salmon escapement estimates for Yuba River 1975-2016. Source: CDFW GrandTab.
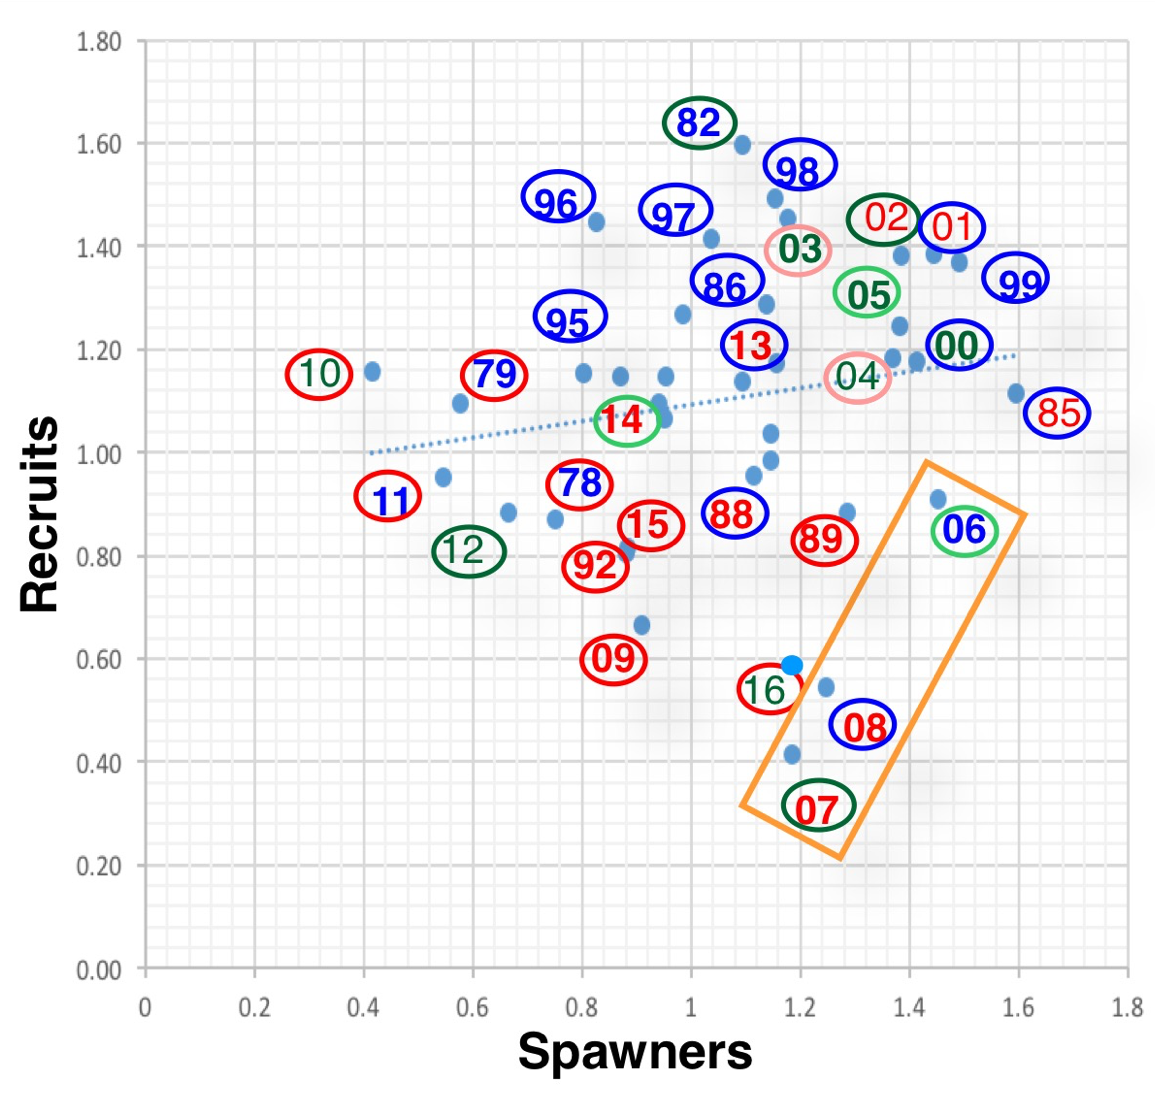
Figure 2. Spawner – Recruit relationship for Yuba River fall run salmon. Year is recruit year escapement; for example, “16” is escapement in fall 2016 from 2013 spawn. Bold red years are critical water years. Non-bold red years are dry water years. Bold green years are above normal water years. Non-bold green years are below normal water years. Blue years are wet years. Circles represent winter-spring water year two-years earlier; for example, 08 blue circle represents winter-spring water year classification of “wet” in 2006 when the 08 spawners were rearing and emigrating from Yuba River. Yellow rectangle denotes years in which ocean conditions may have reduced escapement from poor ocean-rearing survival in prior years.

Figure 3. Lower Yuba River flow at Marysville in August-September period in years 2000-2016. Source: CDEC. Of note: lowest flows were in 2014-2016, and surprisingly in 2006.
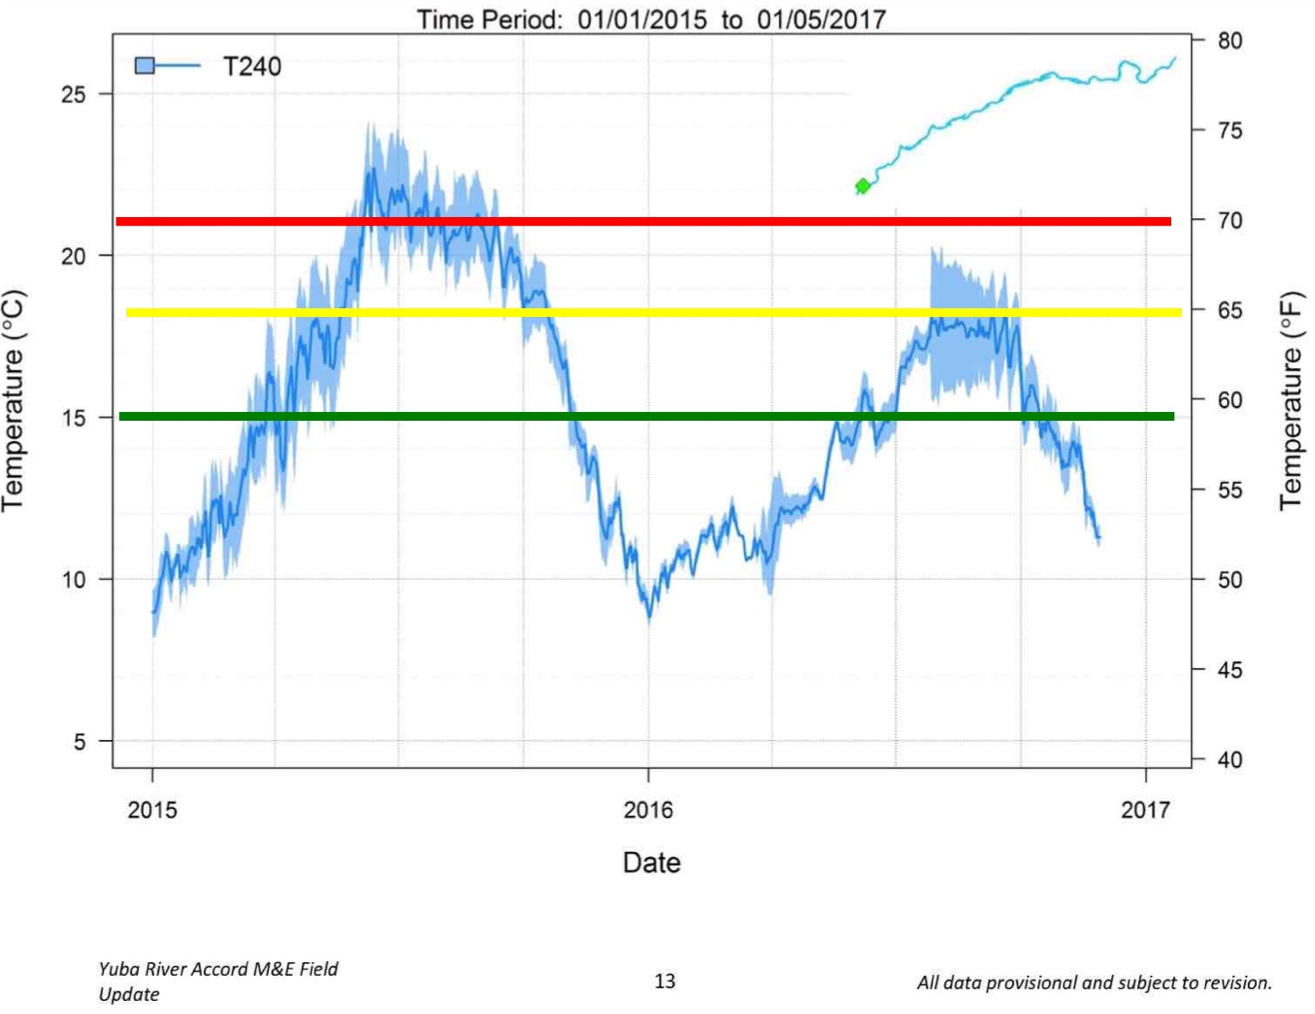
Figure 4. Water temperature in the lower Yuba River at Marysville in 2015 and 2016. Red line is water temperature detrimental to adult salmon survival, passage, and egg viability. Yellow line denotes high stress level above 65°F. Green line is safe level below which adult survival and egg viability are good. Note: August 2015 water temperatures reached above 70°F; September-October 2015 water temperatures reached 65-70°F range. Source: Yuba River Accord M&E Field Update.