Water Year 2023 (10/1/22-9/30/23) in the Central Valley was very wet, with exceptional hydrology. With the state’s salmon fishery closed and plentiful water there had been some optimism for the 2023 salmon runs. But there was also concern as to how much this year’s salmon runs would be affected by the poor water years 2020-2022.
The Mokelumne River system is achieving hoped-for outcomes from its salmon management. Over 20,000 salmon adult salmon have been counted moving upstream past the Woodbridge counting facility. The counting facility on Battle Creek has counted only about 5,000 salmon, in a system whose adult return are generally far greater than those on the Mokelumne. What happened?
- Reasons for Strong Run in Mokelumne River – News reports and interviews with hatchery managers indicate a record high escapement of fall-run salmon to the Mokelumne River and hatchery. Factors that likely contributed to the strong run include the following:
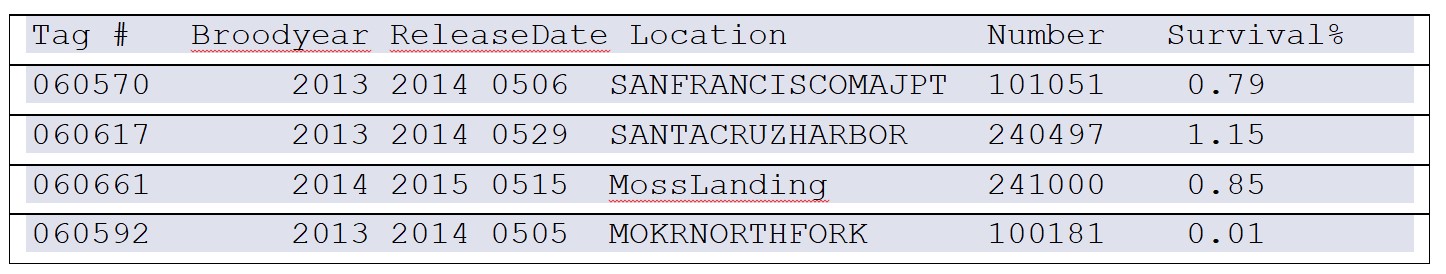
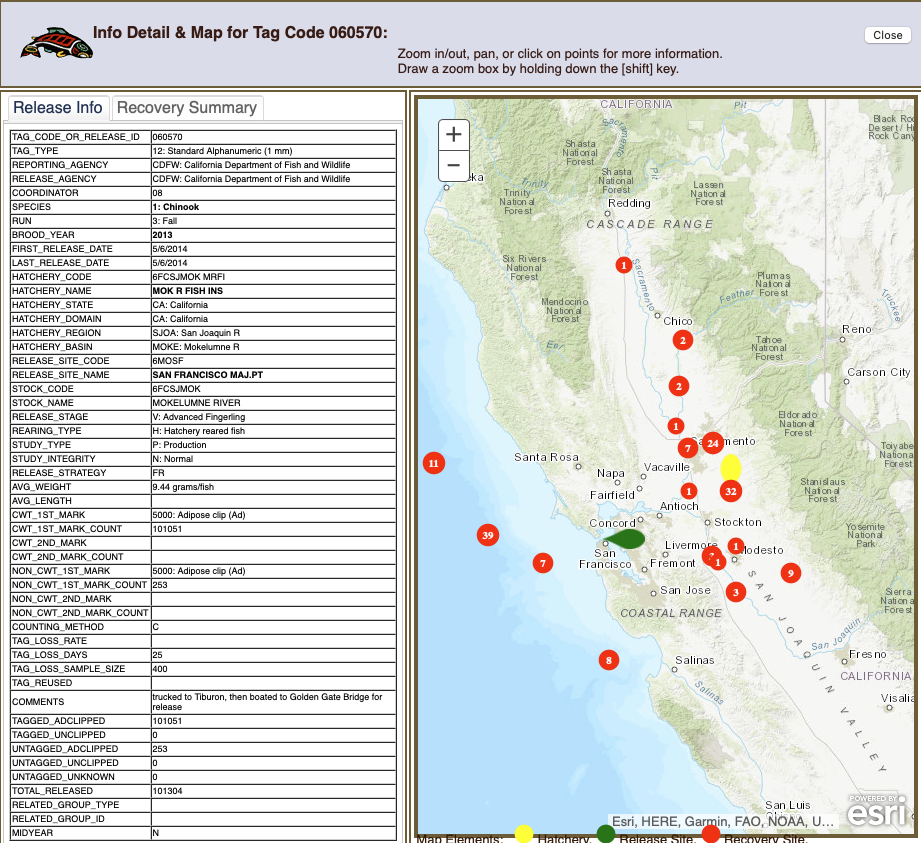
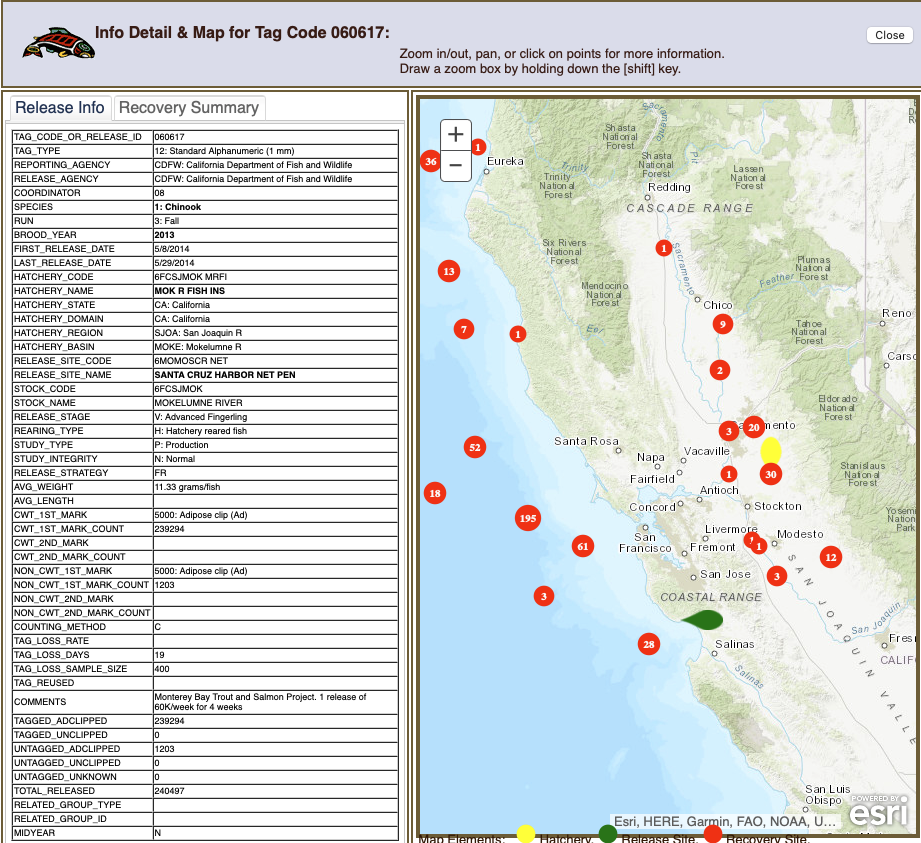
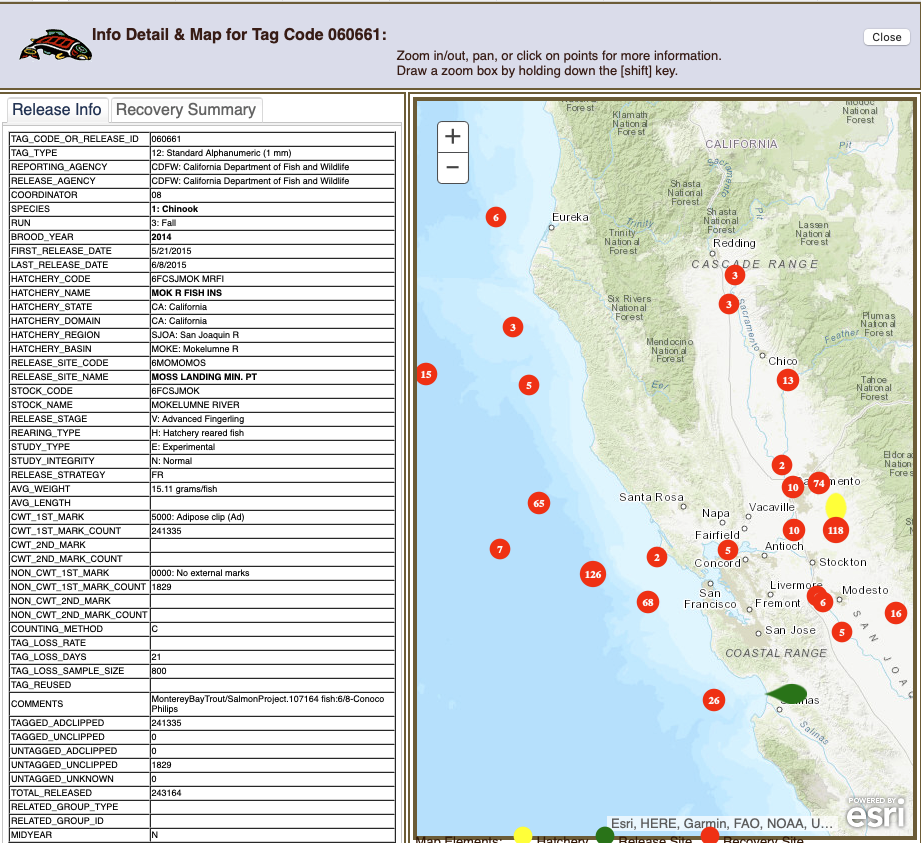
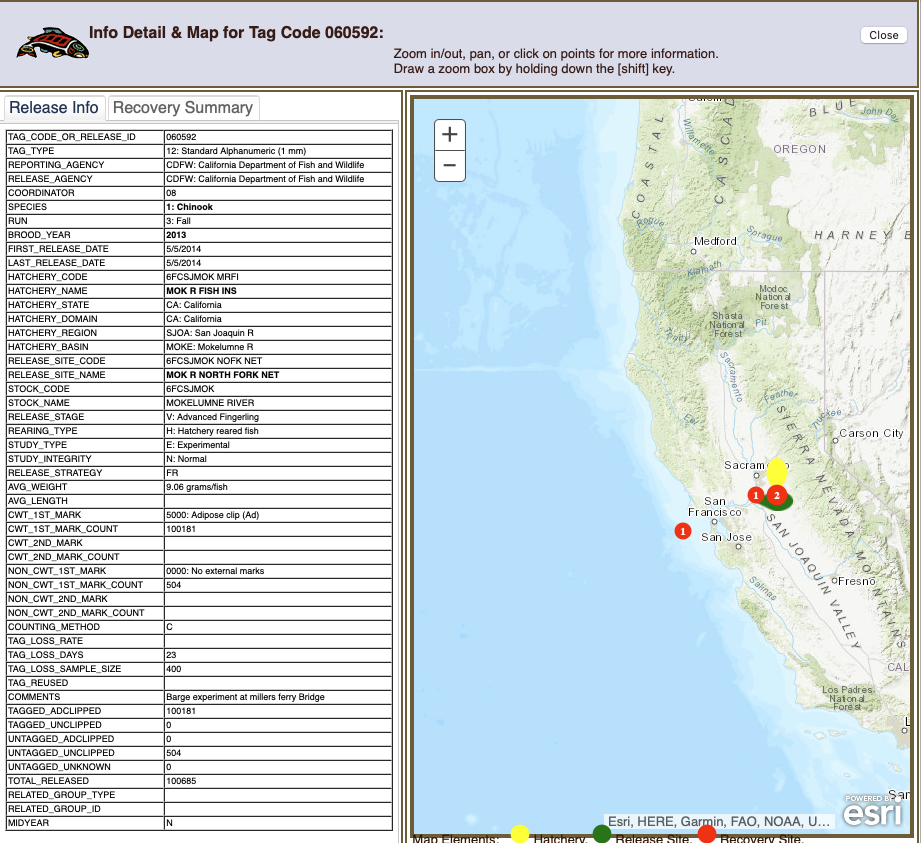
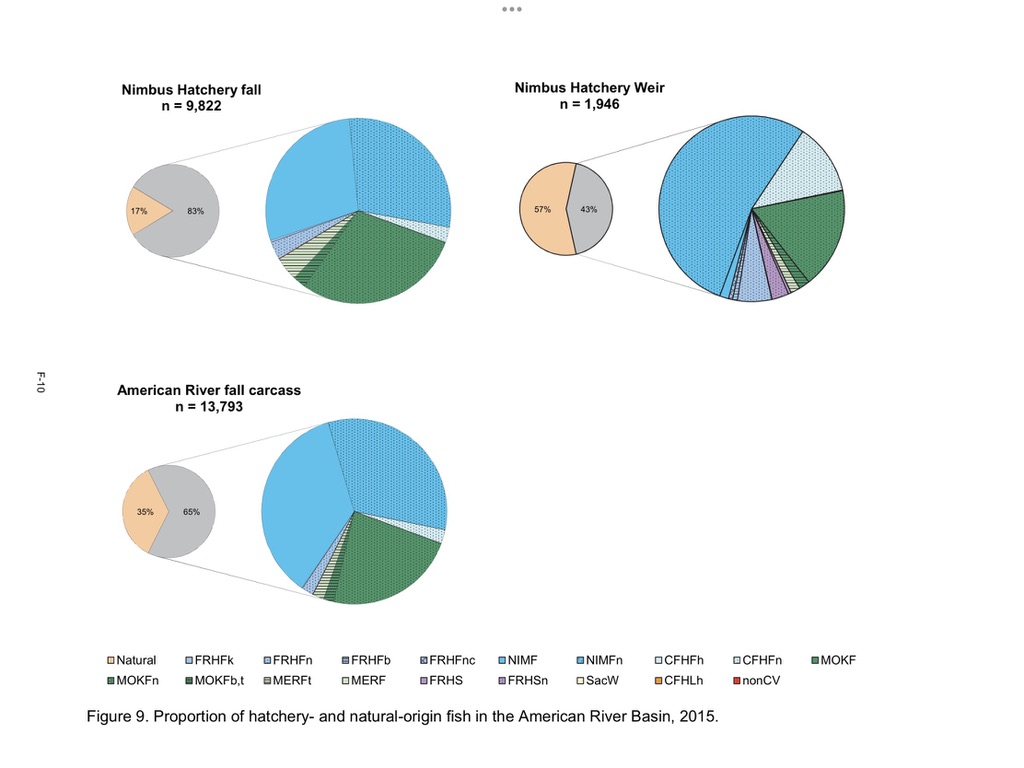
- Of the 21 million fall-run smolts produced and released by the Mokelumne Hatchery during drought years 2020-2022, about half were released to coastal harbors and half released to Sherman Island sites on the lower San Joaquin River channel in the Delta (Table 1). These releases likely made up the vast majority of Mokelumne River returns in 2023 of age 2-4 adult returns.1 Past survival rates for such coastal and Delta releases are among the highest for Central Valley hatchery fall-run salmon smolt releases. Coastal releases regularly have survival rates 5 times the rates of the Delta releases and 10 or more times the rates of Mokelumne River in-river releases. No releases were made to the Mokelumne River below the hatchery from 2020-2022. Straying rates of adults returning from the Mokelumne Hatchery off-site smolt releases often exceed 50%, with most going to the American River and lesser amount returning to the Feather and Merced rivers. Strays from hatcheries on those rivers also return to the Mokelumne River.
b. The Mokelumne River has prescribed summer-fall attraction flows for fall-run salmon (Figure 1). However small in magnitude, they seem to attract adult salmon.
- Of the 21 million fall-run smolts produced and released by the Mokelumne Hatchery during drought years 2020-2022, about half were released to coastal harbors and half released to Sherman Island sites on the lower San Joaquin River channel in the Delta (Table 1). These releases likely made up the vast majority of Mokelumne River returns in 2023 of age 2-4 adult returns.1 Past survival rates for such coastal and Delta releases are among the highest for Central Valley hatchery fall-run salmon smolt releases. Coastal releases regularly have survival rates 5 times the rates of the Delta releases and 10 or more times the rates of Mokelumne River in-river releases. No releases were made to the Mokelumne River below the hatchery from 2020-2022. Straying rates of adults returning from the Mokelumne Hatchery off-site smolt releases often exceed 50%, with most going to the American River and lesser amount returning to the Feather and Merced rivers. Strays from hatcheries on those rivers also return to the Mokelumne River.
- Reasons for Poor Winter-Run and Fall-Run Salmon Runs in Upper Mainstem Sacramento River and Battle Creek – News reports and hatchery news releases indicate a very low run for salmon in Battle Creek and the upper Sacramento River in 2023.
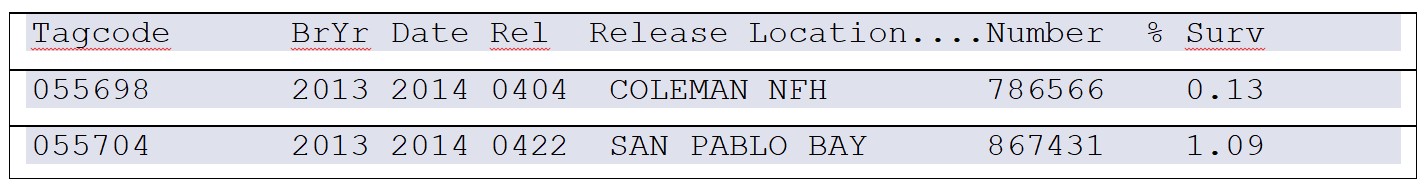
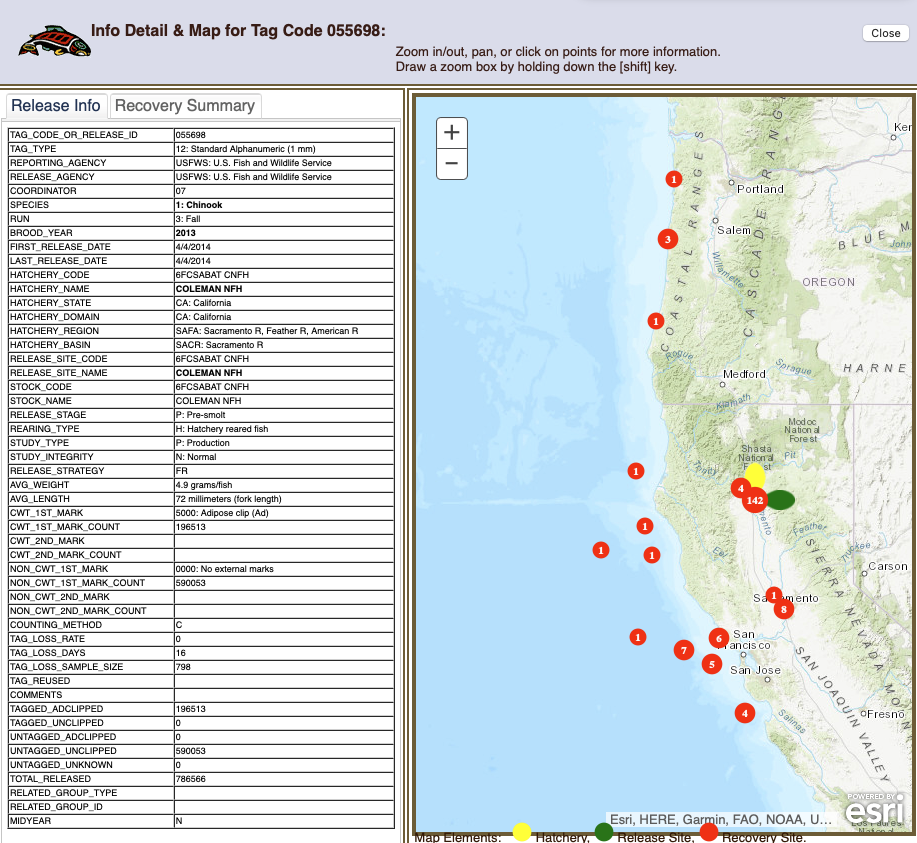
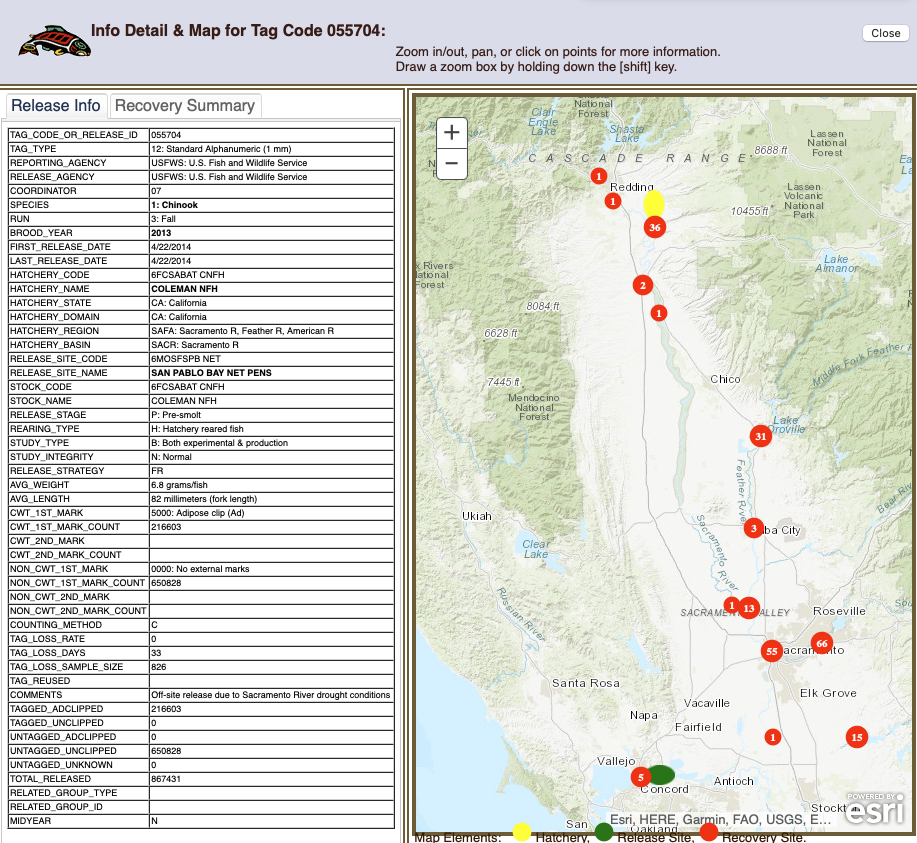
- a. All hatchery smolt releases from the Coleman Fish Hatchery on Battle Creek and the Livingston Stone Fish Hatchery on the Sacramento River in Redding in 2020-2022 were to the upper river near the two hatcheries. In prior years, survival was low for river releases in drought years and higher for Bay-Delta releases (Table 2).
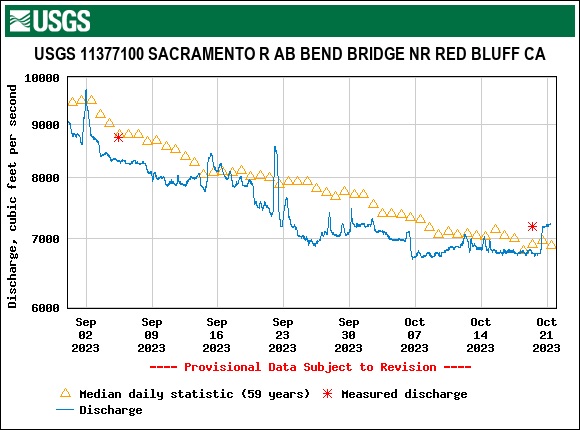
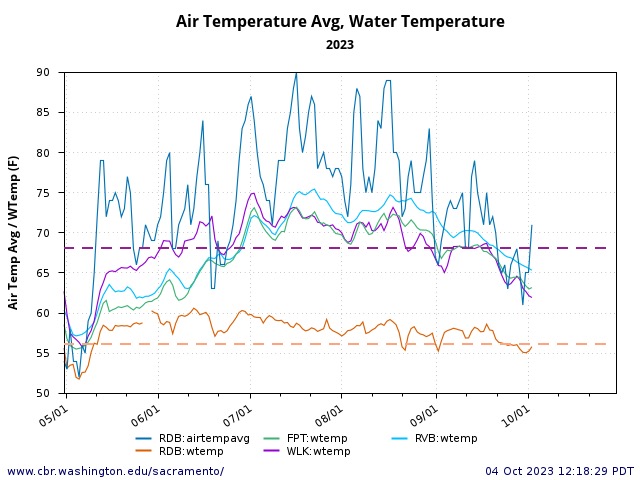
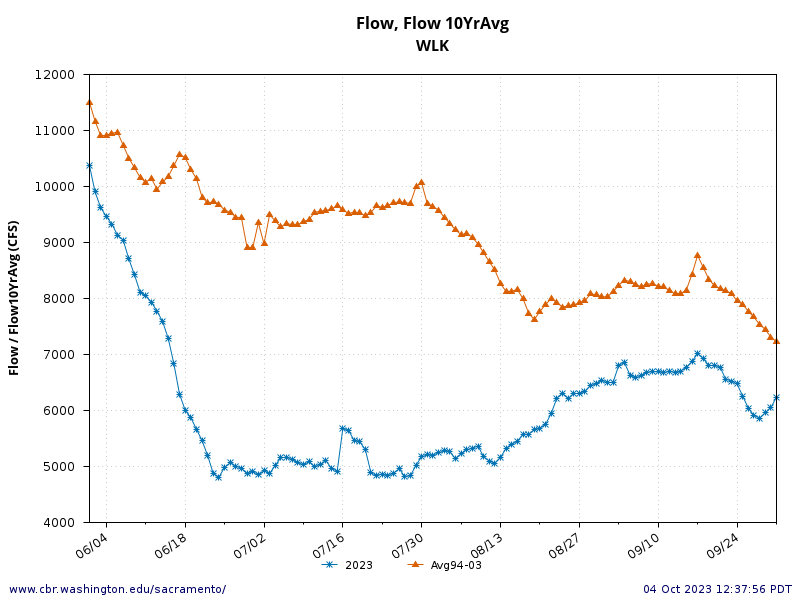
- River conditions in the Sacramento River are generally poor (high water temperatures and low flows) in drought years like 2021 for late winter and early spring hatchery releases and wild salmon emigration. Overall outmigration success in every year but one has been poor since 2008, and is trending downward (Figure 2). However, in late winter and early spring 2021, a natural flow pulse occurred in the upper river that helped move the hatchery and wild smolts downstream (Figures 3 and 4).
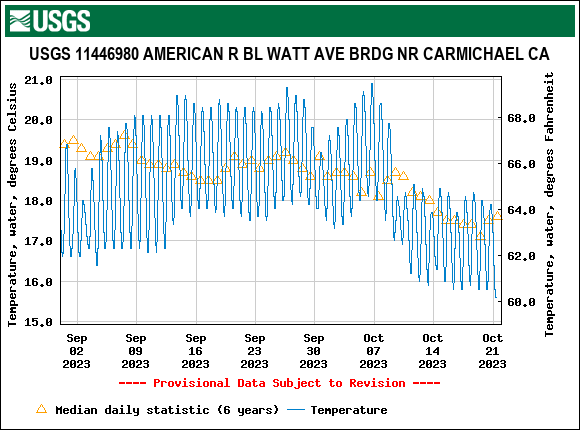
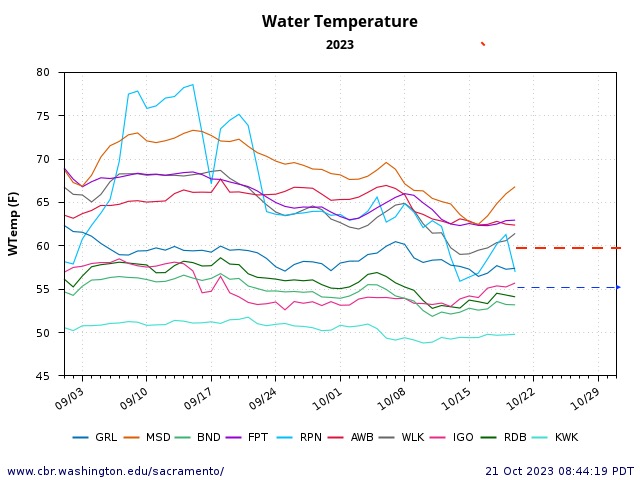
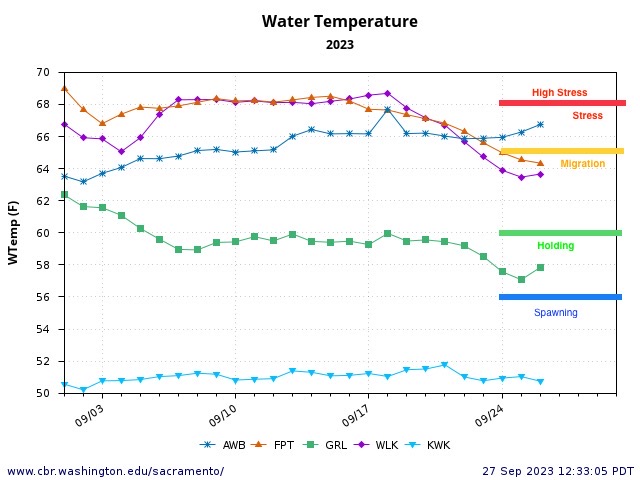
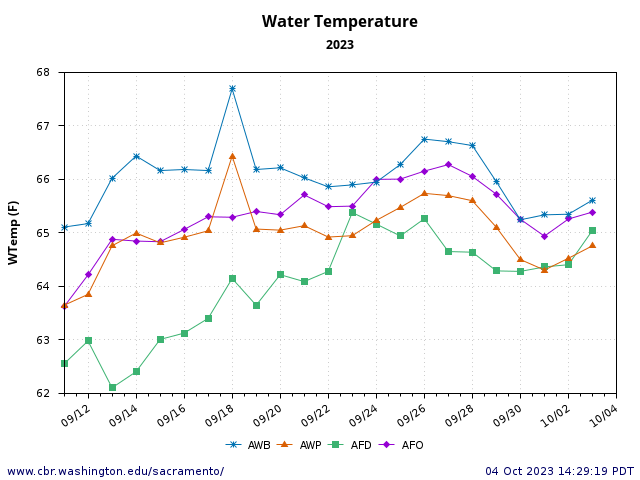
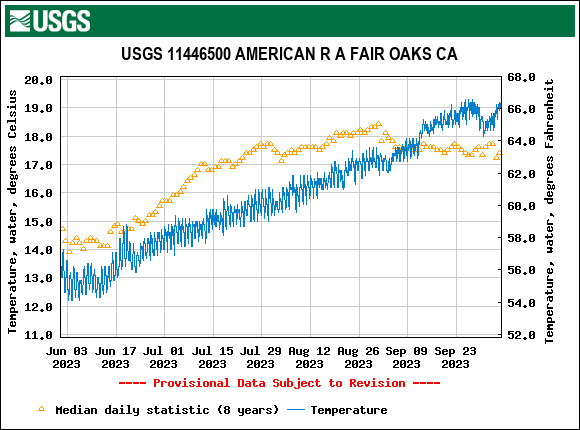
- Water temperatures in the lower reaches of the Sacramento River were high when adult salmon were migrating upstream towards the upper Sacramento River and Battle Creek (and hatchery) (Figure 5).
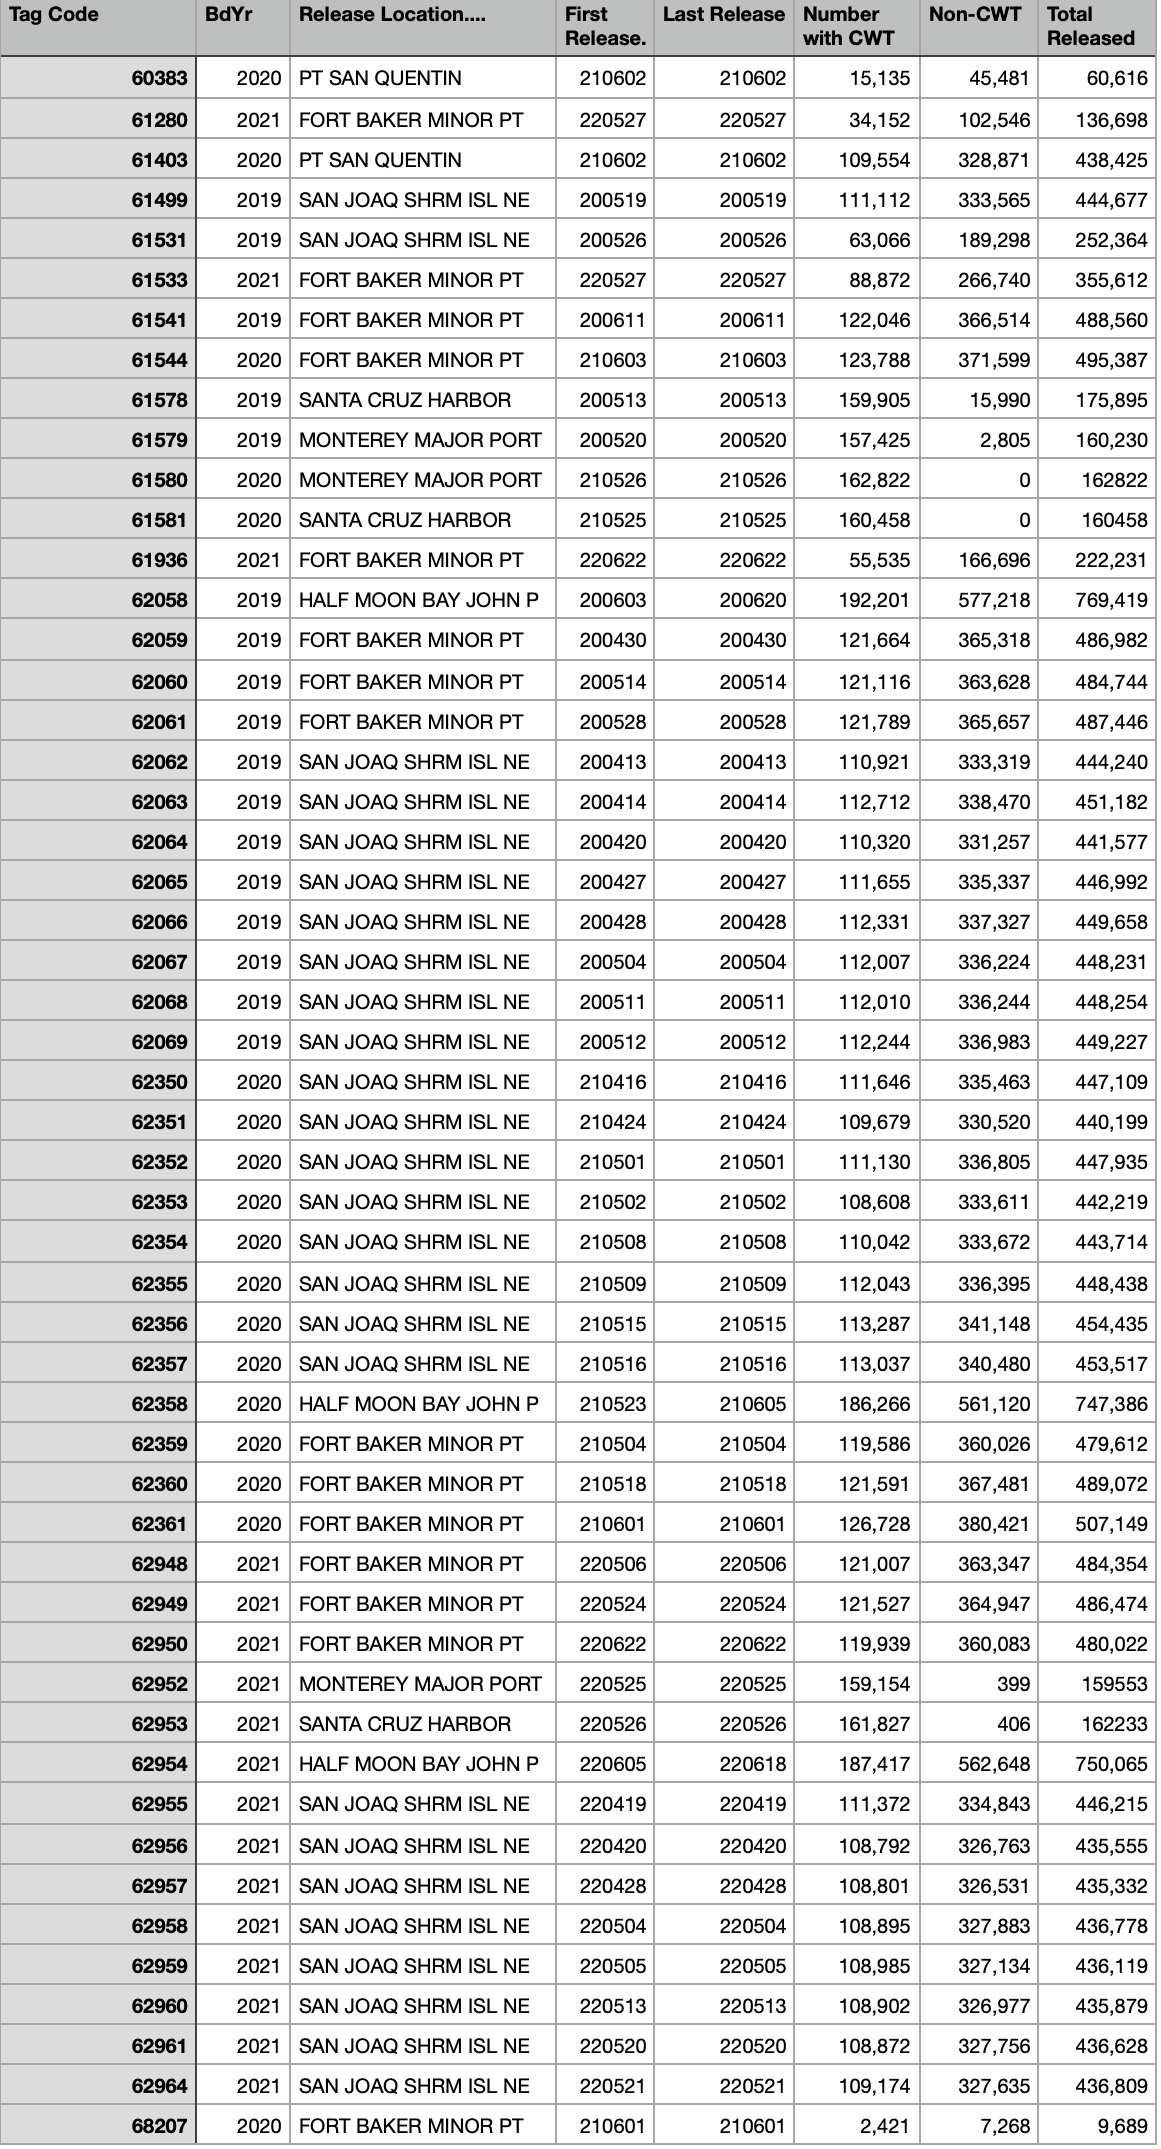
Table 1. Tag groups of Mokelumne Hatchery fall-run smolts released in spring by location in 2020-2022 (brood years 2019-2021).
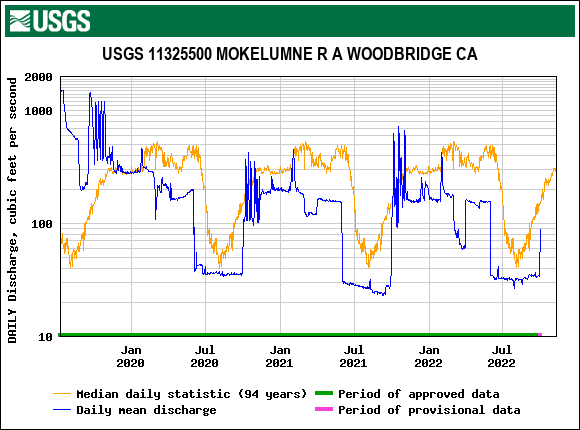
Figure 1. Streamflow of lower Mokelumne River at Woodbridge gage in water years 2020-2022 and long term average. Note October attraction flows and winter pulse flows.
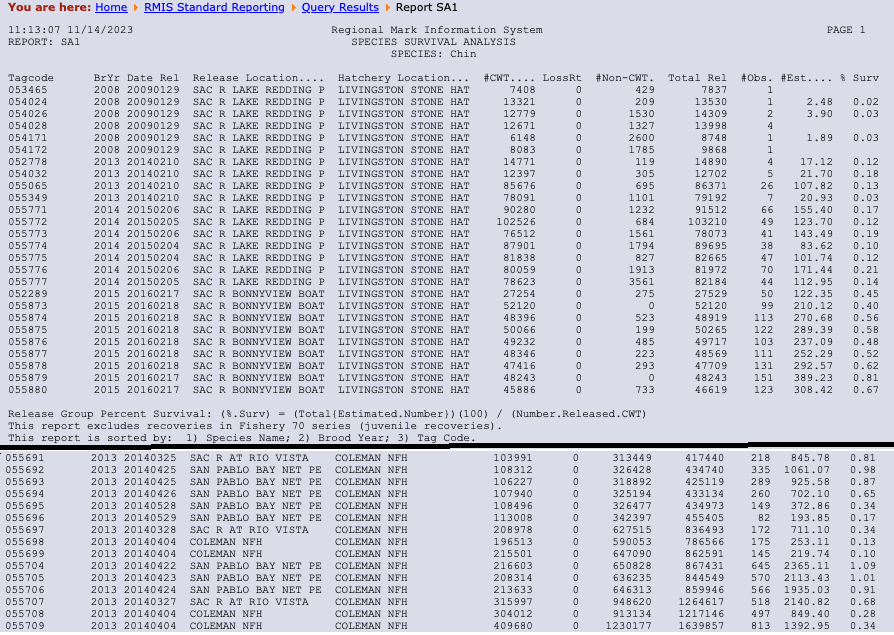
Table 2. Survival table for selected winter-run and fall-run smolt release groups from the Livingston Stone Hatchery and Coleman Hatchery during critical drought years 2009, 2044, 2015 and normal year 2016.
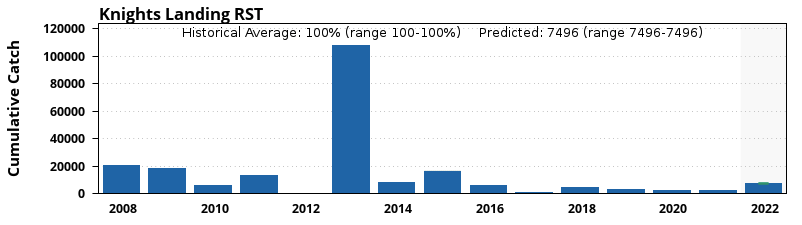
Figure 2. Broodyear index for juvenile fall-run salmon catch in the lower Sacramento River at Knights Landing rotary screw trap 2008-2023. Source
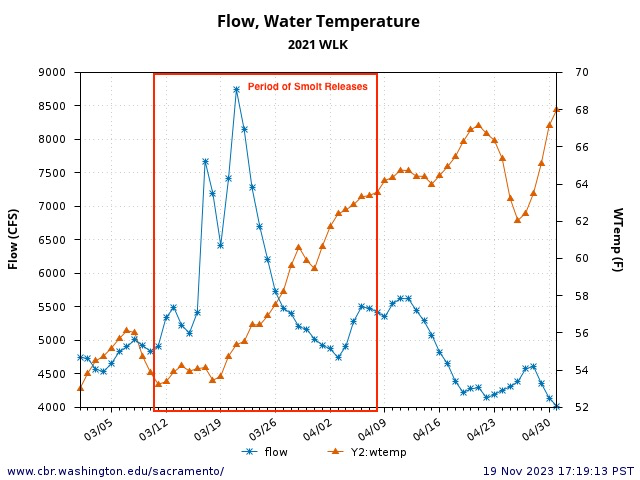
Figure 3. Water temperature and streamflow in the lower Sacramento River at Wilkins Slough in March-April 2021. Red outline is period of (upstream) Coleman Hatchery smolt releases.
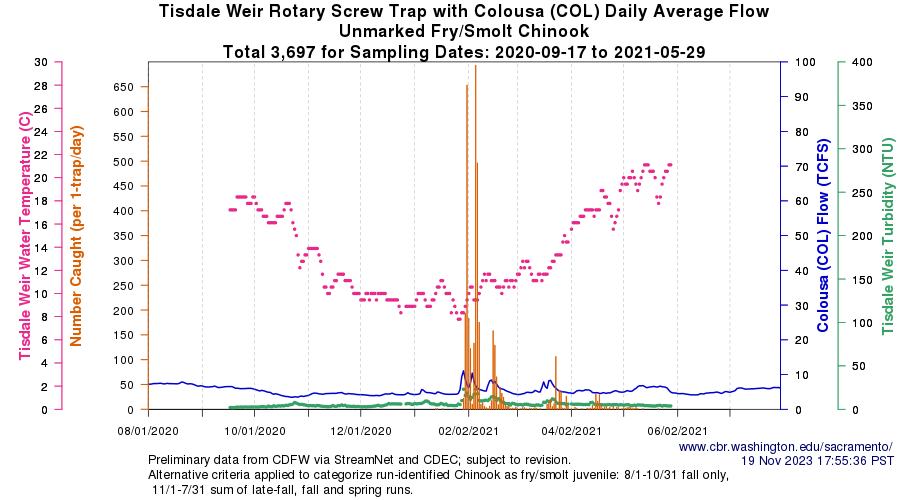
Figure 4. Tisdale screw trap collections of winter-run smolts in the lower Sacramento River in fall-winter of water year 2021. Source
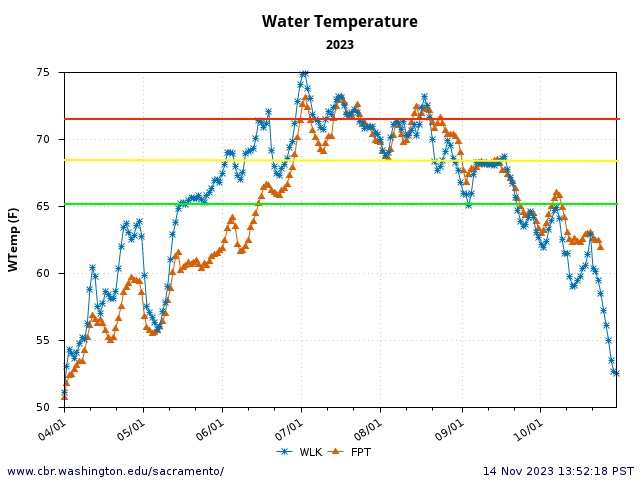
Figure 5. Water temperatures in the lower Sacramento River at Wilkins Slough and Freeport during adult salmon immigration period in 2023. Green line represents safe level for adult migration. Yellow line is stress level and water quality standard. Red line is high stress and avoidance level.
- Only partial 2020-2022 returns have been recorded for broodyear 2019 releases on the RIMS code-wire-tag database. Two-year old returns appear complete and show over 50% of returns to river-hatchery escapement was to the American River, particularly Nimbus Hatchery. ↩