In my last update, March 2019, I summarized the population trends of winter-run Chinook salmon through 2017. In this post I include run estimates for 2018 and 2019. The trend indicates the population is recovering from the poor runs in 2016 and 2017 (Figures 1and 2), which were the consequence of poor spawning and rearing conditions.
The improvement is the result of more hatchery contributions and better natural contributions. The strong spawner-recruit relationship continues (Figure 3), with an improved 2019 run that spawned (in hatchery and wild) in summer of normal year 2016 and reared and emigrated during wet water year 2017. In contrast, the poor 2016 and 2017 runs were a consequence of critical drought conditions during spawning (2013 and 2014) and rearing/emigration (fall-winter of water years 2014 and 2015). The 2017 run could have been even worse had hatchery smolt releases not been doubled in winter 2015.
NMFS (2019) concluded the recovery was due to increased hatchery contributions and “better water management”. The latter is simply not true. Year 2017 was a wet year that contributed to good fall-winter survival of broodyear 2016 (Figure 4). By December 2019 NMFS knew that its draft biological opinion was being revised to limit protections.1
The prognosis for the 2020 run (from brood year 2017) is good given wet year summer spawning and incubation conditions in 2017 and normal year winter 2018 conditions. With hatchery stocking back to the normal 200,000 annual smolt level in the Sacramento River at Redding, a run of 3000-5000 can reasonably be expected despite the depleted spawning run in 2017. High summer egg-to-fry survival in 2017 (Figure 4) will also contribute. The 2020 run may also benefit from the initial release of 215,000 winter run hatchery smolts into Battle Creek in 2018. Some of these will return as two-year-old “jacks and jills” in 2020.
Several factors make the prognoses for the 2021 and 2022 (and future) runs less optimistic. Egg/fry survival of wild winter-run was lower again in 2018 and 2019 (Figure 4). The new (October 2019) federal Biological Opinion for winter-run is less protective than the Opinion it replaced,2 and the Bureau of Reclamation’s new water management is explicitly directed toward maximizing water deliveries.
On the positive side, hatchery releases including releases into Battle Creek continued in 2019 and 2020, and the estimates of migrating juvenile winter-run were higher for brood year 2019 in wet summer 2019 (Figure 5). As a result of a Settlement Agreement with CSPA, the State Water Board has required the Bureau of Reclamation to develop new protocols to meet water temperature requirements in the Sacramento River. It remains to be seen how these protocols translate into practice.
In the past three decades, the essential needs for winter-run salmon have not been met.3 Management of winter-run salmon must improve survival of wild eggs and juveniles in the summer spawning and fall-winter rearing-emigration seasons, with supplementary hatchery smolt releases as necessary. We cannot simply rely on wet years to keep wild winter-run salmon going in the Sacramento River.
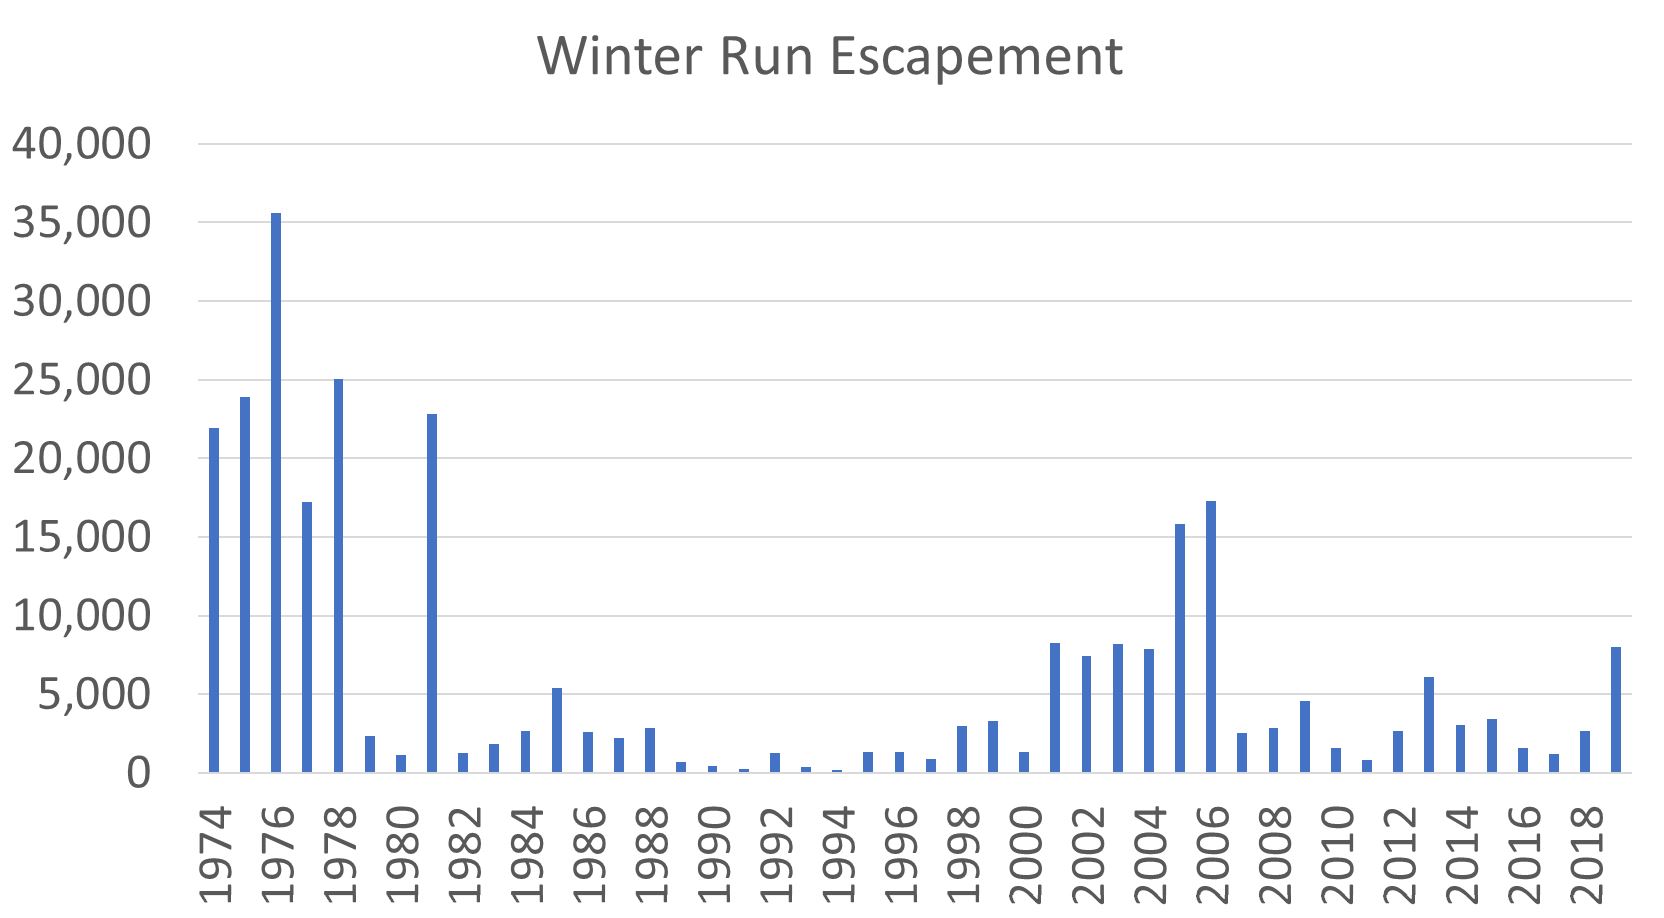
Figure 1. Spawning population estimates of adult winter-run salmon in the upper Sacramento River from 1974 to 2019. Source: CDFW GrandTab and NMFS.
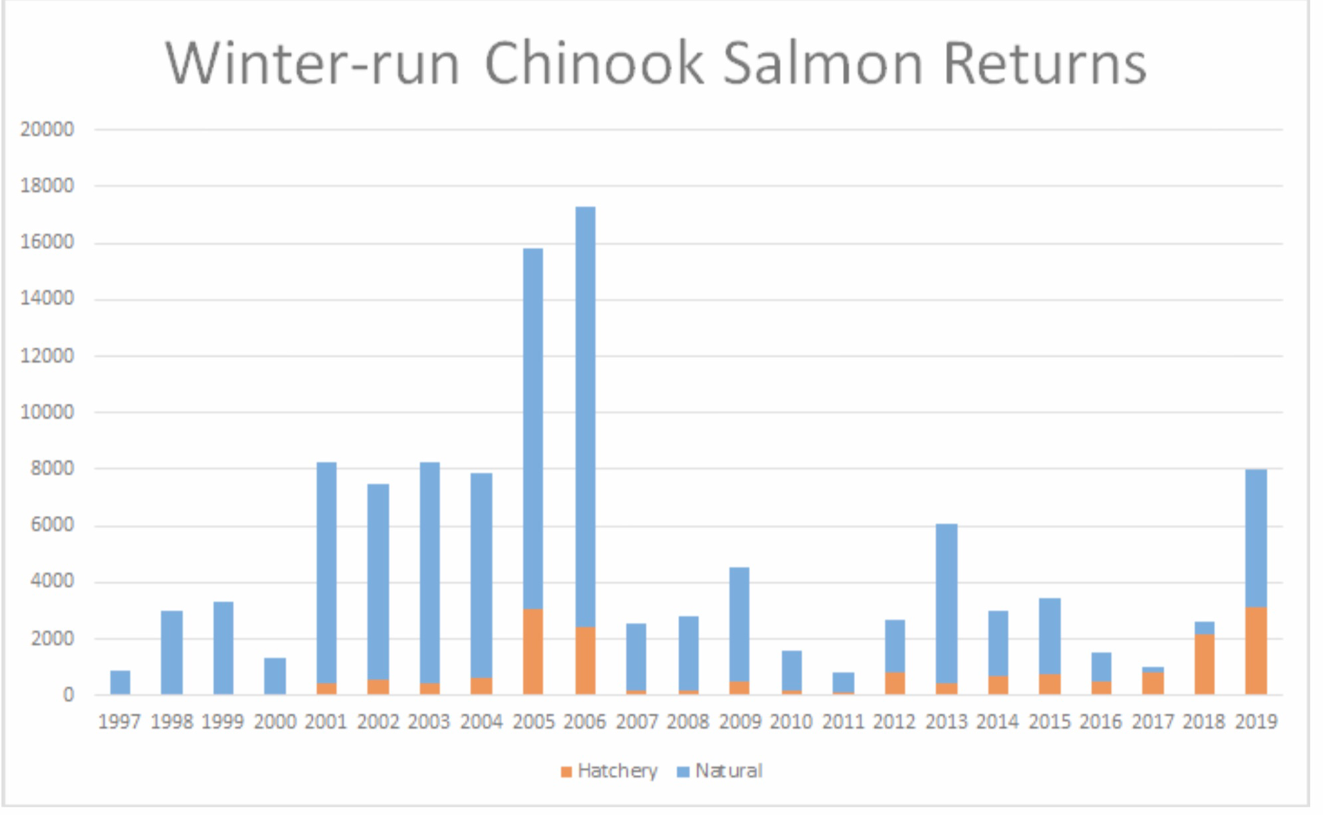
Figure 2. Spawning population estimate since 1997 showing proportion of hatchery and wild adult spawners. Source: NMFS (2019).
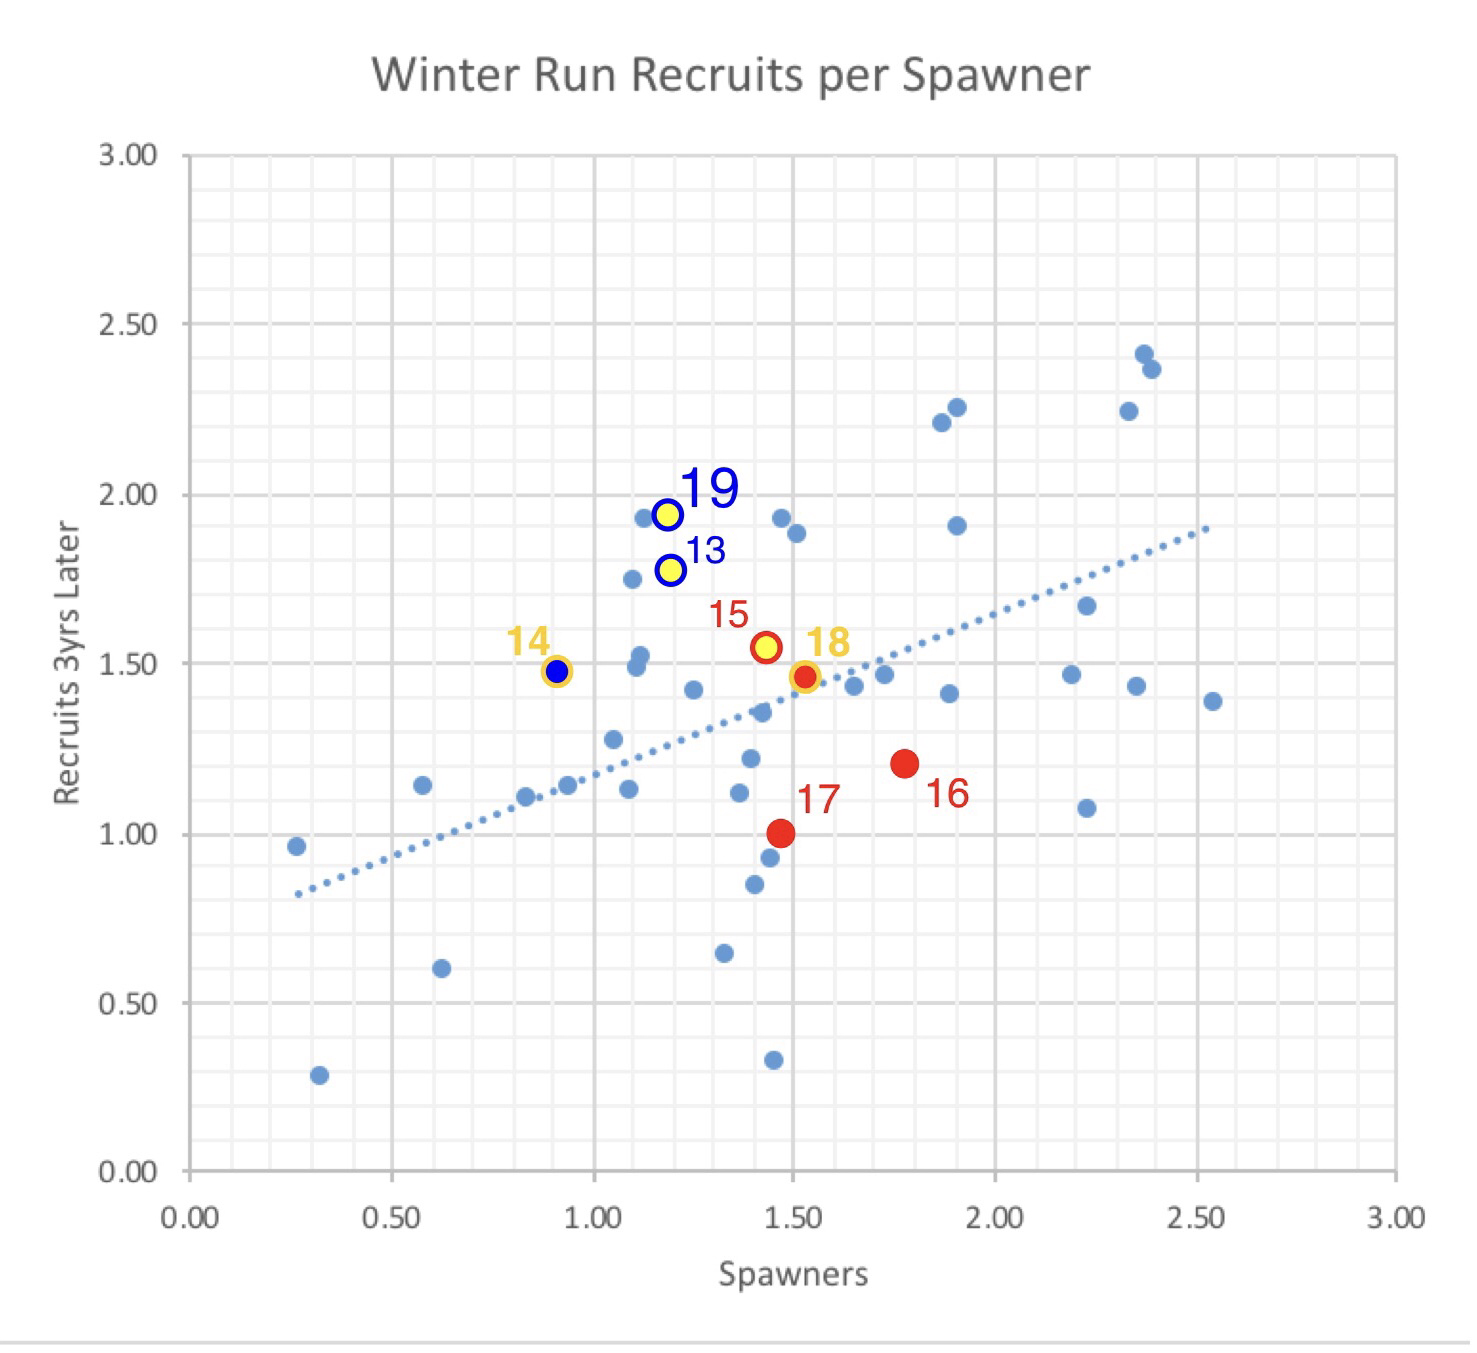
Figure 3. Spawners versus recruits (spawners three years later) transformed (logx minus 2). Year is recruit year spawners. For example, 2017 is the run size for 2017, representing spawners from brood year 2014. Color denotes water-year type in fall-winter rearing/emigration year: bold red is critical year, non-bold red is dry year, yellow is below-normal year, and blue is wet year. For example, red 15 and dot margin represent critical water year 2013. Yellow dot fill represents spawning year was a below-normal water year. Note 2016 and 2017 had both critically dry year summer spawning and fall-winter rearing-emigration. The blue 2019 point is a preliminary estimate.
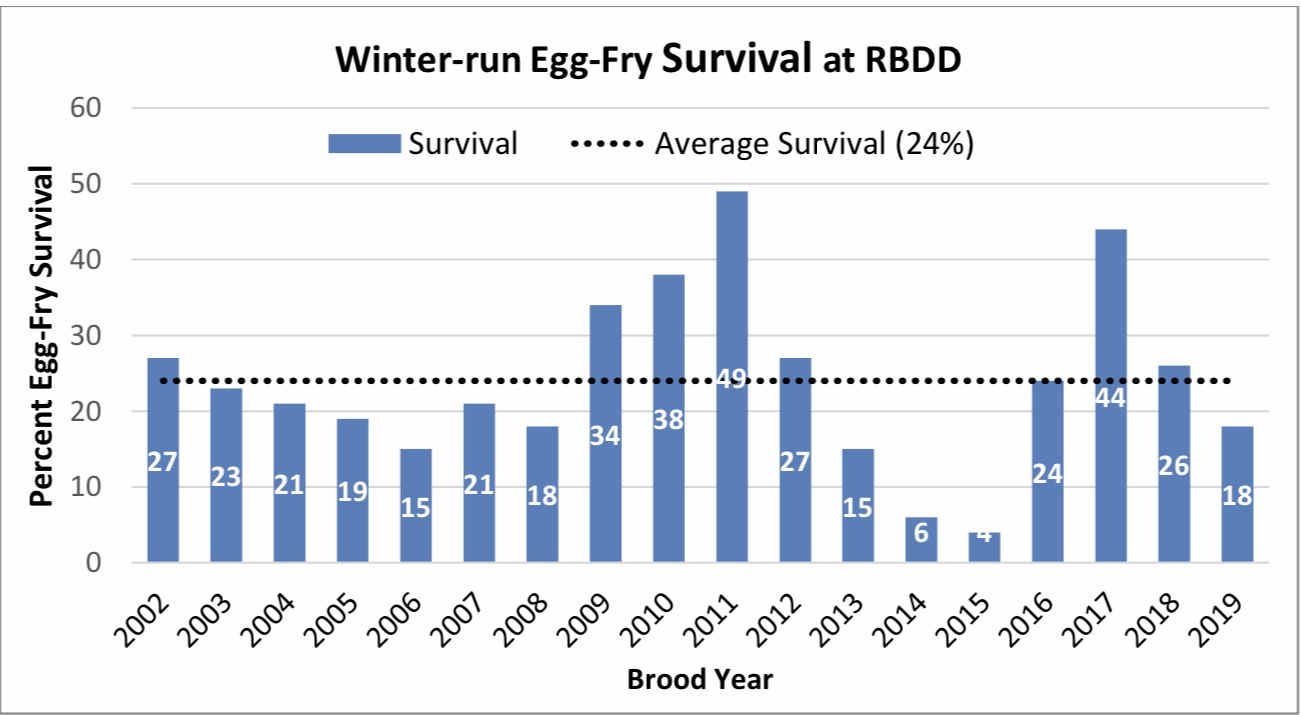
Figure 4. First summer survival rate by brood year based on egg and fry production rate estimates. Egg number is derived from adult spawner estimates. Fry number is derived from Red Bluff screw trap estimates. Source: NMFS.
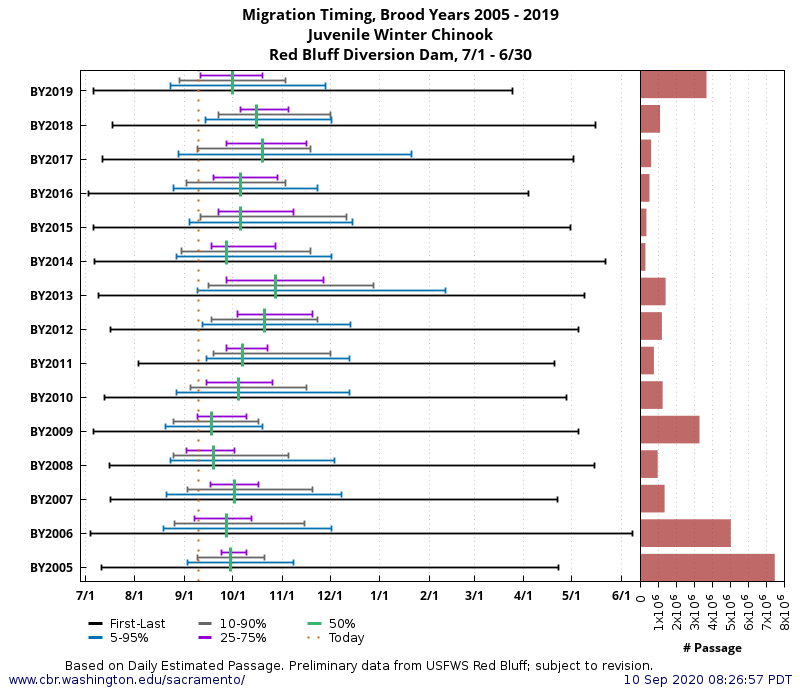
Figure 5. Brood year winter-run salmon early life history and abundance (2005-2019) as measured at Red Bluff. Source: http://www.cbr.washington.edu/sacramento/tmp/hrt_1599751617_74.html