The Sacramento River Temperature Task Group’s report on water year 2015 released at the end of last year prematurely proclaimed successful operations for 2015 under its Temperature Control Plan (TCP). If the Group had waited a few more months, it would have reported utter failure, with the poorest survival and production of winter-run salmon yet recorded. Below, I excerpt from the Report, and offer some observations.
In summary, water year 2015 has been one of the driest years in decades and it followed three consecutive dry years throughout the state. Shasta Reservoir was projected to have end of year storage of 1.1 MAF in the May 90% forecast. Due to such low storage in Shasta Reservoir, Reclamation utilized Trinity River water to conserve Shasta Reservoir storage. The amount of water brought over from Trinity River through the Spring Creek Tunnel into Keswick Reservoir was a great benefit to the temperature operations on the Sacramento River. In all, Reclamation achieved meeting the TCP at Clear Creek (see Chart 1) of 57°F not to exceed 58°F through October 1, 2015, as indicated in the Temperature Management Plan, when 90% of the redds were emerging.
Comment: The Trinity water brought into Keswick Reservoir was 58-59°F, warmer than even the downstream criteria, resulting in more of the Shasta cold-water pool being used to cool it. The problem was recognized by the parties, as it resulted in demands to replace the existing Whiskeytown temperature curtain to cool the Trinity water before it was released into Keswick Reservoir. Achieving the 2015 goal of not exceeding 58°F turned out ineffective as well. Less than normal amounts of Trinity water have been brought into Keswick so far in 2016.
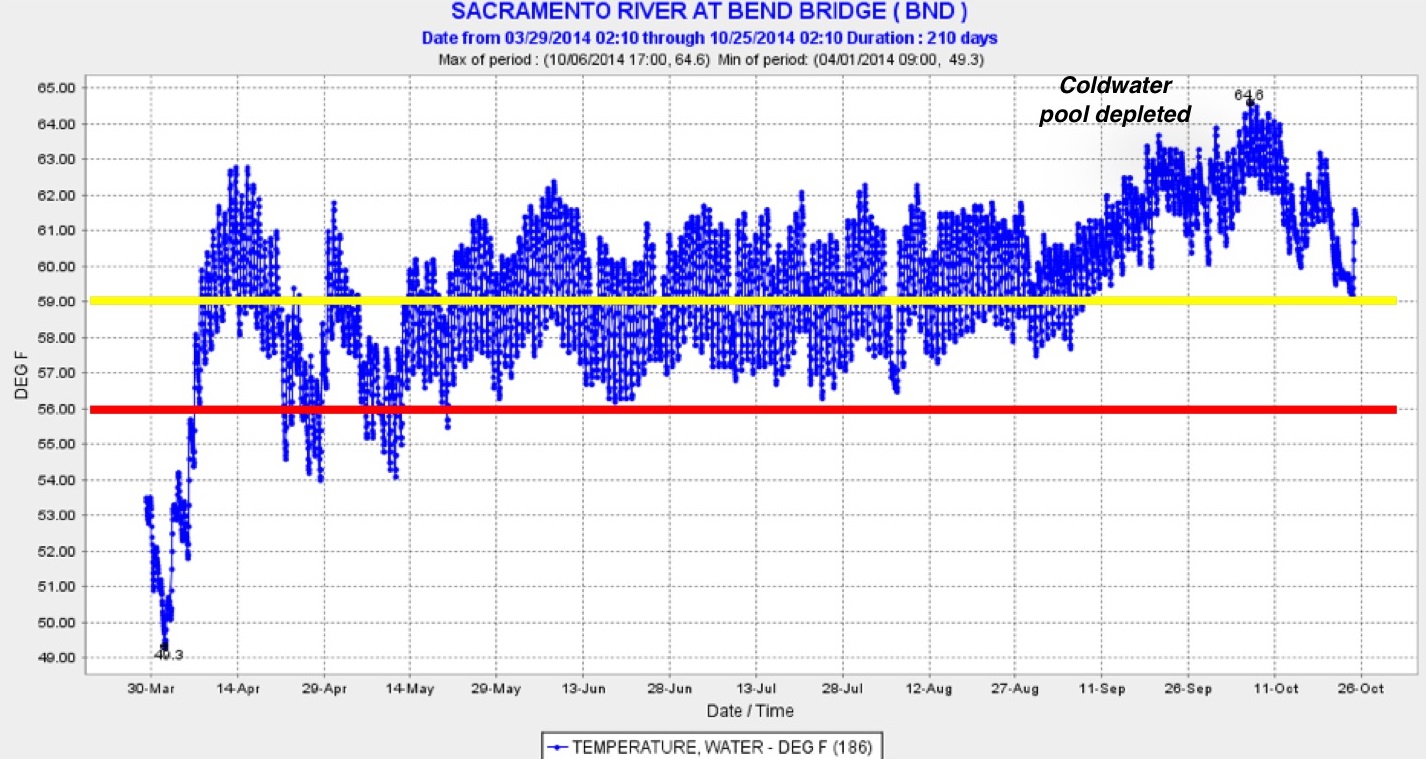
Despite the SRTTG best projection and modeling efforts to manage Sacramento River water temperature for winter-run spawning and egg incubation in water year (WY) 2014, winter-run brood year (BY) 2014 was considered a year class failure. One hundred percent of BY 2014 redds were exposed to temps above 56°F daily average temperature (DAT) at the Sacramento River above Clear Creek California Data Exchange Center monitoring station temperature compliance point (CCR) at some time period during WY 2014. Of significant concern were those eggs, alevin, and fry exposed to the elevated DAT above 56°F (and as high as 62.3°F) throughout September and October when the cold water pool out of Shasta Reservoir was depleted.
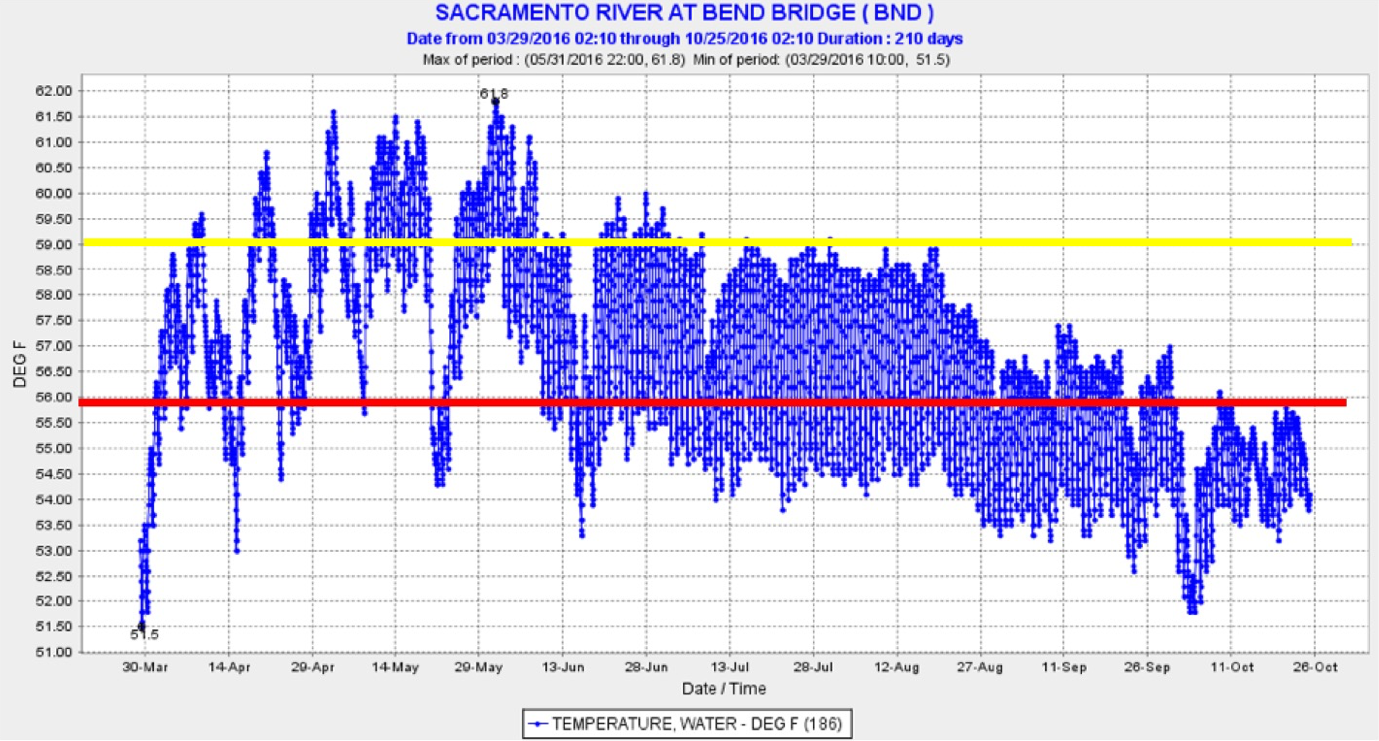
Comment: So the Task Group met the monthly average but allowed the daily average temperature to exceed 58°F in summer 2015 (Charts 2 and 3). The Report suggests improvement compared to 2014 conditions, but 2015 was also above 56°F. On 10% of the days in summer 2015, hourly water temperature exceeded 60°F at the CCR gage at Bonnyview Bridge in Redding during warm afternoons. On 60% of the days, water temperature reached or exceeded 59°F, the tolerance limit for salmon eggs and embryos.
Temperature monitoring results of 70 loggers indicated slight variation and stratification in temperature between in-river, backwater, and deep pools, but in general all winter-run salmon eggs and alevins were exposed to poor water quality due to warm water temperatures.
Comment: If they knew this, why did they allow it?
The plan called for real-time operations that targeted 57° at the Clear Creek compliance location not to exceed 58°F with minimized flows. By targeting 57°F not to exceed 58°F, where the majority of the redds were above Hwy 44, we were able to extend the use of the cold water pool.
Comment: By targeting the Clear Creek compliance location, the Task Group pretty much assured that adult winter-run salmon would seek out cooler waters near Redding, essentially confining their spawning to the uppermost 10 miles of their historic 60 mile spawning reach. The Group extended the cold-water pool by creating low survival conditions in the spawning reach. Reclamation was able to bring in warmer Trinity water for water supply (at the expense of Shasta’s cold-water pool) and did not have to sacrifice hydropower or peaking hydropower using Shasta Dam’s warm-water bypass (an operation which most likely would have been required if the target had been the appropriate 56°F). Reclamation was also able to meet its water supply commitment of 75% allocation to the Sacramento River settlement contractors in the fourth year of drought. So far in 2016, Reclamation has met its commitment of 100% allocation to the settlement contractors.
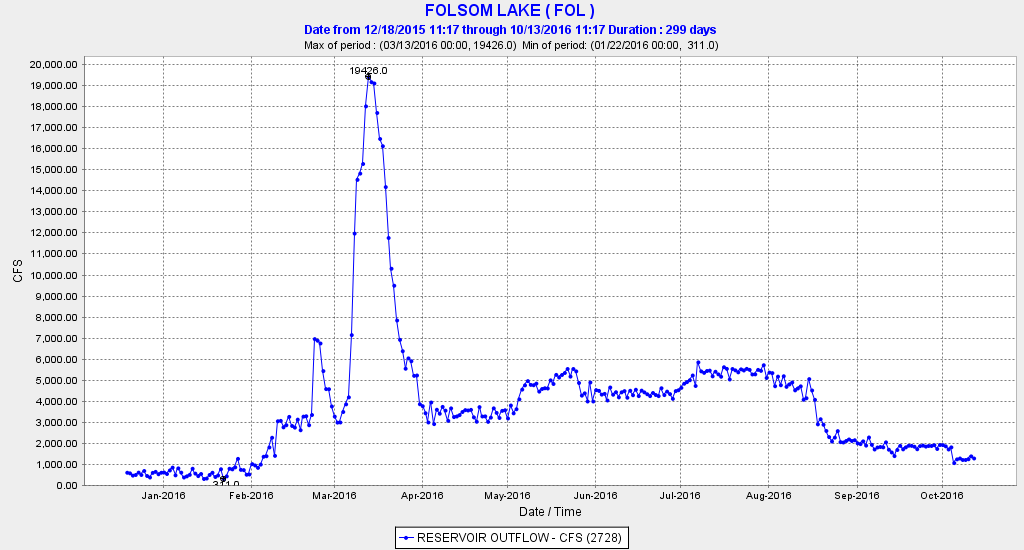
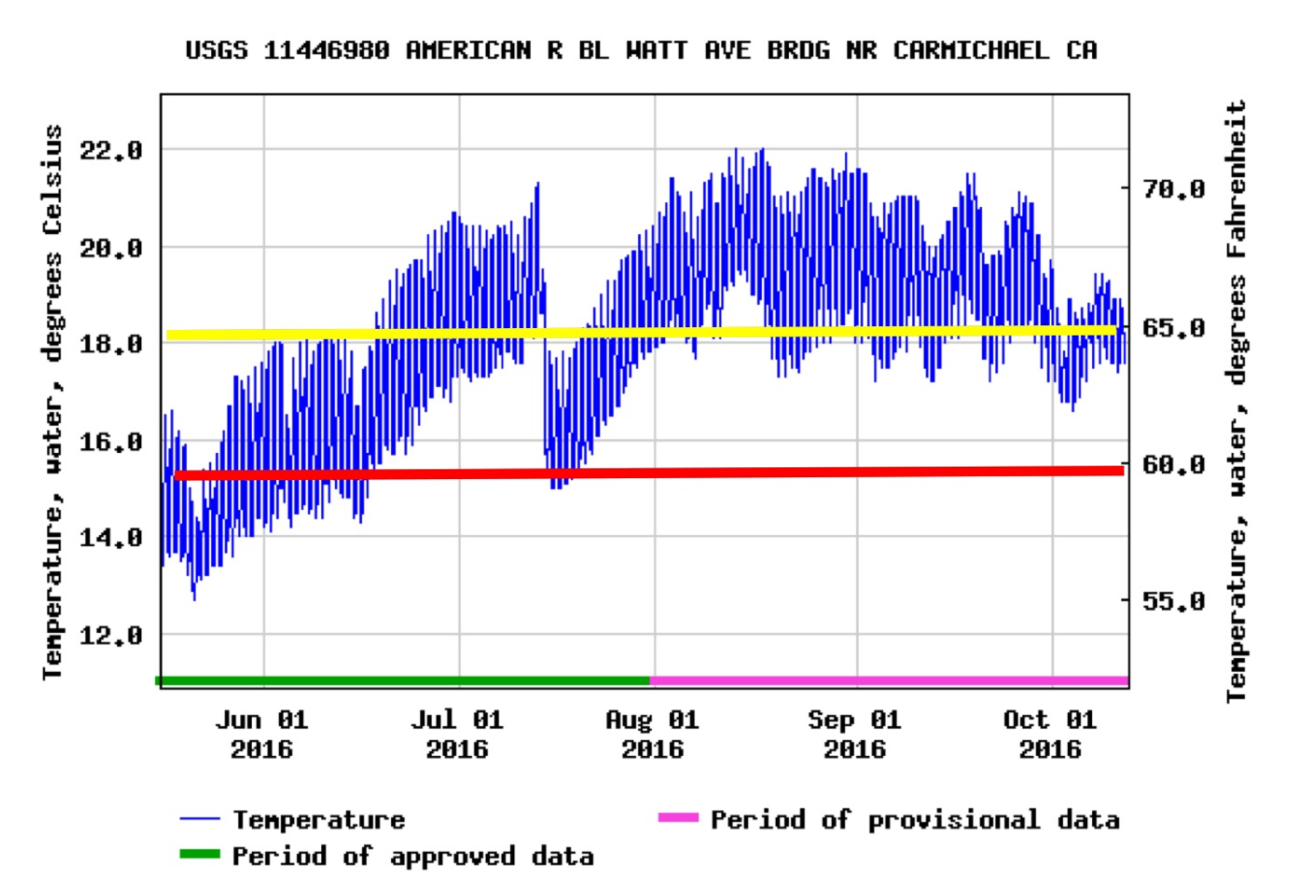
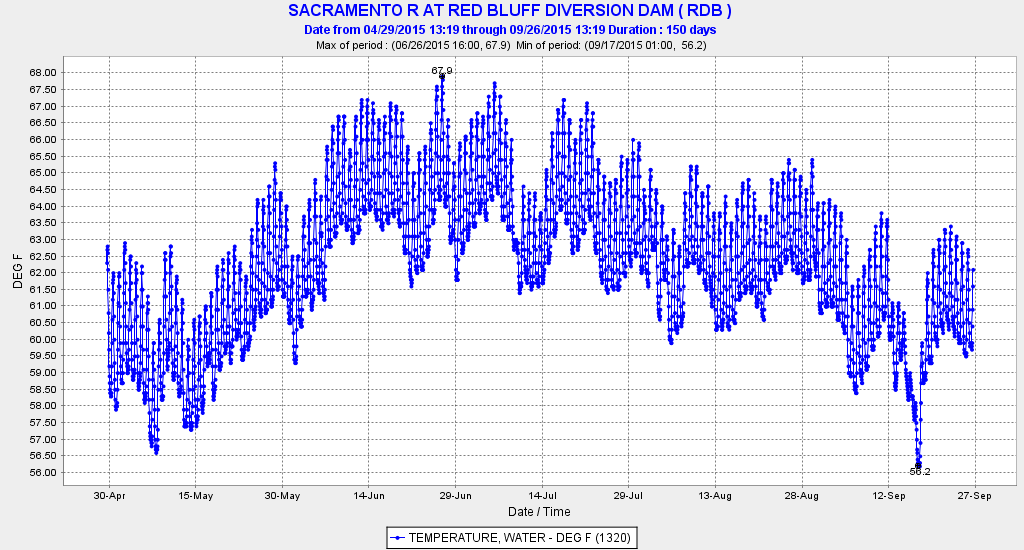
Perhaps more perplexing is what was left out of the report: water temperature and flow conditions in the salmon-migration and sturgeon-spawning reach in over 100 miles of the Sacramento River below Red Bluff. There was no mention of the Basin Plan’s targets for this reach of the river where water temperatures were too high (>22°C, 72°F) to allow adult salmon migration, while creating lethal conditions (>20°C, 68°F) for juvenile sturgeon (Chart 4). There was a complete disregard for the winter-run salmon objective of 56°C at Red Bluff in the Basin Plan, Water Right Order 90-05, and the NMFS BO: all 150 days from May through September failed to meet the objective (Chart 5). So far in 2016, the objective has yet to be met, despite the fact that Shasta was nearly full at the beginning of May.
Hopefully, the Winter Run 2016 report will be more comprehensive and complete than the Report for 2015. The 2016 Report should include not only the consequences for spawning habitat near Redding, but should also analyze the condition of rearing and migratory habitat below Redding through the fall and winter. The report should also cover consequences to the other salmon, including the ten million federal hatchery salmon smolts released near Redding.
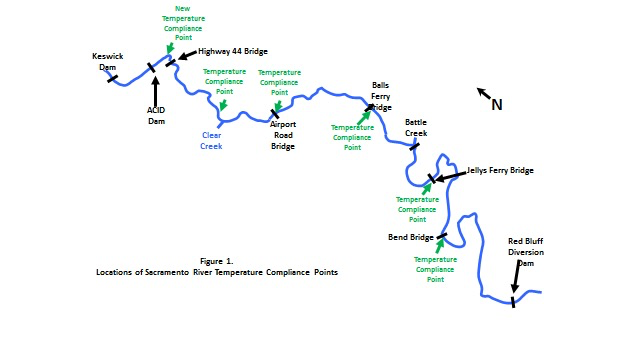
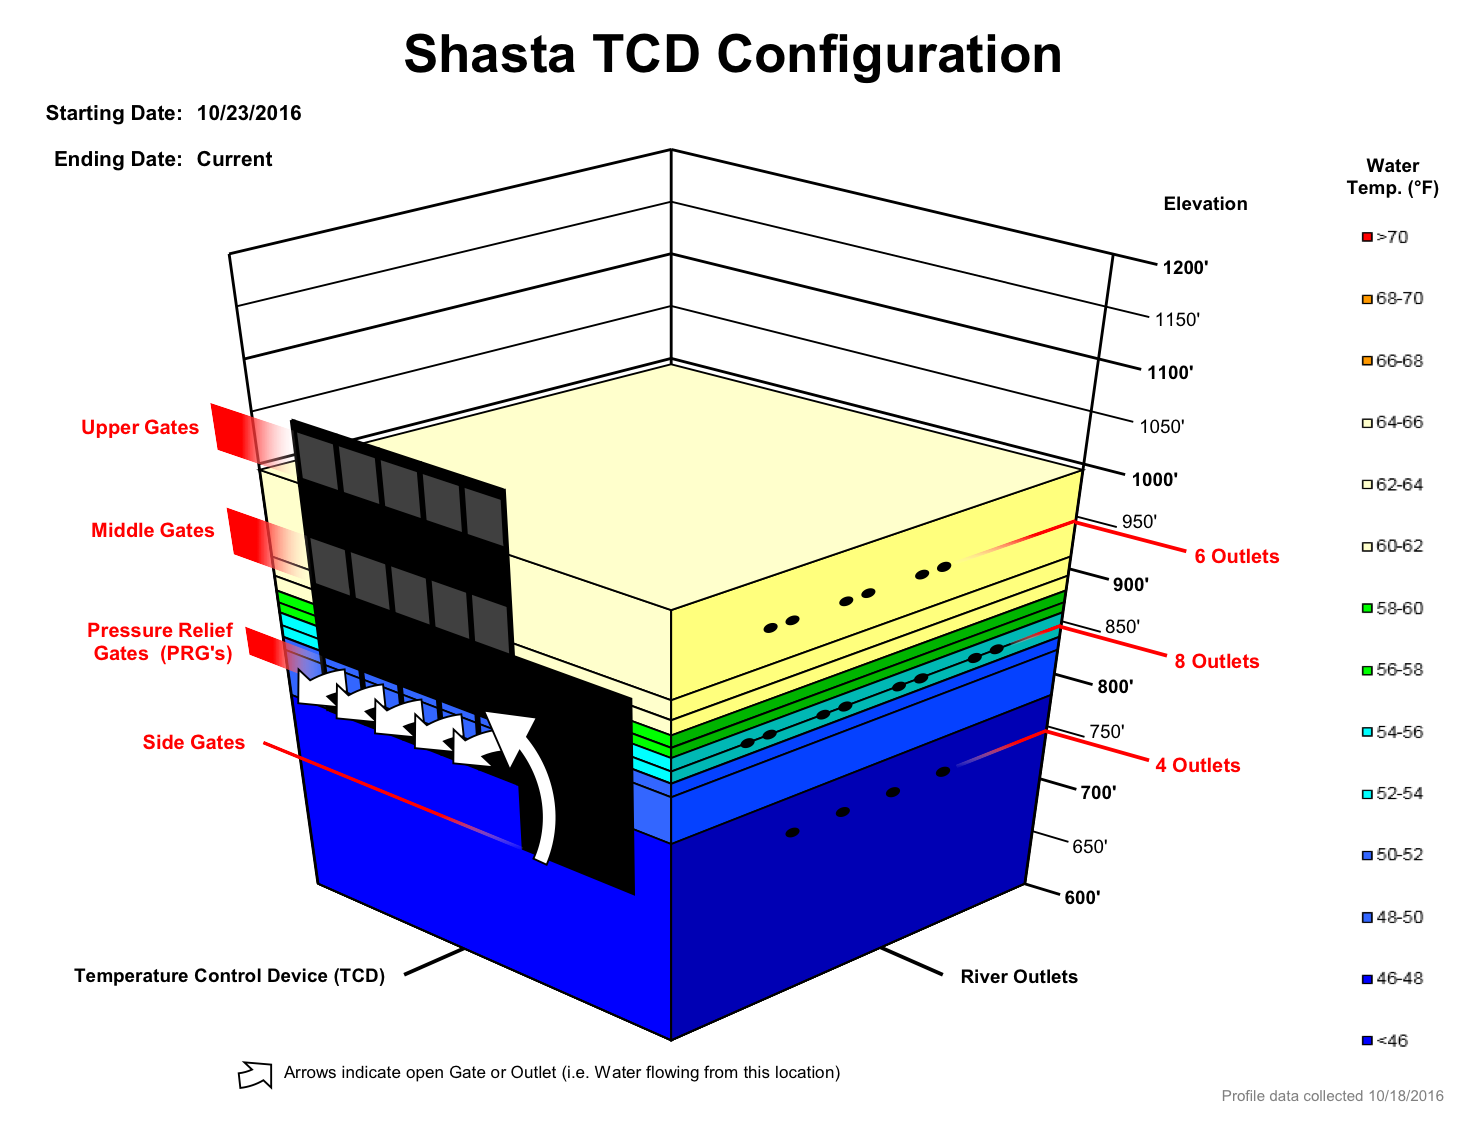
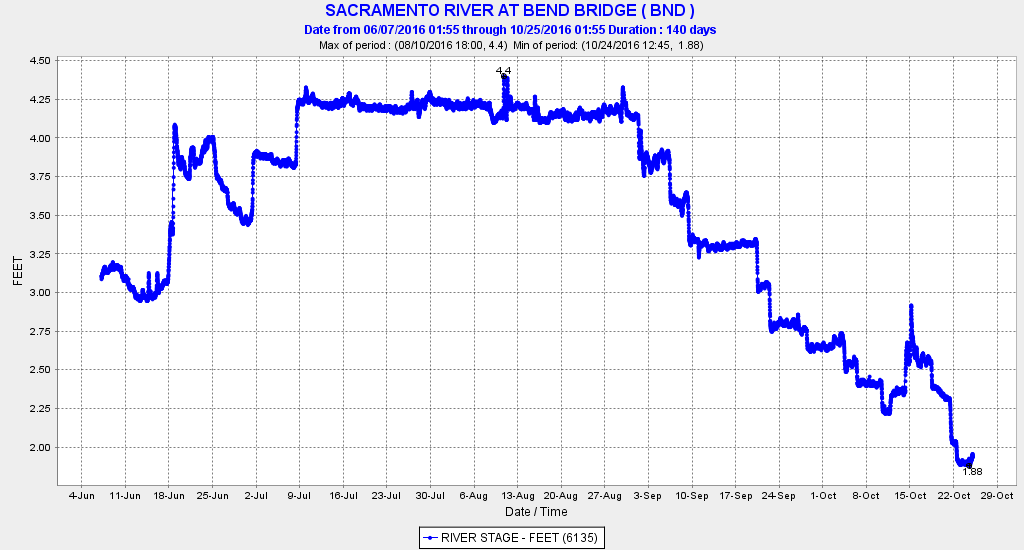
Chart 1. Map of 60 miles spawning reach below Keswick Dam on Sacramento River. Various temperature compliance points are noted. The NMFS BO specifies Bend Bridge with relaxation allowed in drier years. In 2015 the compliance point was above Hwy 44 bridge. Clear Creek 58F DAT was the compliance point in spring 2016. Balls Ferry 56°F is present compliance point in summer 2016.
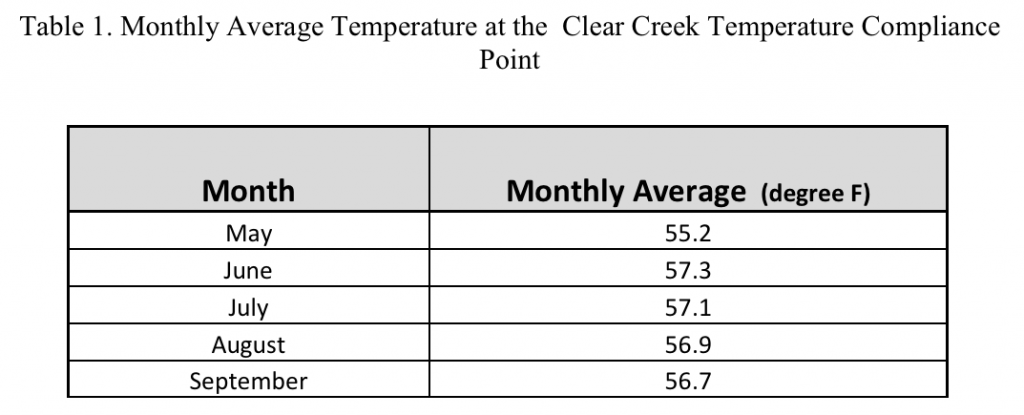
Chart 2. Summary of 2015 spring-summer monthly average temperature at Clear Creek compliance point.
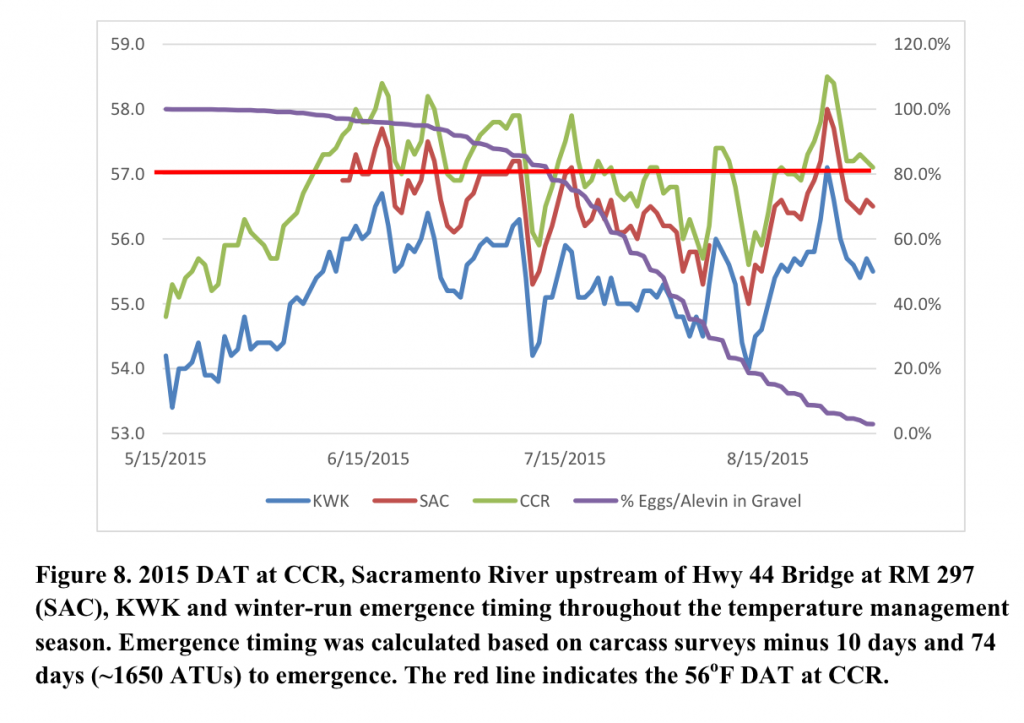
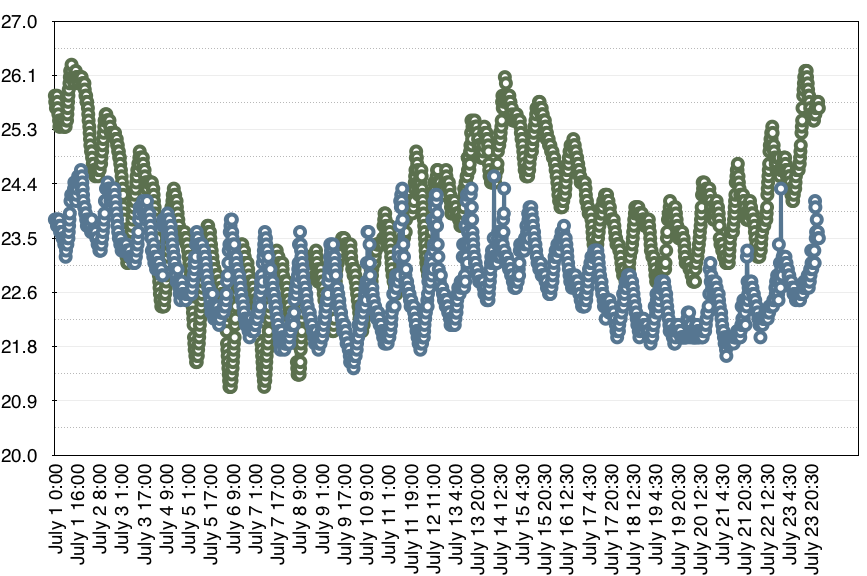
Chart 3. Summer 2015 spring-summer water temperatures at compliance locations. Note the red line is one degree above the target 56°F they noted.
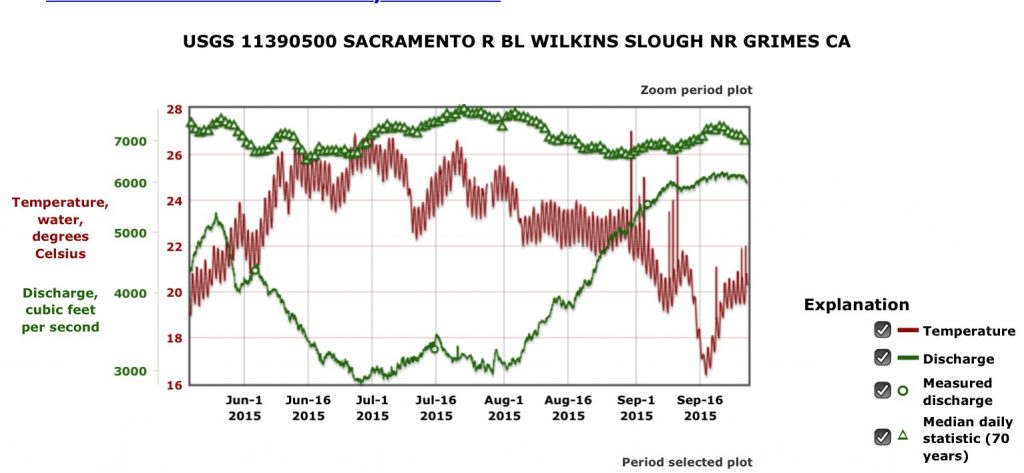
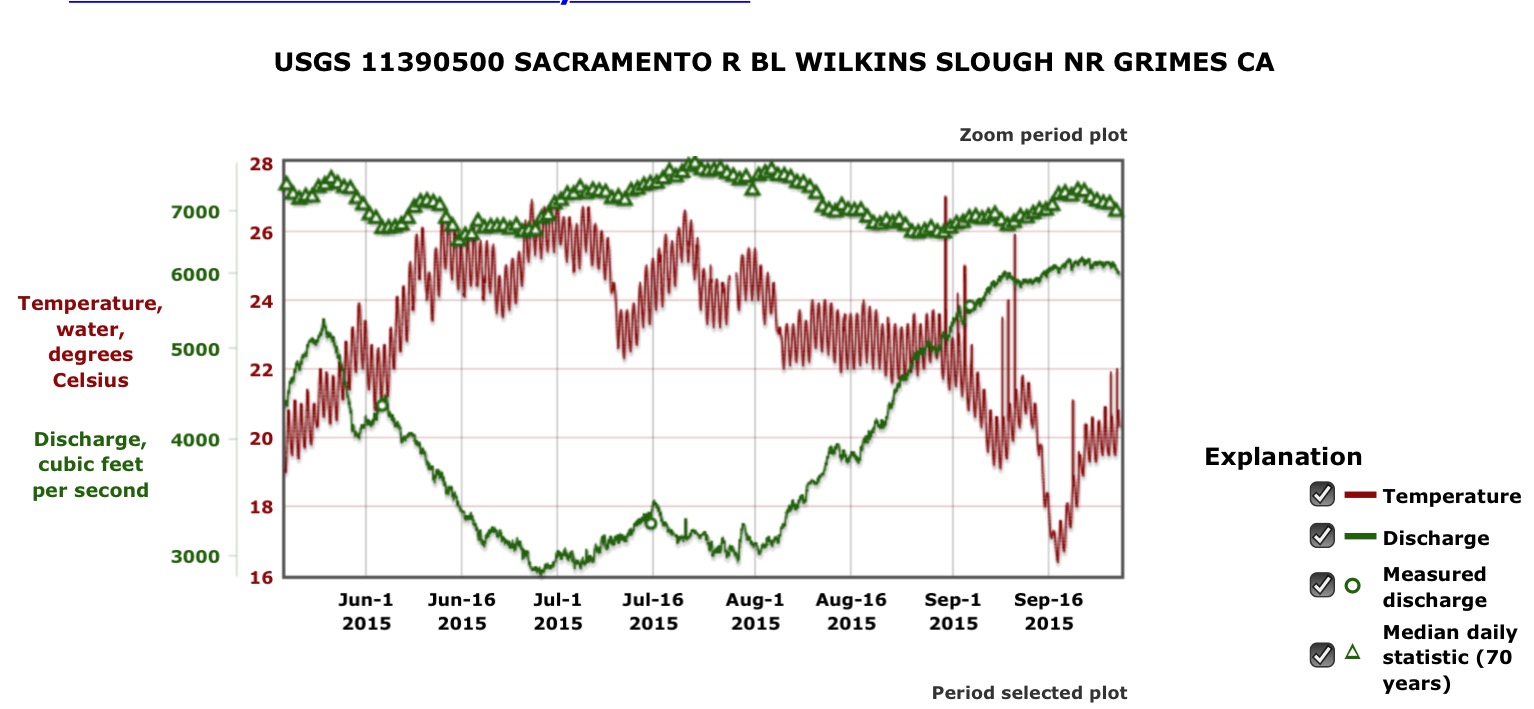
Chart 4. Water temperature and river flow at Wilkins Slough at RM 125 on the Sacramento River May-September 2015. Historical average flow shown by green triangles.

Chart 5. All 150 days from May through September were higher than the 56°F Basin Plan objective for Red Bluff.