On July 1, 2021, staff from the State Water Resources Control Board (State Board) held a public Zoom meeting to provide information and solicit input on potential actions that could be implemented to address low flows in the Scott River and Shasta River watersheds (Figure 1) during the ongoing drought. The Scott and Shasta rivers are major salmon and steelhead producing tributaries of the Klamath River.
Low flows in the Scott and Shasta have led to the recurring mortality of salmon and steelhead due to high water temperatures, stranding, or hindered migration. The recurrence, duration and intensity of mortality events now threatens the extinction of salmon and steelhead in these rivers.
Low flows in both watersheds are caused by surface diversions and groundwater extraction by local agriculture. Although low flows are often attributed to drought and climate change, they have become a regular occurrence even in wetter years. Drought and climate change intensify and increase the frequency of low flow conditions that have become the norm each summer and fall.
The State Board under the governor’s drought emergency declaration could limit water use to help save the fish. This would come at substantial cost to local agriculture and communities. The State Board July 1 workshop sought input and options prior to taking action.
The California Department of Fish and Wildlife is recommending summer minimum flows near 50 cfs to protect over-summering juvenile Chinook and Coho salmon, and steelhead. Such flows represent roughly half of the available water supply in both rivers. Absent action by the State Board, this water would be nearly completely consumed by a carefully distributed water supply extraction system regulated by seniority-based state water rights overseen by the State Board.
In this three-part report, CSPA provides a general strategy plus watershed-specific recommendations to help address the issues and save the fish. In this introduction, we address the general problems and solution strategies. We will follow up with by two watershed-specific parts, one on the Scott and one on the Shasta.
General Problem
The low-flow problem in the Scott and Shasta watersheds occurs in most years. In exceptional high flow, high snowmelt years, ranchers and fish for the most part get the water they need. So in most years, nearly all the water goes to agriculture ,and the lower rivers and their tributaries go virtually dry. Fish survive in the upper river and tributaries, and in middle portions of the mainstem rivers that convey water to the more downstream users. Overall, large portions of the flow go underground into near-surface aquifers, only to resurface and be further diverted or extracted by wells.
There are many areas in both watersheds that provide refuges for over-summering salmon and steelhead. The extent of these refuges decreases over the summer as the surface water supply declines and springs cease flowing. The loss of refuge habitat over the summer is greatest in drought years. As the extent of refuge habitat declines, juvenile salmon and steelhead become more concentrated. Many succumb to “catastrophic stranding,” where they die because refuges dry up or get too hot.
Drying rivers also pose problems for emigrating juvenile and immigrating adult salmon and steelhead in the fall and winter. When fall rains and winter snow are lacking or late, juvenile fish are hindered or blocked from moving downstream to the Klamath River. Adult fish cannot move upstream to spawning grounds in the valleys.
General Solution
The general solution is to focus on maintaining summer refuges and providing fall and early winter flows. Refuges can be maintained on a general or individual basis by protecting natural surface and spring flows or providing supplemental flows where feasible. Each watershed has specific options for sustaining or supplementing streamflows.
Each watershed has about 100 cfs of base streamflow in summer, maintained by permanent springs or higher-elevation snowmelt. Maintaining a 50 cfs flow as recommended by CDFW is a matter of cutting surface diversions and groundwater extractions. To minimize restrictions on water users, flows can be supplemented from various limited surface storage sources or from groundwater aquifers. Both these options can be accomplished to a great extent in the short term.
Since opportunities to save fish this year exist, quick action is necessary. An intensive survey-monitoring program is needed to (1) best allocate available resources, (2) effectively apply necessary restrictions, and (3) evaluate the effectiveness of actions taken.
In the next two parts, we address watershed-specific problems and solutions for the Scott River and Shasta River watersheds.
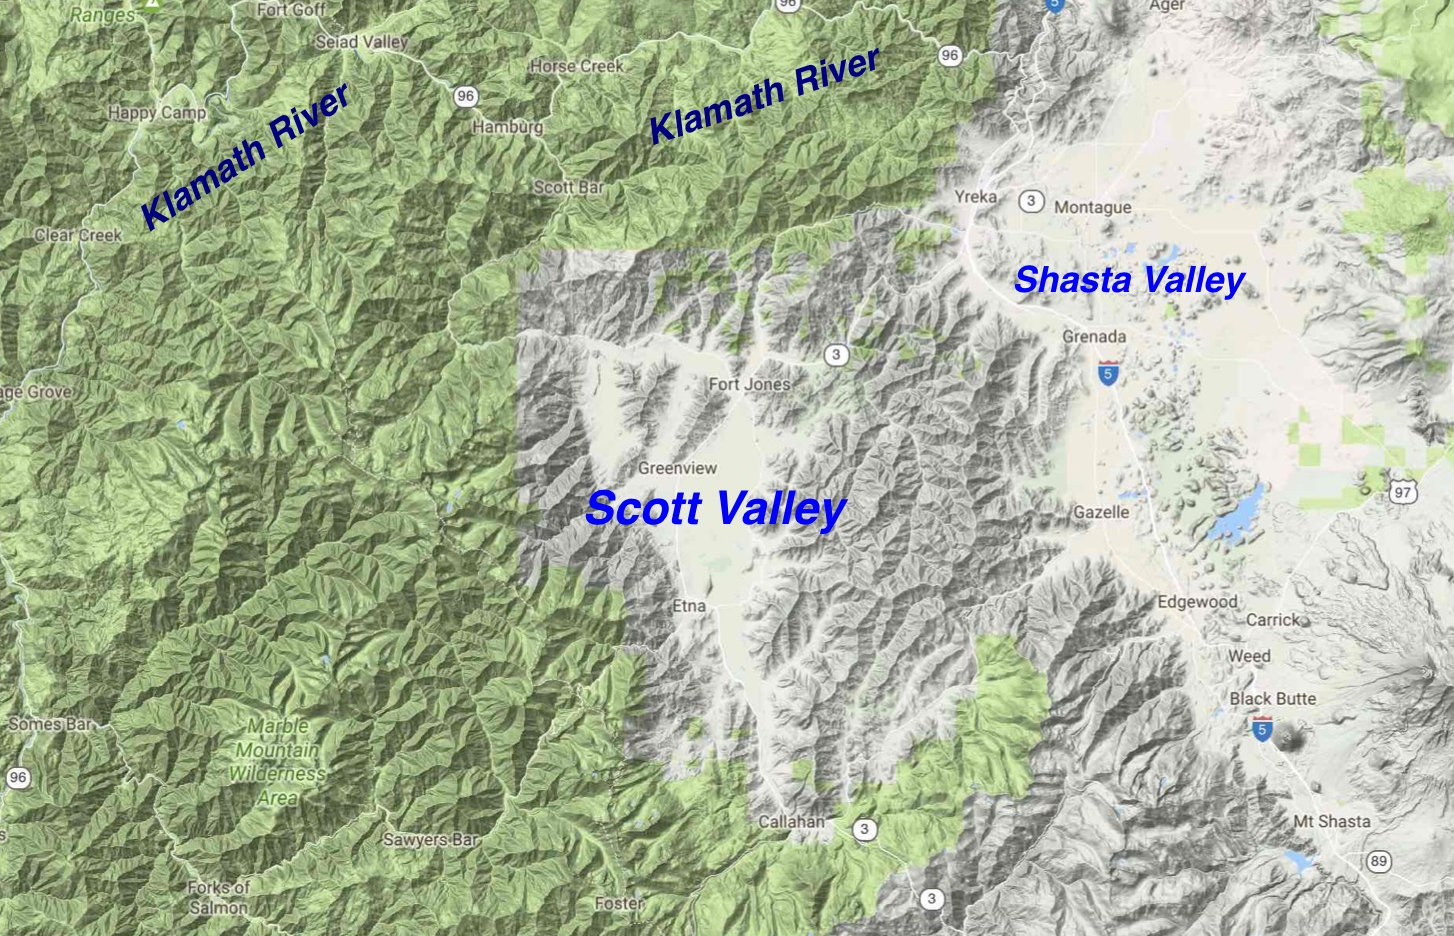
Figure 1. The Scott River and Shasta River valleys in northern California. Yreka, CA is located near the northwest corner of the Shasta River valley. The Scott River valley is west and somewhat south of Yreka. The Scott and Shasta rivers generally flow north into the Klamath River, which generally runs west to the ocean. The Salmon River watershed is immediately west of the Scott River watershed. The upper Trinity River watershed is immediately south of the Scott River watershed.