
Have poor ocean and river conditions during the recent 2012-2015 drought contributed to a collapse of the Sacramento fall-run salmon population as they did during the 2007-2009 drought? Has trucking hatchery smolts to the Bay in the recent drought helped maintain the fall-run population?
I discussed these and related topics for the San Joaquin River fall-run salmon in a post on February 13. In this post, I turn to the Sacramento and its tributaries.
In a March 1 post on its daily blog, the California Department of Fish and Wildlife predicted poor salmon runs this year:
Chinook that will be harvested in ocean fisheries in 2017 hatched two to four years ago, and were deeply affected by poor river conditions driven by California’s recent drought. CDFW and federal fish agency partners have expended millions of dollars on measures to minimize the impacts of the drought. These efforts have included trucking the majority of hatchery salmon smolts to acclimation pens in the lower Delta, improving hatchery infrastructure to keep juvenile fish alive under poor water quality conditions and partnering with sport and commercial fishermen to increase smolt survival. Though all of these efforts helped, other environmental factors – such as unusually warm water conditions in the ocean – were beyond human control.
While CDFW’s statement is true for the most part, and many of the Department’s efforts were commendable, there are additional factors that also were important:
- Water management strategies during the drought that prioritized water supply over salmon greatly affected river conditions, especially in mainstem rivers (Sacramento below Keswick, lower Feather, and lower American). Adult salmon and egg/embryo survival were compromised by warm, low flows below dams.
- Many of the hatchery trucks released their smolts in the Delta near Rio Vista rather than in the Bay. Many smolts were also released near the hatcheries. Both measures led to higher predation on smolts in the warm, low river flows that were characteristic of the drought years.
- There were many factors that were within human control that contributed to poor salmon survival and production. Chief among these was the failure to maintain prescribed flows and water temperatures below dams. Flow and water temperature prescriptions to protect fish were weakened during the 2013-2015 critically dry water years.
There was ample evidence and known circumstances that another population collapse was possible. Such evidence included the limited recovery during the wetter 2010-2012 sequence, and the effects of the 2013-2015 drought had begun to show (Figure 1). Most notable was the sharply lower number of spawners returning in 2015. Brood year 2014 spawners produced very low numbers of young in the winter-spring of 2015.1
A close look at recruitment per spawner in the population over the past 40 years (Figure 2) provides clear evidence that recruitment suffers in dry winter-spring rearing years or dry fall spawning years. These factors overwhelm the background relationship between spawners and recruits three years later. Patterns in Figure 2 indicate:
- Recruitment is significantly depressed in drier years compared to wetter years. The major contributing factor is likely poor survival of juveniles in winter-spring of their first year.
- Recruitment is severely depressed for brood years rearing in critical years and returning as adults two years later in critical years (e.g.,1988-1990, 2007, 2013).
- Recruitment can be depressed for brood years with good winter-spring juvenile rearing conditions but poor conditions before adults return (e.g., 2005, 2006).
- Recruitment can be enhanced for brood years with poor winter-spring young rearing conditions but very good fall conditions for returning adults (e.g., 1994).
- There may be an underlying positive spawner/recruit relationship, but it is overwhelmed by the effect on recruitment of flow-related habitat conditions.
- Poor ocean conditions in 2005-2006 likely contributed to poor recruitment.
- The increase in the relative contribution of hatchery fish is a concern2 as is the declining contribution of mainstem spawners (see Figure 1). With estimates that up to 90 % of the spawning population are fish of hatchery origin, and very little evident genetic diversity, the population is already nearly totally dependent on hatcheries. California sport and commercial salmon fisheries, which depend for the most part on the fall-run salmon, will remain dependent on fall-run hatcheries well into the future.
Present enhancement efforts will help sustain the population and fisheries. Habitat restoration and improved spawning-rearing-migration conditions (flows, water temperatures, and physical habitat) will help increase natural production. Upgraded infrastructure, improved transport (i.e., trucking and barging), and hatchery fry floodplain rearing could improve hatchery contributions. Improvements in hatchery and natural population genetic diversity would help sustain healthy populations into the future.

Figure 1. Sacramento River fall-run Chinook salmon spawner abundance (escapement) from 1975 to 2015. Source: CDFW GrandTab.
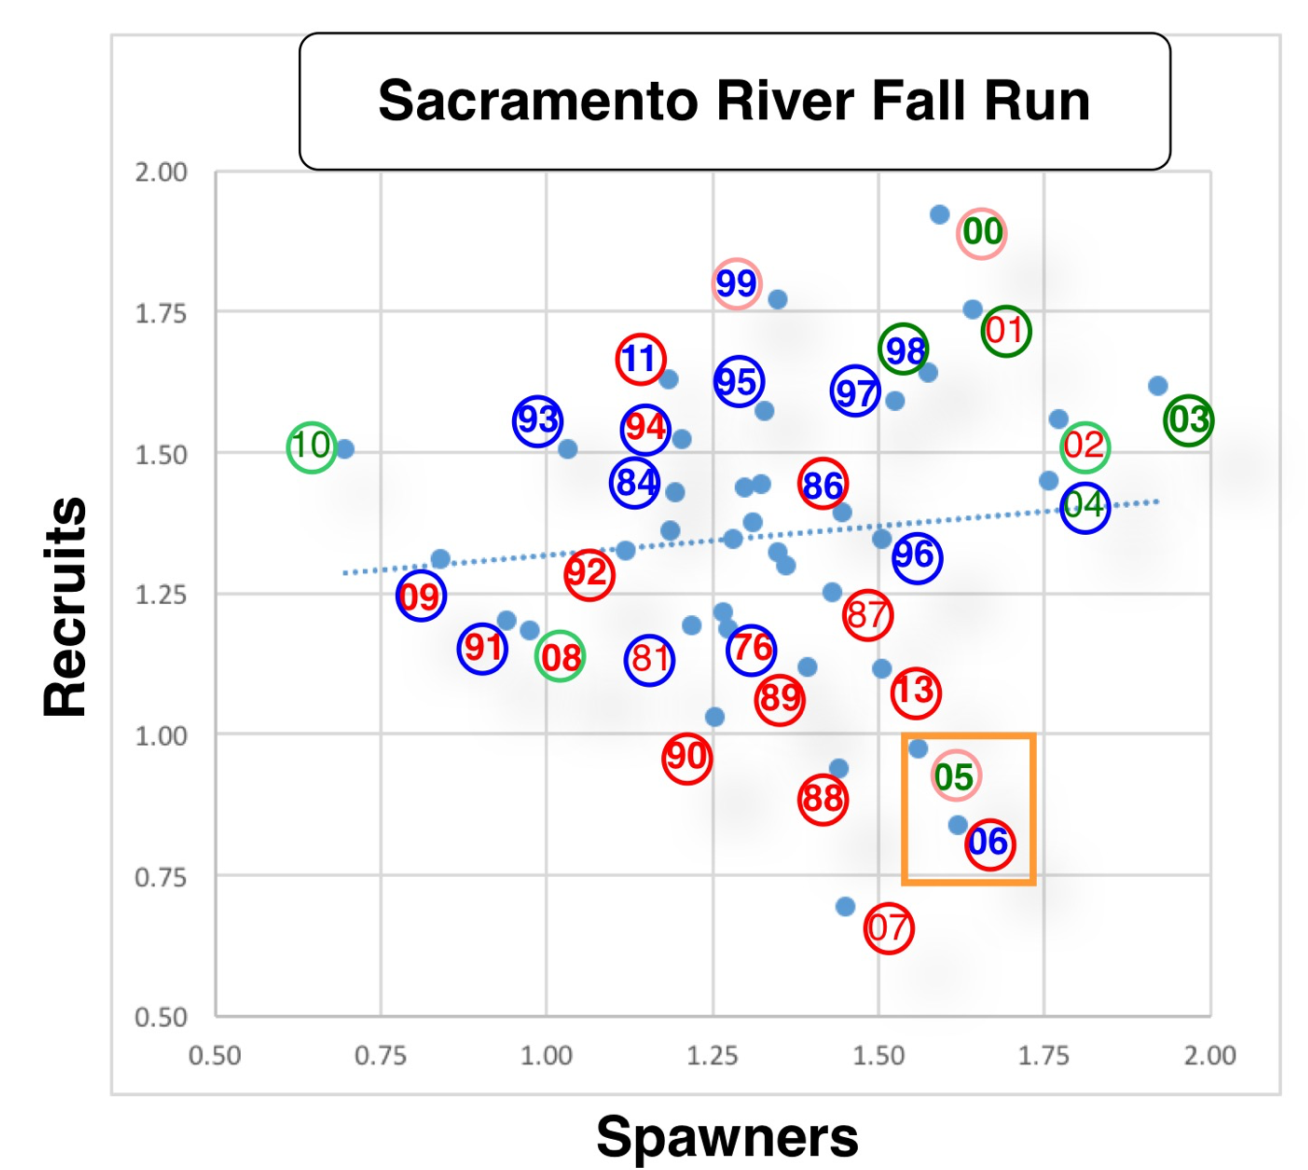
Figure 2. Sacramento River spawners versus recruits three years later from escapement estimates (Log10X – 4 transformed). Note that some variability likely occurs from a low number of 2 and 4 year-old spawners in the escapement estimates. Numbers are sum of hatchery, mainstem, and tributary estimates from CDFW GrandTab database. Number shown is rearing year (winter-spring) following fall spawning year. For example: “88” represents rearing year for 1987 spawning or brood year. These fish returned to spawn (recruits) in 1990. Bold red years are critical water years. Non-bold red years are dry water years. Blue years are wet water years. Bold green years are above-normal water years. Non-bold green years are below-normal water years. Red circles represent adult return years being drier water years. Blue circles represent return years being wet water years Green circles represent return years being normal water years. Orange square denotes rearing years with poor ocean conditions.