Summer spawning and egg incubation water temperatures in the upper Sacramento River below Shasta Dam is a well-known and documented key to the recovery of winter-run salmon Chinook salmon. In a December 2018 post, I noted the importance of early-fall flows to support the emigration of juvenile winter-run salmon from spawning and early rearing areas of the upper Sacramento River near Redding. In this post, I add another measure to the list of essential needs.
- Late-fall flows – Flows to move winter-run juveniles from the upper and lower river into and through the Delta in the late fall.
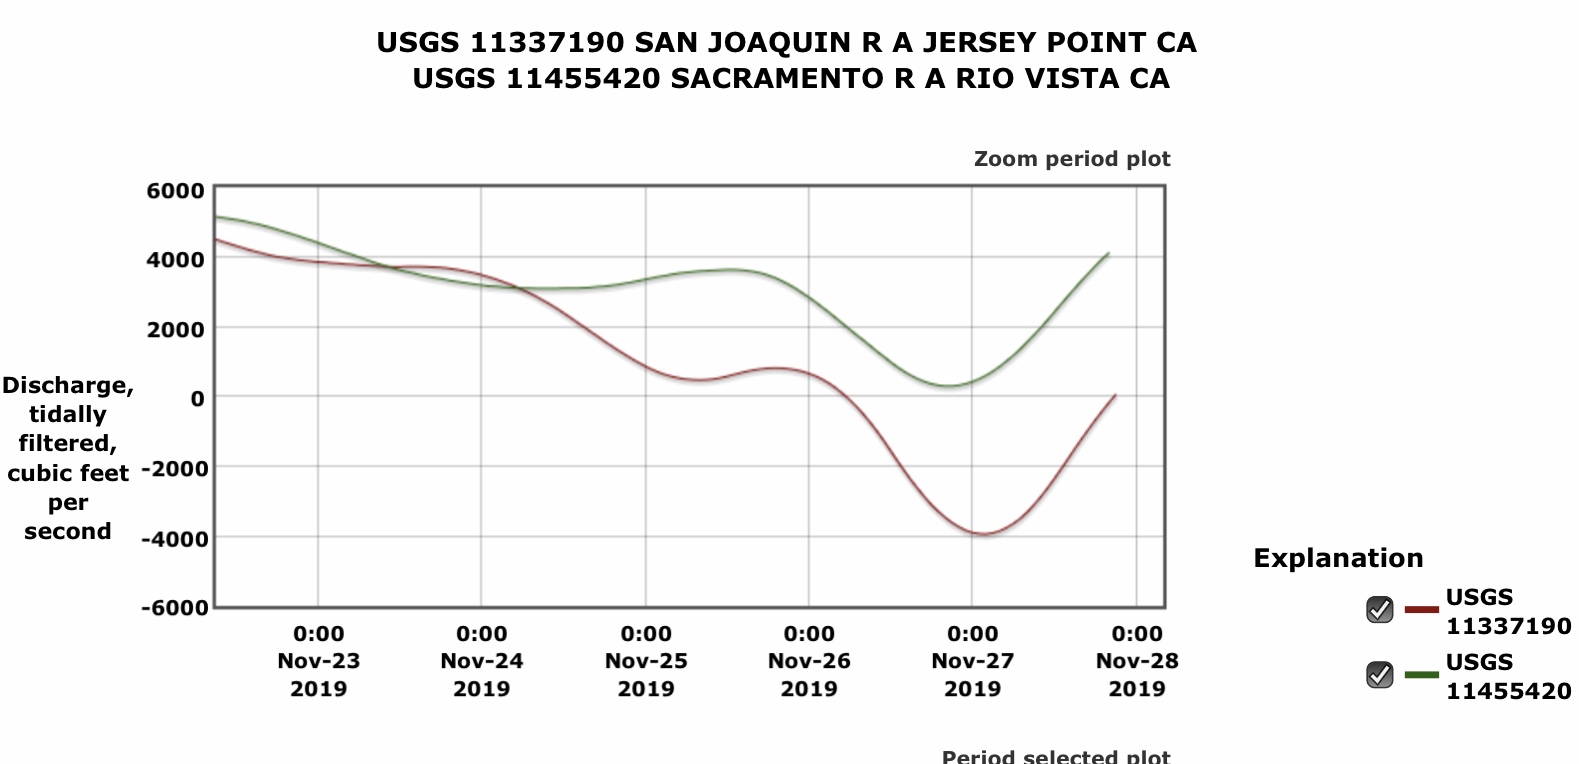
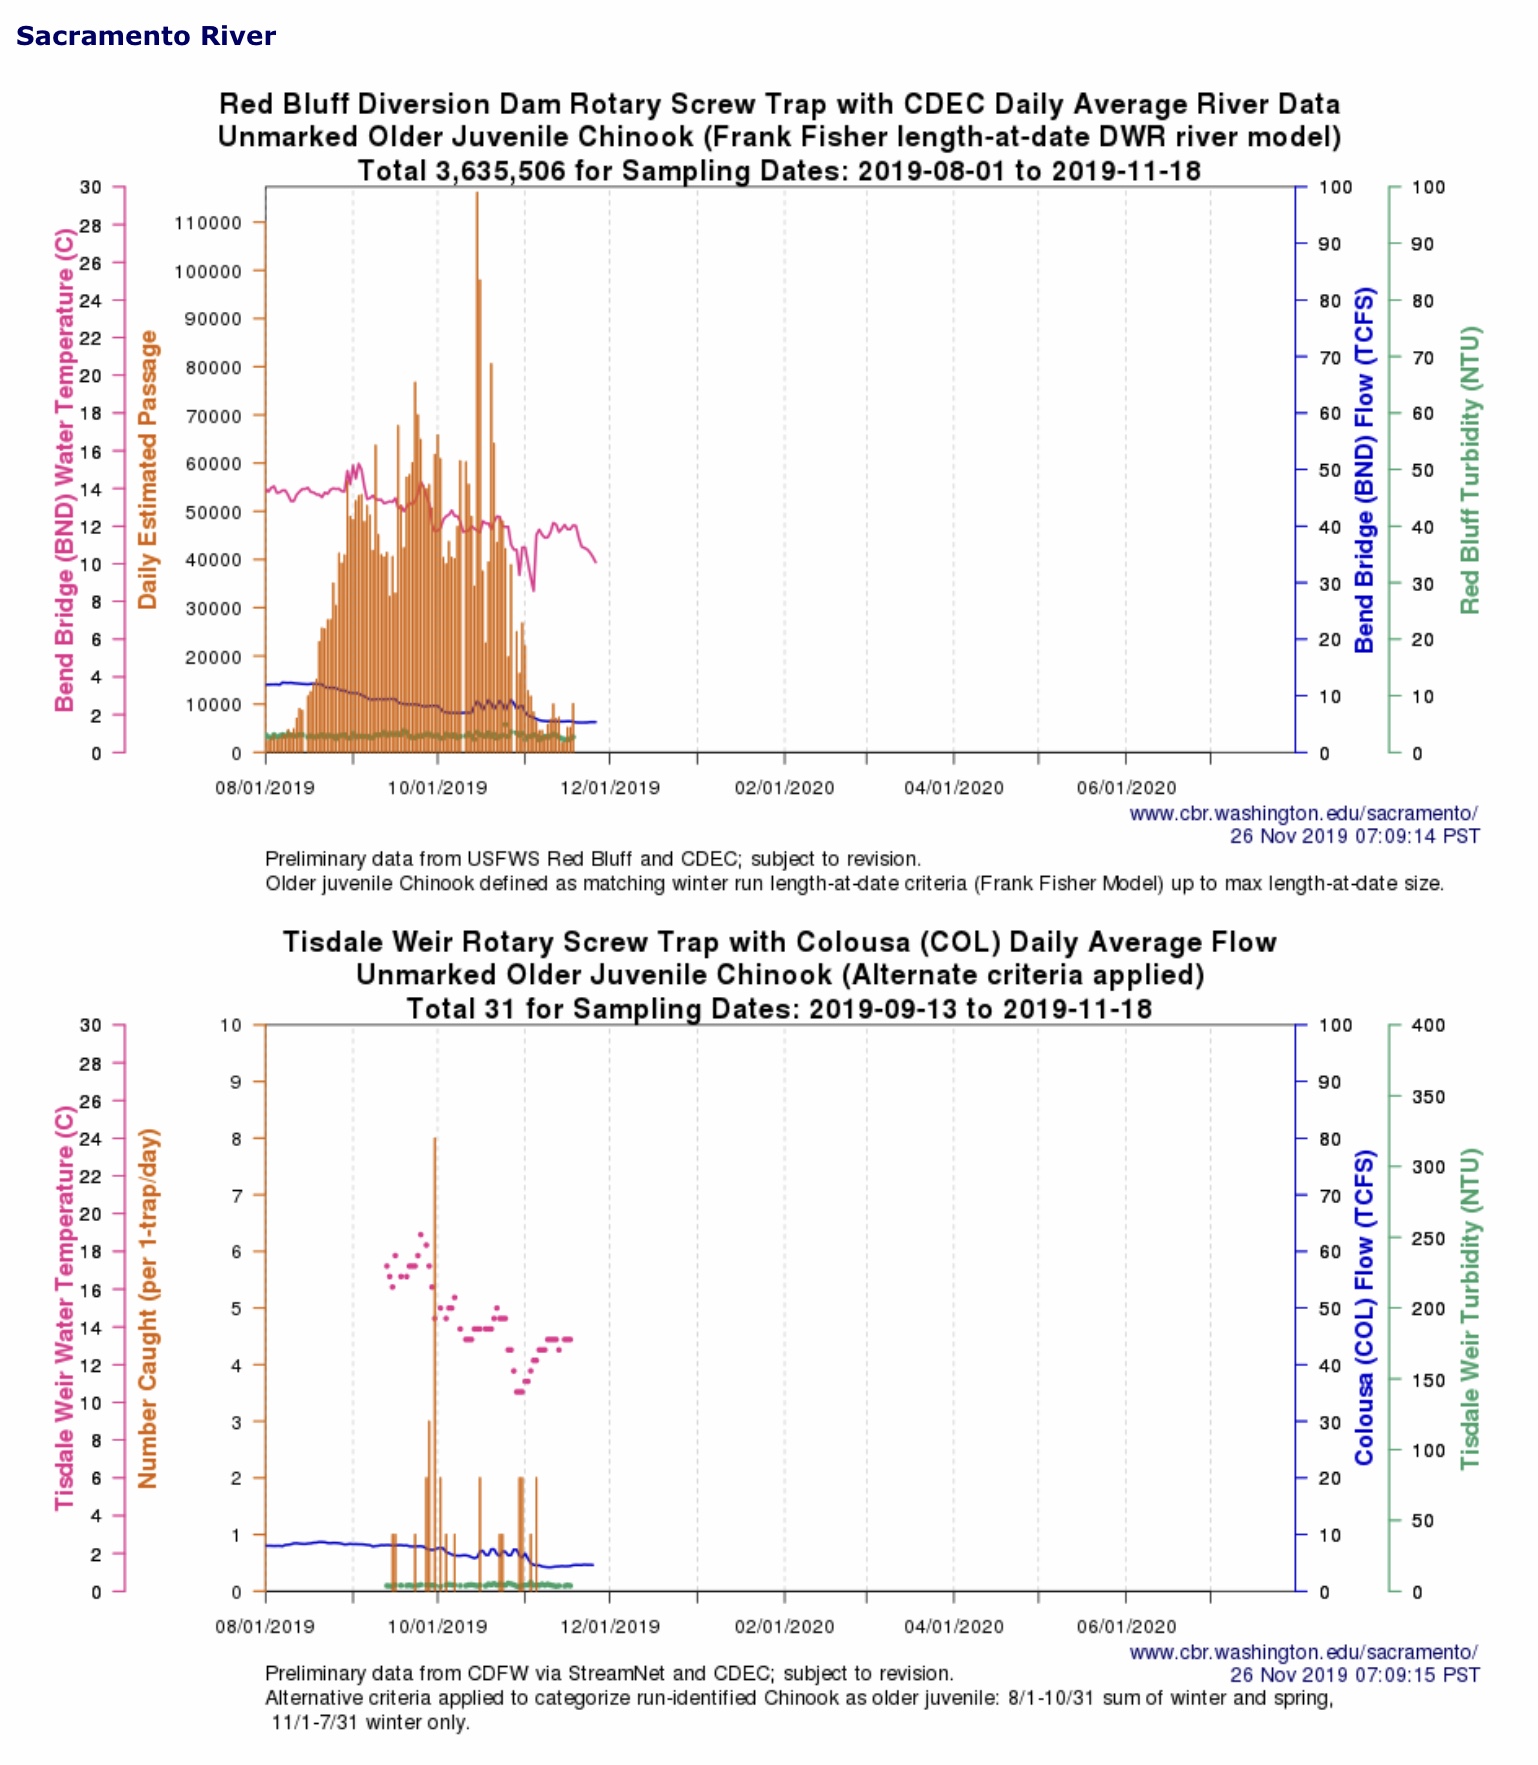
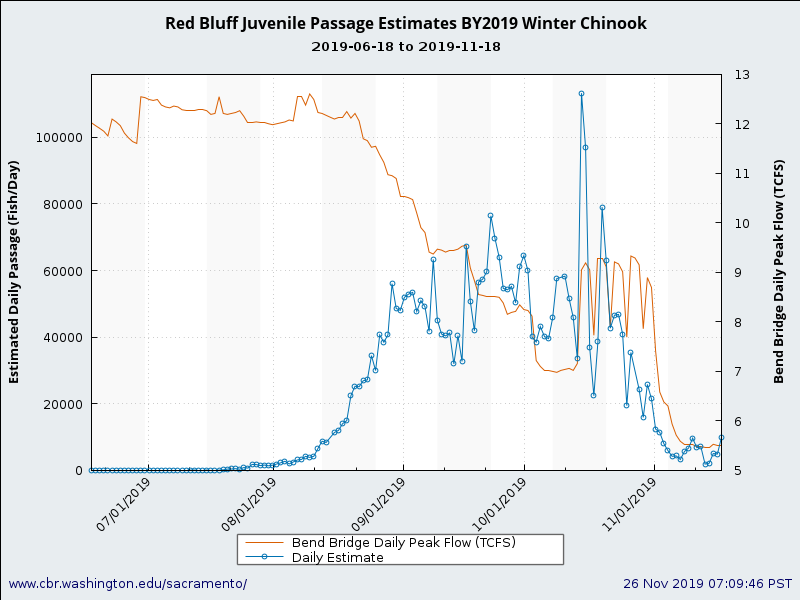
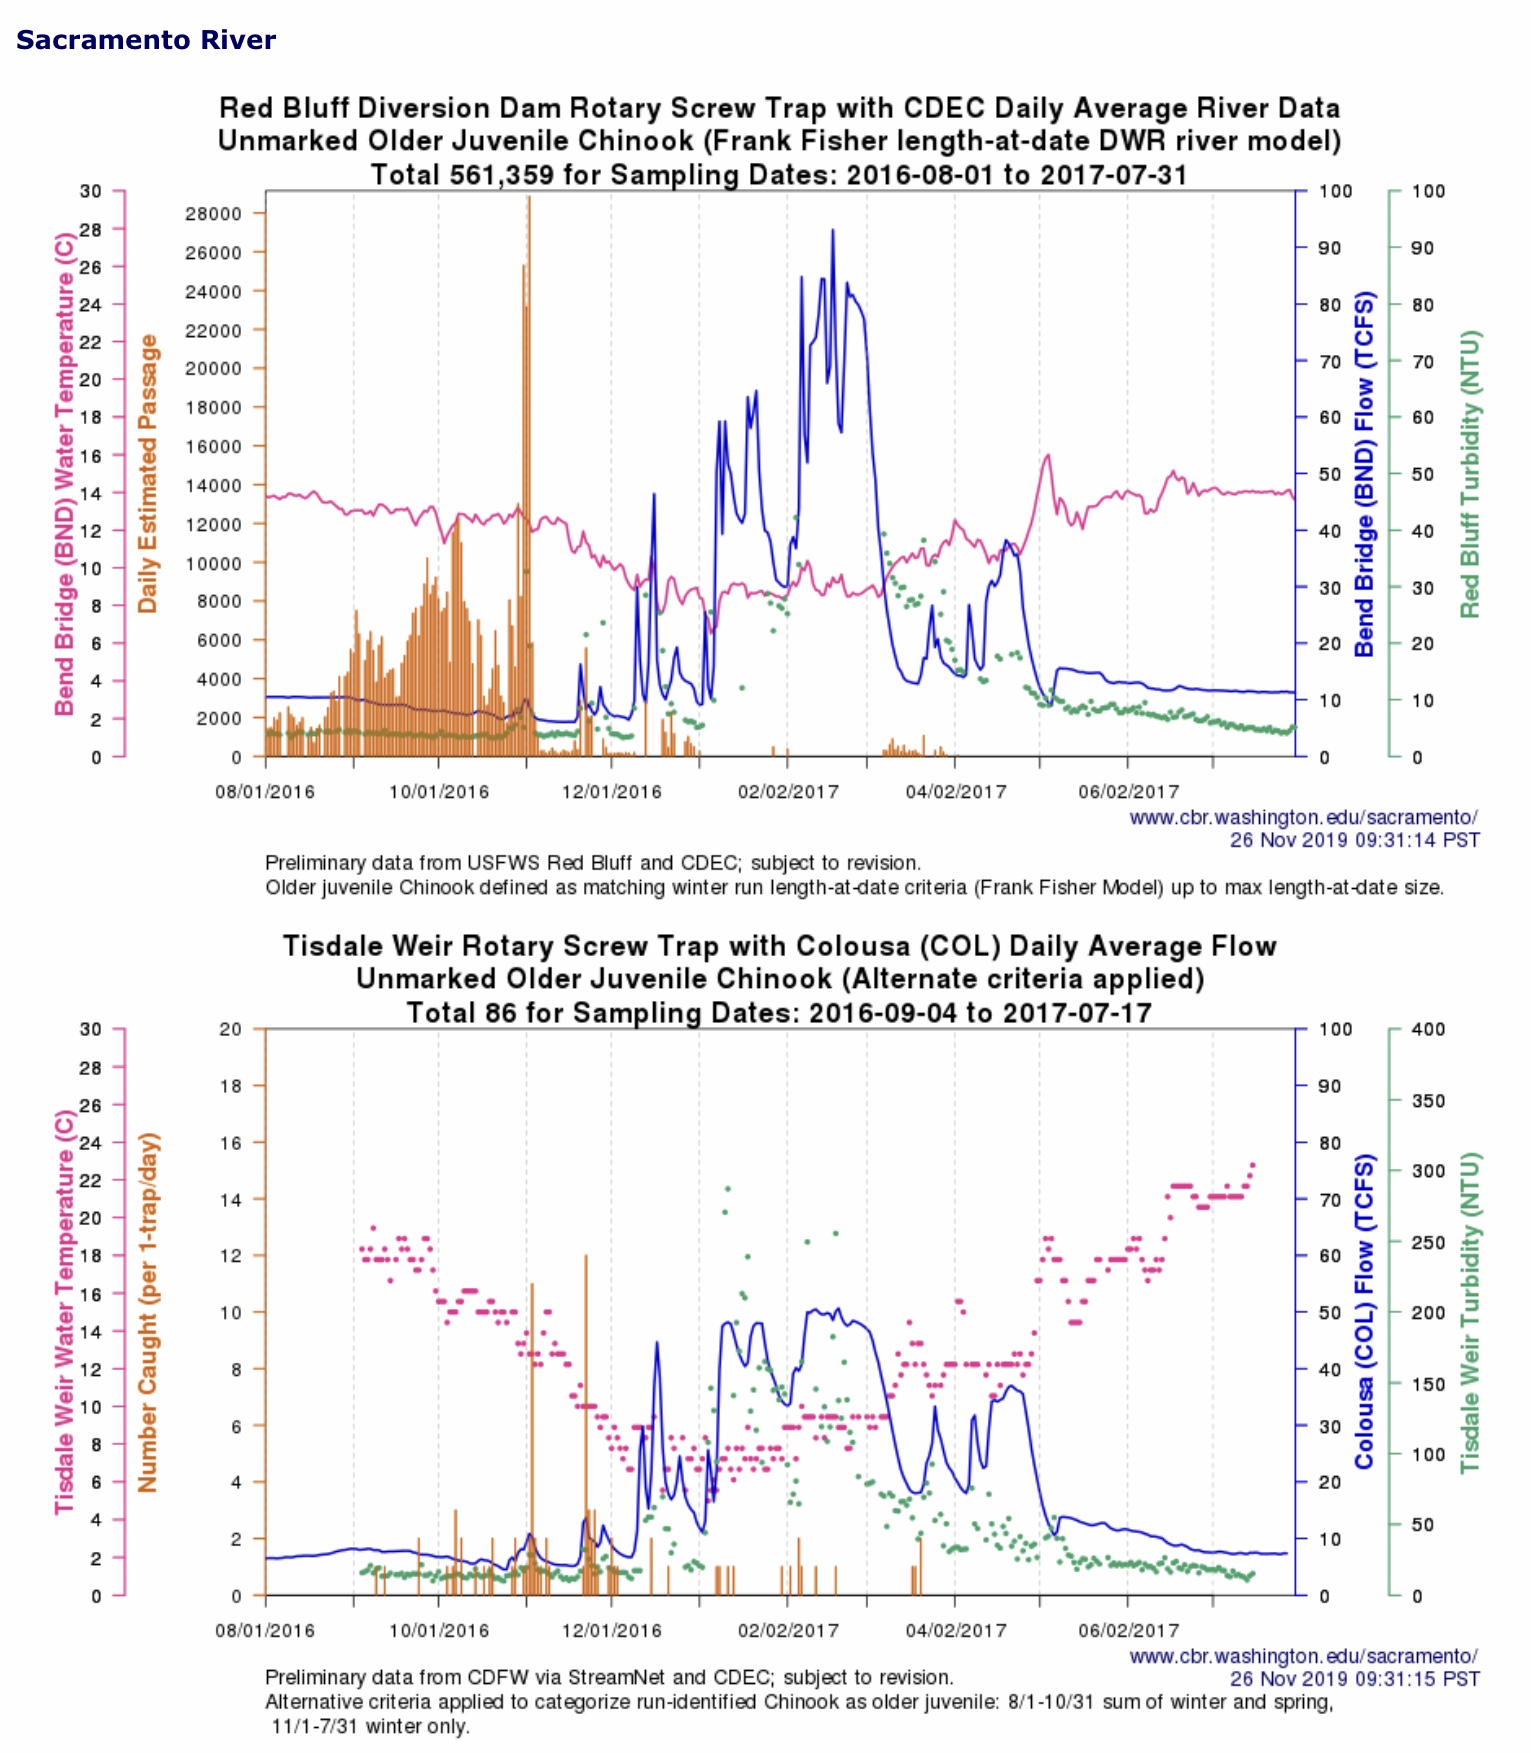
What kind of late-fall flows are specifically needed? The type that occurred in December 2019 from a spate of storms (Figure 1). The 10,000+ cfs flow in the lower Sacramento River got wild winter-run salmon smolts through the lower Sacramento River, as seen from the Knights Landing screw-trap catches. The 20,000+ cfs early-December pulse of Delta outflow got wild winter-run salmon smolts moving through the Bay toward the ocean, as seen in the Chipps Island Suisun Bay trawl catches.
I have previously recommended extending Fall X2 Delta outflow protections1 and reducing Delta exports2 to help the winter-run smolts during their emigration to the ocean. As it was, 10,000+ cfs exports in the latter half of December 2019 took over half of the potential Delta outflow. Figure 1 clearly shows the importance of the late-fall flows to the emigration of winter-run.
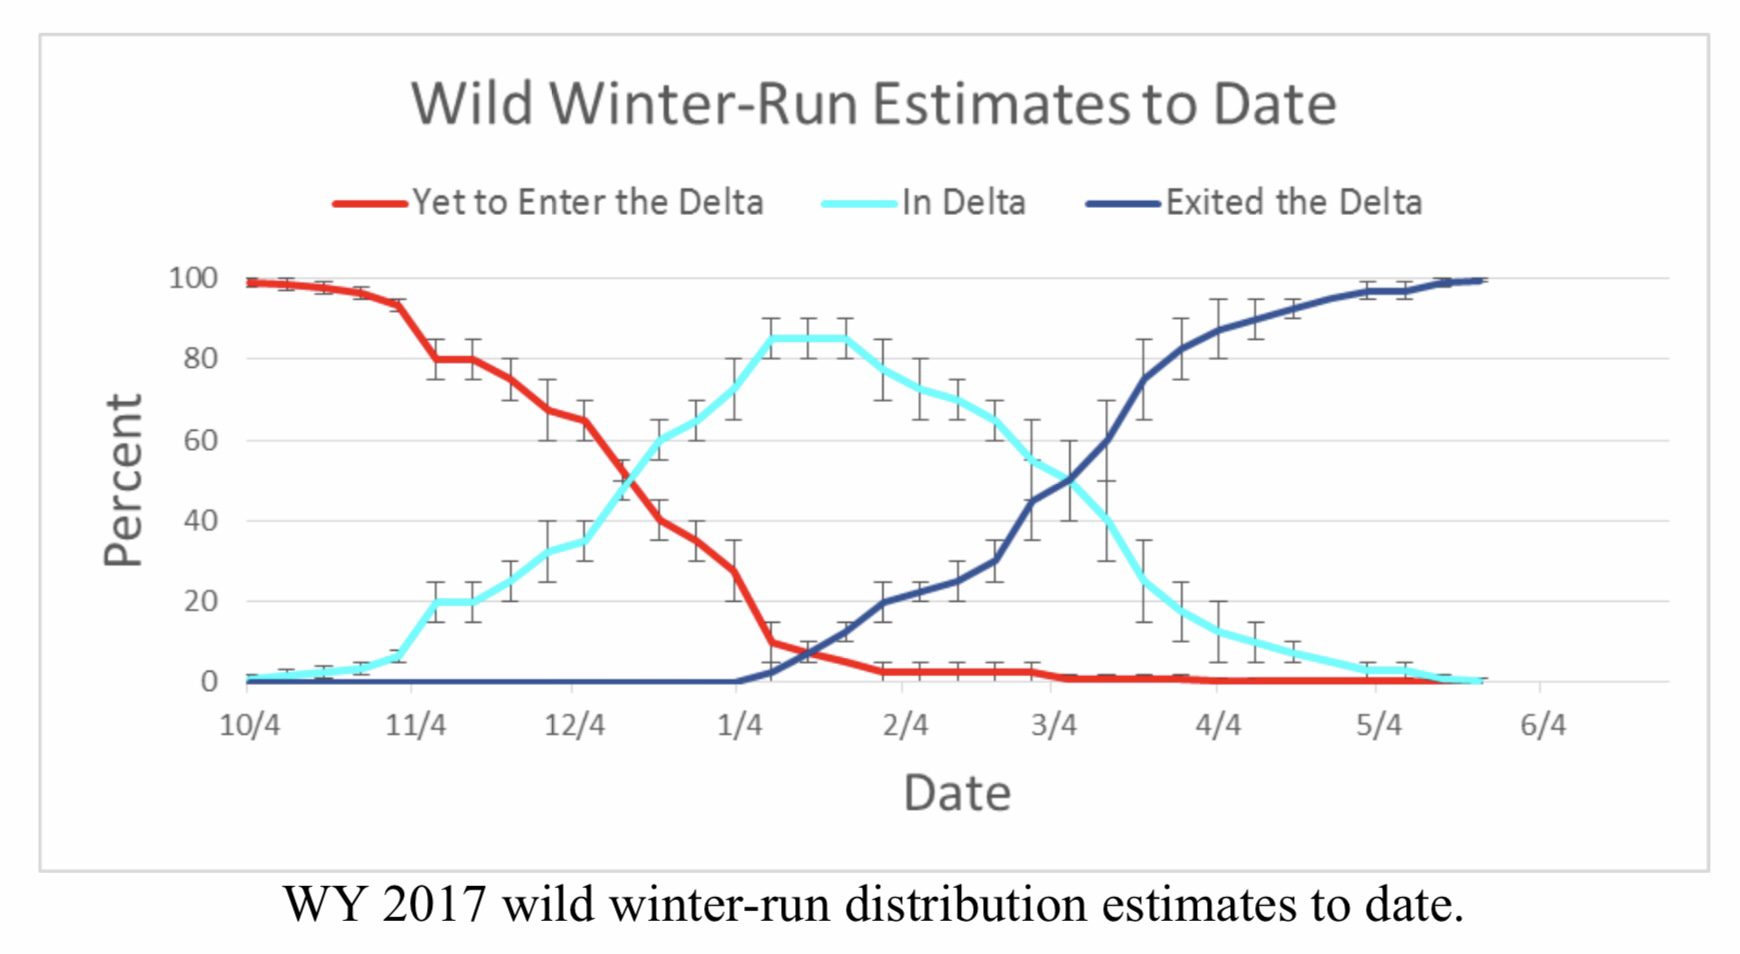
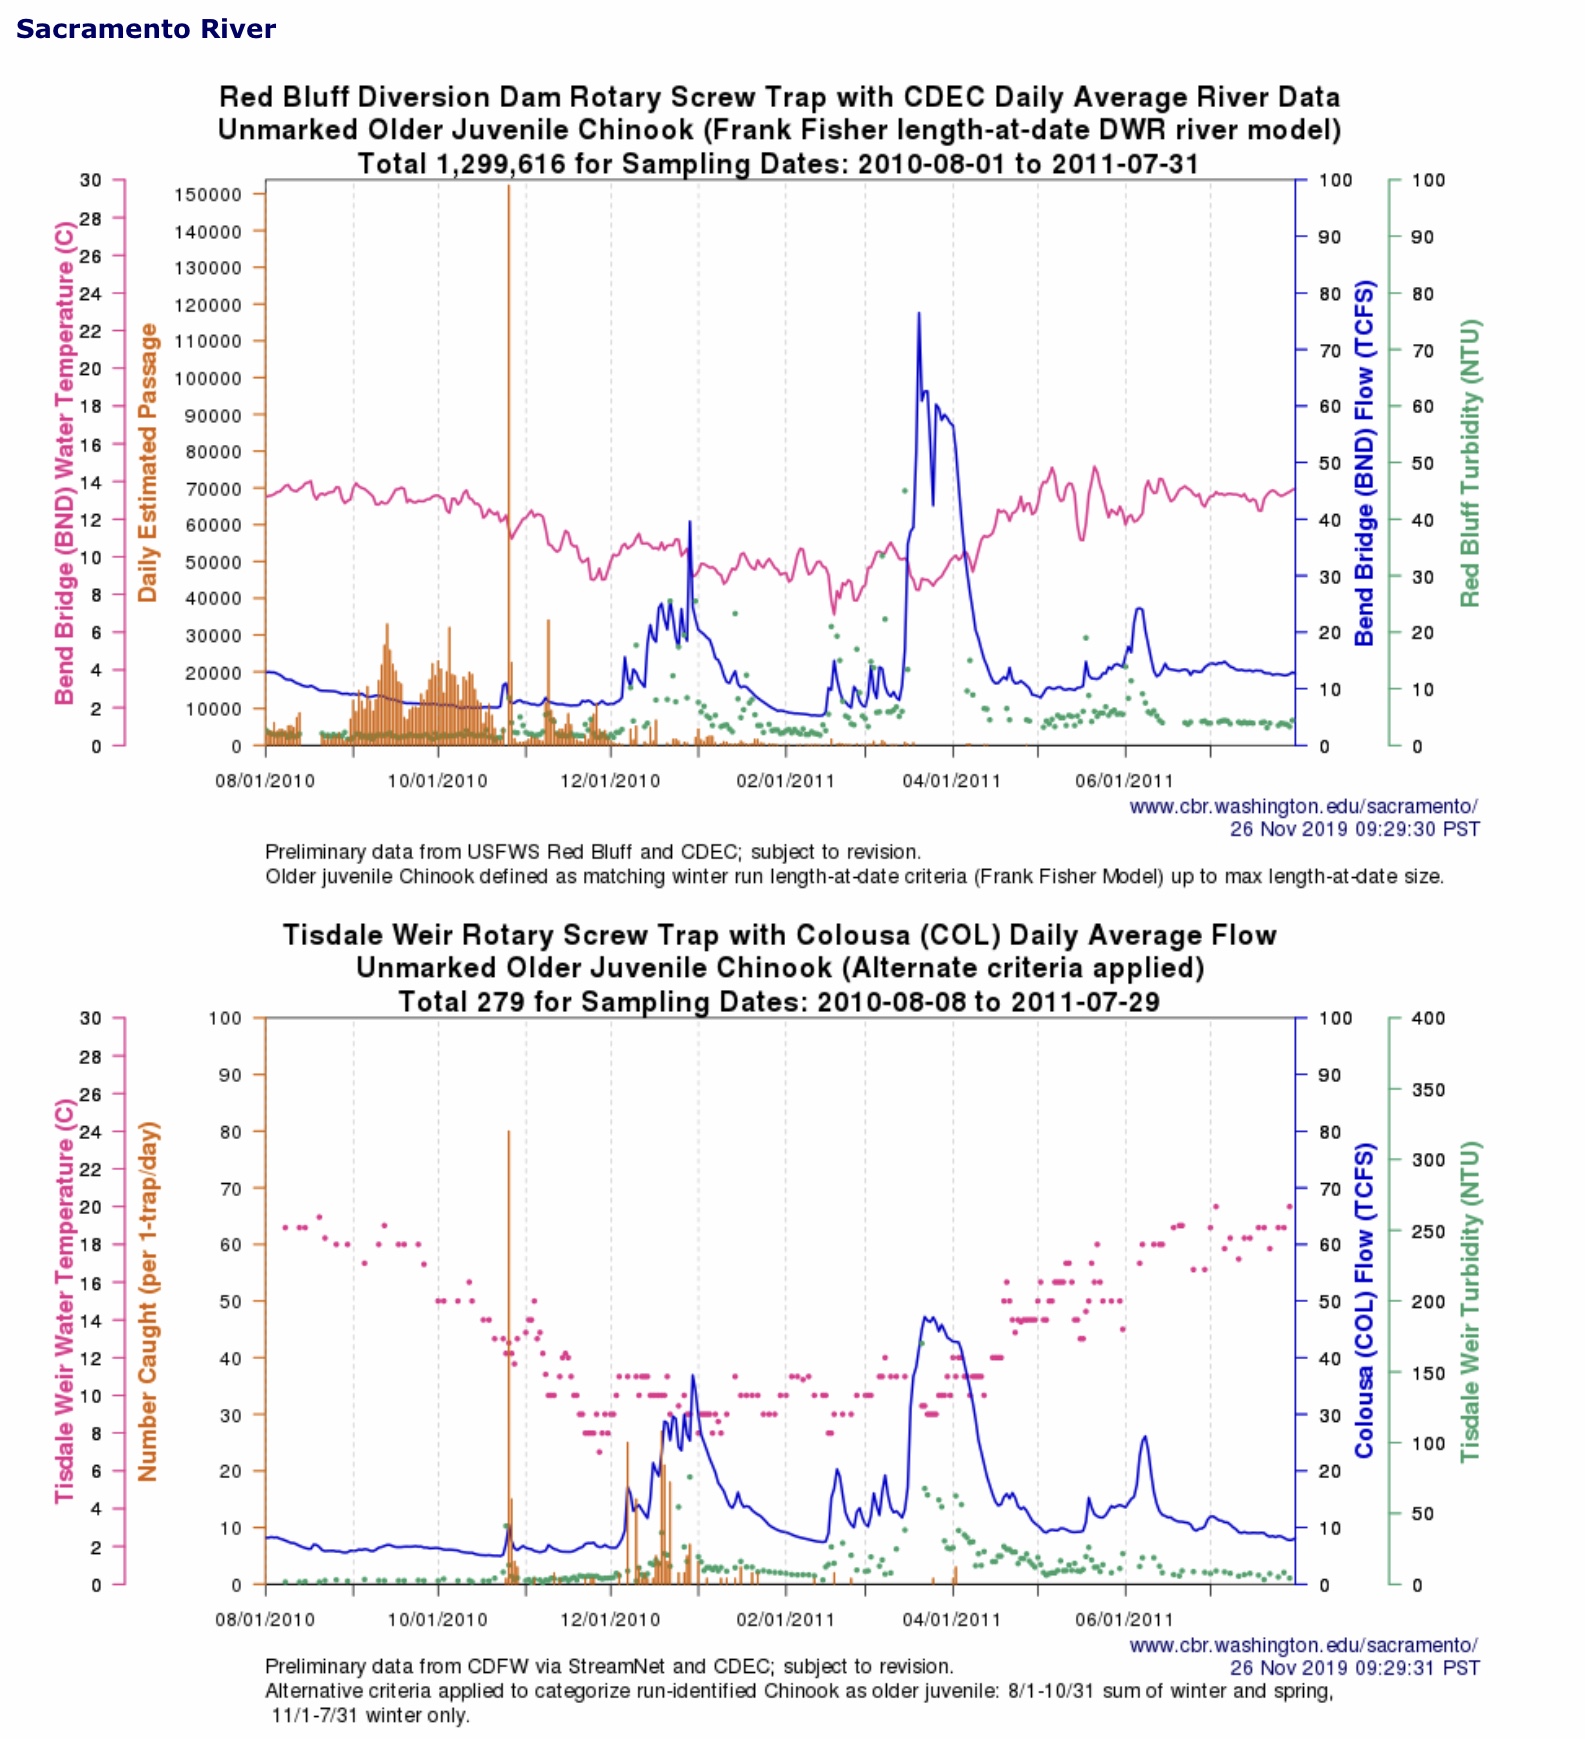
Observed patterns of winter run emigration provide further evidence of the need for flows in the late fall. Figure 2 shows late fall 2017 conditions when there was no late fall flow pulse. The movement of winter-run smolts through the Bay was delayed, occurring in small spurts from late January through March. There is no doubt that one-to-three-month delays in smolt migrations from the river and Delta to the ocean are detrimental to the population and to recovery.
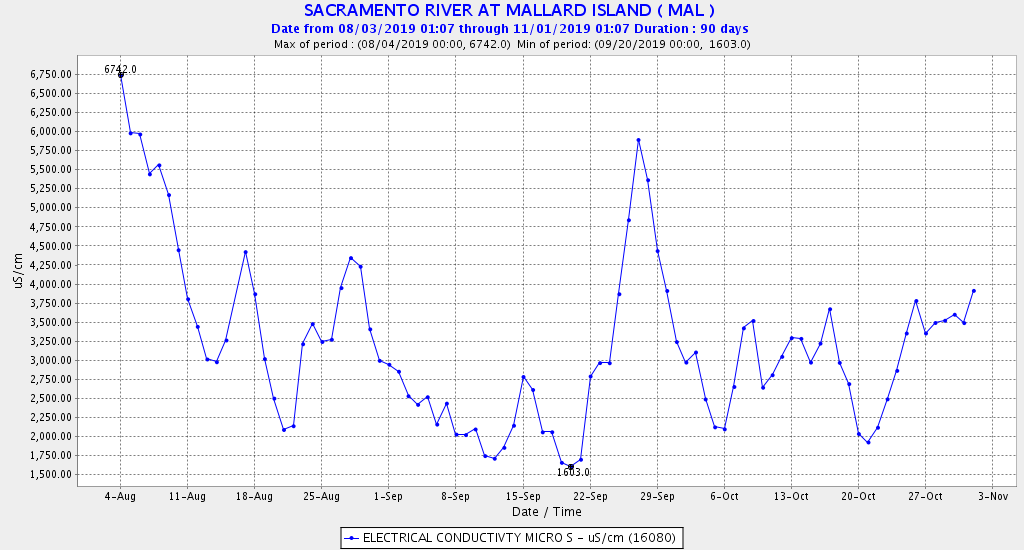
Figure 3 shows the latefall flow pattern over the past decade. Recovery of winter-run salmon depends on protecting the flow pulses. The tendency is to export as much of the first flows of the water supply season as possible and get it stored in south-of-Delta reservoirs. Most of the late-fall rainfall was already captured in upstream reservoirs, so these flow pulses are just a fraction of Central Valley’s natural flows.
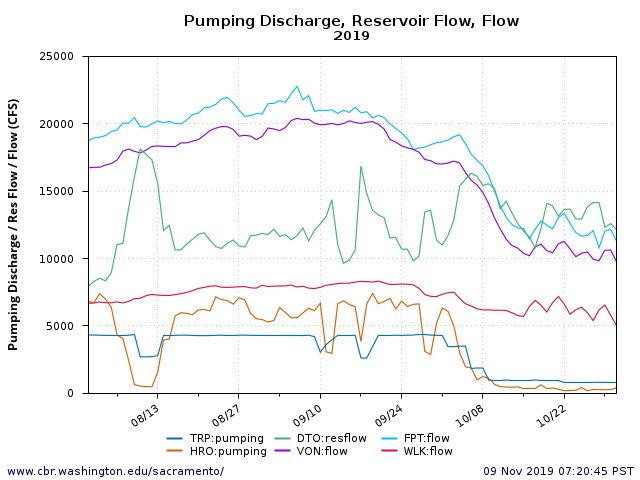
A close look at Figure 3 shows minimal Delta outflow in the late fall of 2011 and 2017. Both years were just coming off wet water years. Shasta Reservoir had above-average storage for December in both years (>3 MAF, two-thirds full). Modest commitments of reservoir water could have greatly benefitted winter-run emigration. Inflows to Shasta reservoir in December of both of those two years were over 200 TAF. An added release of less than half that inflow (100 TAF) could have provided five days of 10,000 cfs pulse flow to the December release pattern in both years. Such a pulse flow, in combination with reduced Delta exports (Figure 4), would have provided five days of 20,000+ cfs Delta outflows in December 2011 and 2017 to support wild winter-run smolt emigration and winter-run recovery.
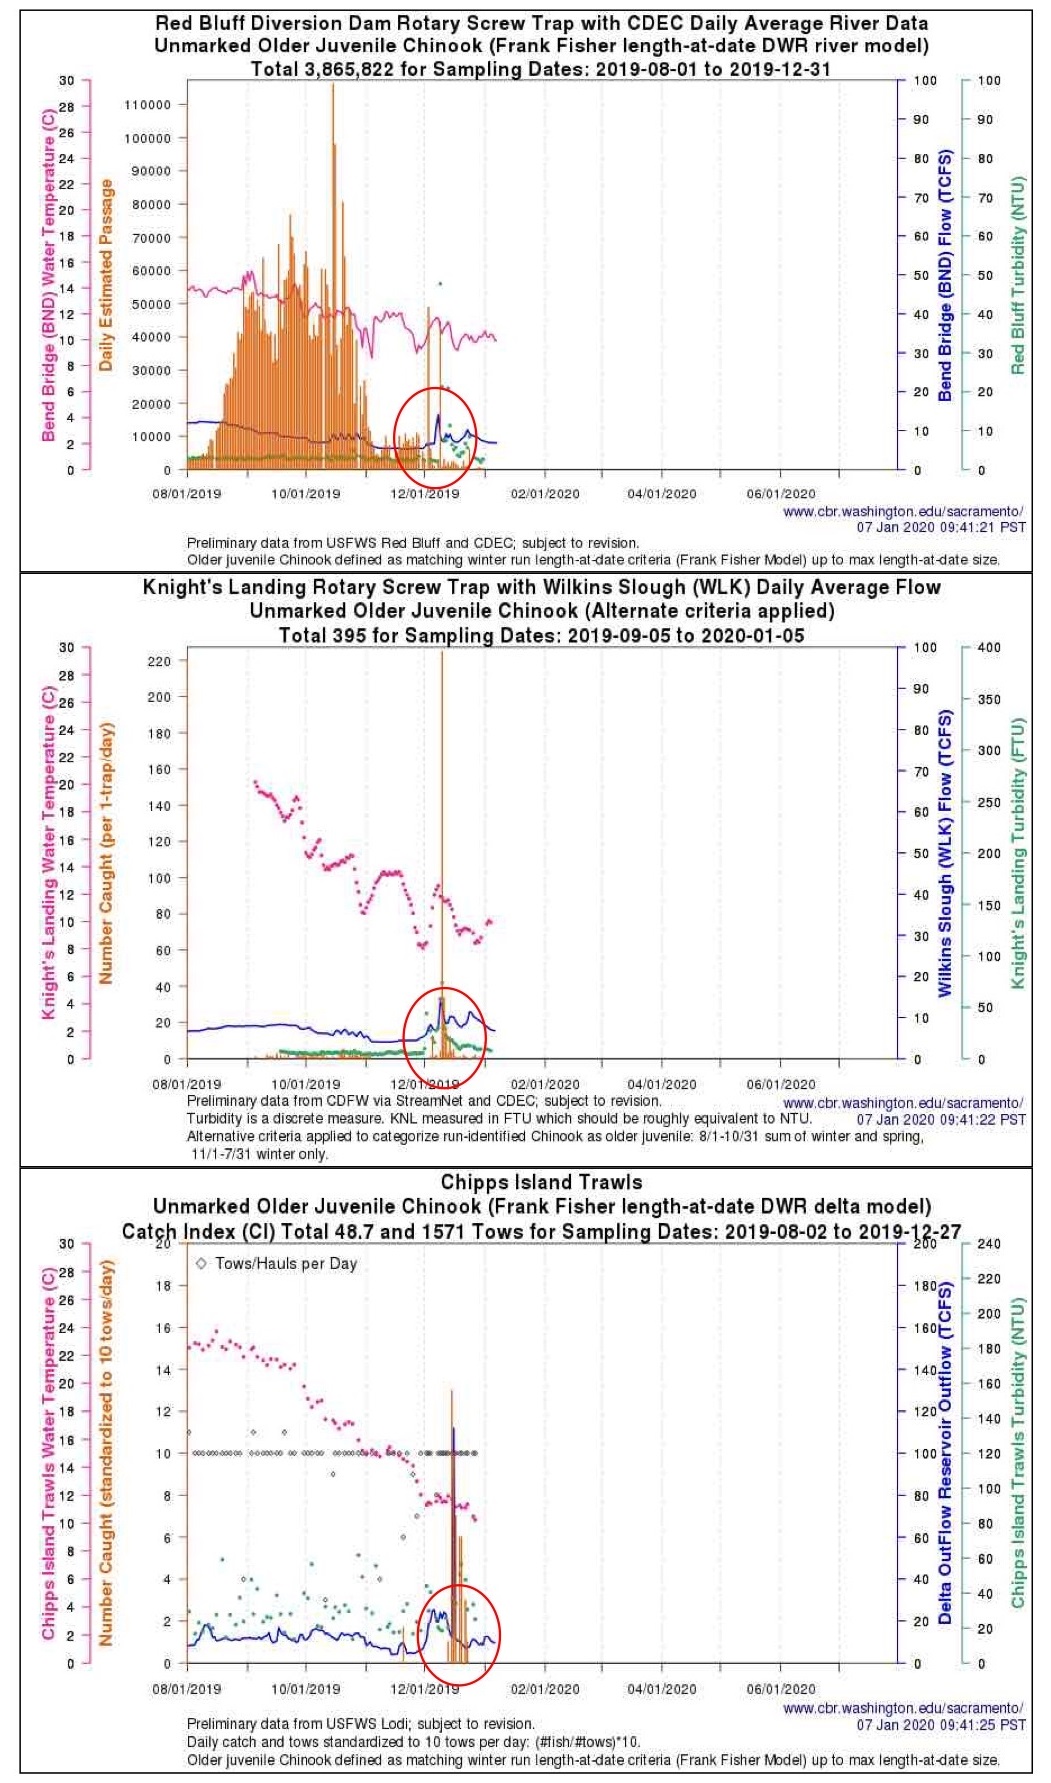
Figure 1. Catch patterns of juvenile wild winter-run salmon in the upper Sacramento River at Red Bluff, the lower Sacramento River at Knights Landing, and at Chipps Island in the upper Bay in fall 2019. Red circles denote catch peaks associated with fall pulsed flows.
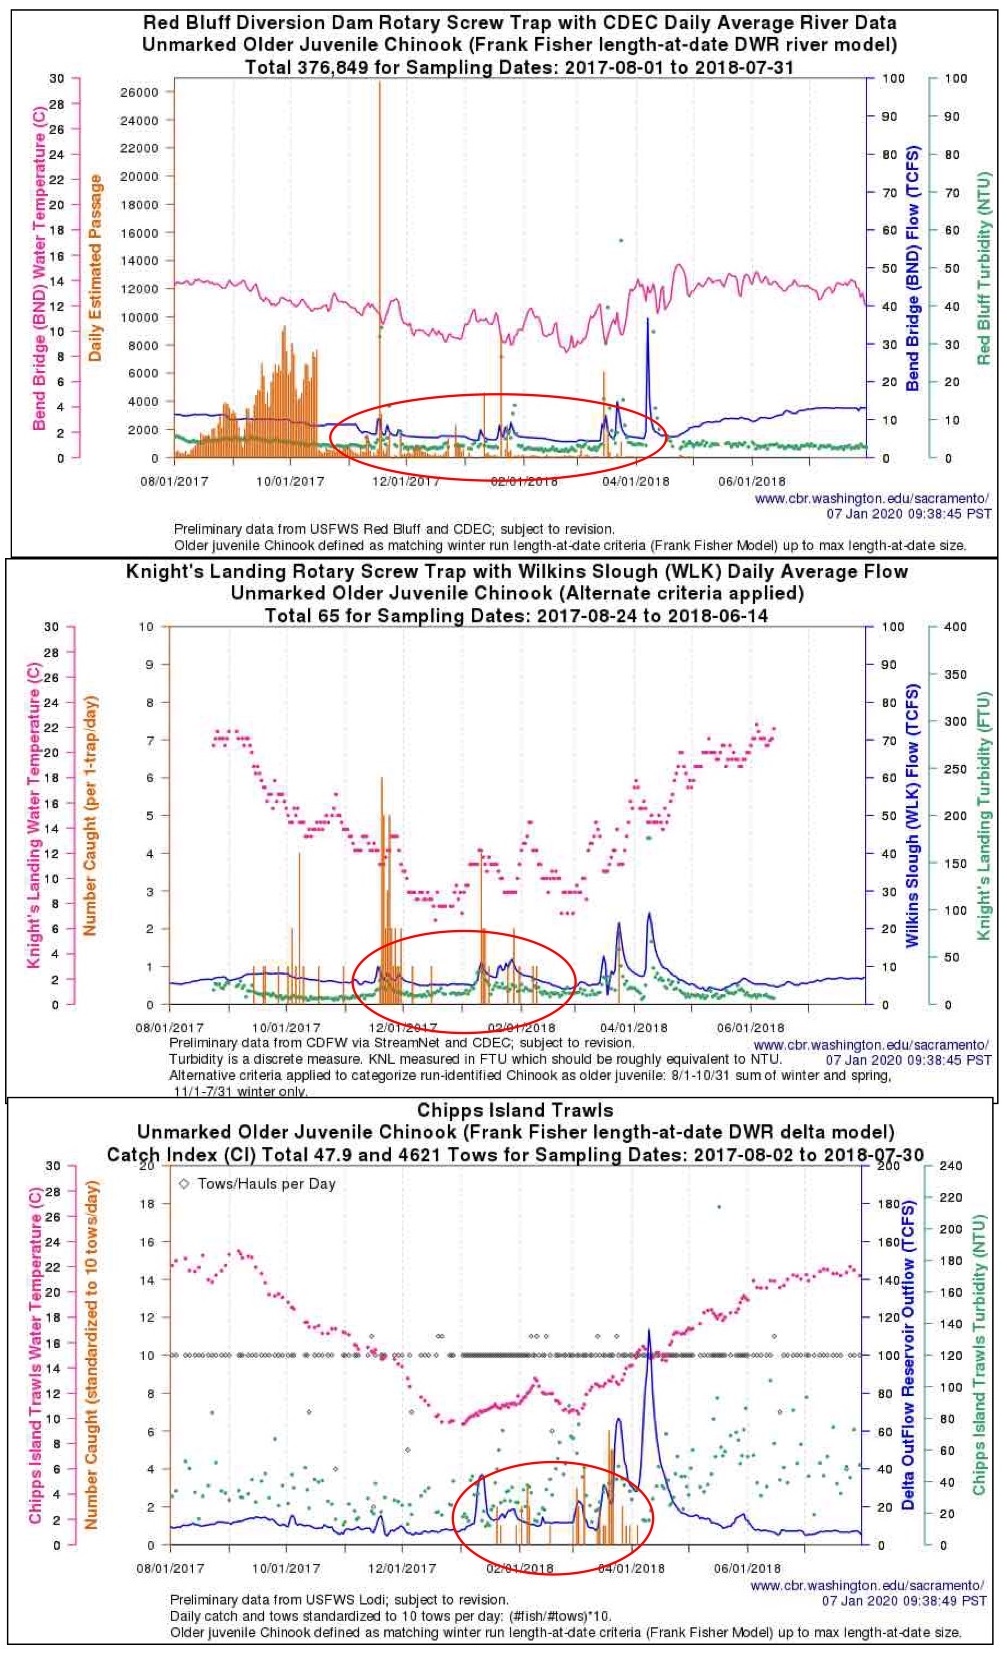
Figure 2. Catch patterns of juvenile wild winter-run salmon in the upper Sacramento River at Red Bluff, the lower Sacramento River at Knights Landing, and at Chipps Island in the upper Bay in fall-winter 2017-18. Red circles show dispersed timing of emigration and lack of large catch peaks in the absence of fall pulsed flows.
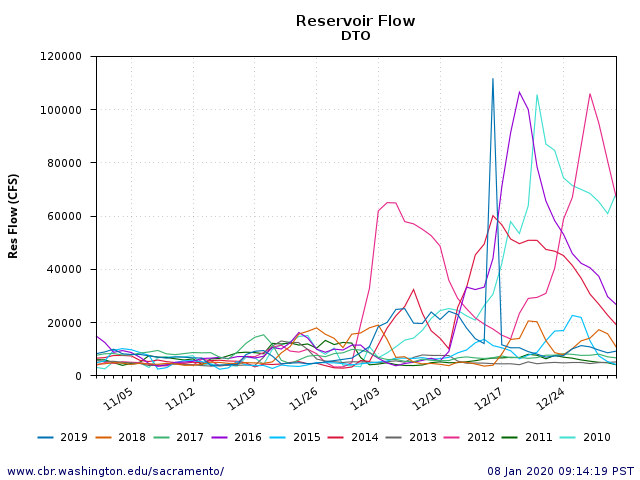
Figure 3. Delta outflow in late fall 2010-2019. Note lowest flows were in 2011, 2013, 2015, and 2017.
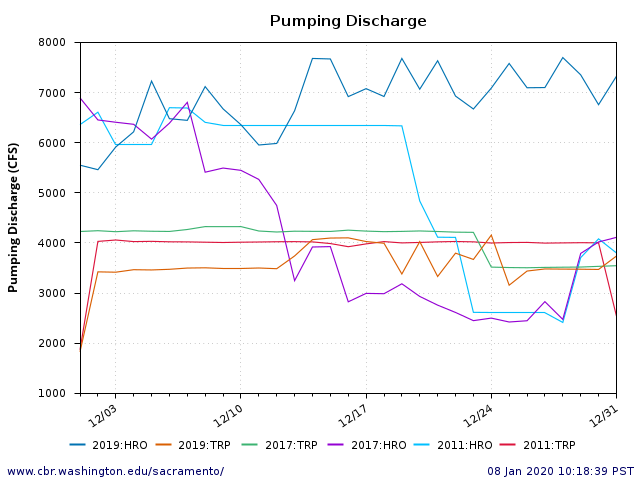
Figure 4. December 2011, 2017, and 2019 south Delta exports at the state Banks (HRO) and federal Tracy (TRP) pumping plants. Capacities are 7500 and 4400 cfs, respectively. Note the extremely high and unusual December 2019 exports.