The 2018 run of spawning adult spring-run Chinook salmon in Butte Creek was not abundant by Butte Creek standards. These were the offspring of the 2015 drought-year run. California Department of Fish and Wildlife (CDFW) estimated only around 2000 spawning adults in 2018, in the lower 25% percentile of the population counts since 1995. The first egg laying in 2018 happened in late September, and the last of the spawners finished their dance around the middle of October. Carcasses were counted, the wildlife of the creek had been feasting for weeks.
The wait began for the eggs in the gravel to “eye up,” a point where the eggs are known to have been successfully fertilized. Several weeks later, depending on water temperature, the alevin juveniles “button up”, or finish feeding off their yolk sack and started feeding on their own as fry. Fry juveniles were captured by CDFW in November, some early in November. This is fairly rapid salmon development for spring-run salmon, but Butte Creek, where the fish spawn, is one of the warmest stream reaches supporting spring-run Chinook.
Early on November 8th of 2018, a black cloud rose rapidly over Butte Creek. The Camp Fire began at 6:30 in the morning. It raced across two ridges and the 3-mile-wide West Branch Feather River canyon, and exploded across Paradise and Magalia and down Little Butte Creek Canyon like a torch. Another section burst off the ridge above Centerville and Helltown. By the next morning, 80% of the canyon downstream of Helltown had burned. Hundreds of homes were leveled. The fire meandered through the canyon for two weeks.
As storms began to approach California, a massive effort to try and control the potentially toxic runoff and pollution was initiated by Friends of Butte Creek and the US Fish and Wildlife Service. They placed many miles of straw erosion control wattles around most all of the burned-out structures. When the heavy rains began, it seemed like there was nothing more that could be done to save the emerging salmon. The creek ran black with ash, soil, and debris. Monitoring on Little Butte Creek, which drains much of Paradise, showed high levels of many toxic chemicals, including arsenic. Although the salmon seemed insignificant in light of the destruction from the fire, biologists were worried that there would little success from this small 2018 run.
Early in March of 2021, an amazing sight began surging through the Butte Creek system. Despite a seriously dry winter and relatively low flow in the creek, salmon started showing up in great numbers. Schools of 10-50 fish were sighted throughout the system. By late March, many thousands of spring-run salmon were making their way into the middle canyon reach below Centerville where cool, deep pools provide the most important refuge for these fish to make it through the summer. In April, at one of the monitoring pools with the easiest access, nearly 800 fish held in one pool.
Downstream, water diversion dams in the valley sections of Butte Creek were in pretty good shape after many years of upgrades to the ladders and screens, allowing salmon to reach the upstream holding pools earlier and in better condition than years past. Late arrivals in the past often showed damage to their skin from concrete dams and ladders, and had low spawning success rates. Fungus often covered the eyes of these late-arriving fish, and many did not make it through the summer.
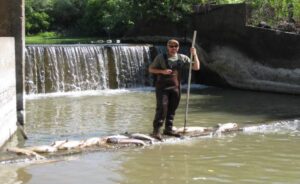
Figure 1. Weir 1, May 2012. CDFW Photo.
In April 2021, a number of early-arriving fish uncharacteristically showed up with serious damage to their heads. Not much later, word began to spread that water had been shut off at one of the weirs in the Sutter Bypass, and many spring-run salmon had perished. Apparently, some salmon that did make it past the dam suffered injuries in the process. Additionally, the low flow in the Sutter Bypass may have led hundreds of Butte Creek salmon to continue on up the Sacramento River to Colusa where Butte Creek originally entered the river at the Butte Slough Outfall gates. The gates were closed, but the fish sensed this was a potential access to Butte Creek and began bashing their heads and bodies on the outfall gates. It took many days for the Department of Water Resources to open the gates for fish, and many damaged salmon surged into the creek. At times in late April and early May, as many as 10% of the fish showed signs of damage.
Most significant was the size of the run that looked to be the biggest run of spring-run Chinook salmon to ever return to Butte Creek, all from the parent spawning population of about 2000 fish.
California Department of Fish and Wildlife biologists began doing snorkel surveys in June and quickly began estimating over 10,000 adult returnees. Local observers, including this author, estimated over 20,000, rivaling the 20,000 estimated returnees of 1998. The sight was spectacular, and optimism was high that something about the Camp Fire may have contributed to the success of the juveniles from that fateful fall in 2018, along with the wet winter in 2019. Successful salmon populations may benefit from nutrient releases, sediment and ash cover for their downstream migration, or for other unknown elements of the cycle. The extra nutrients, and the high flows and water levels in the Butte Basin and Sutter Bypass in winter 2019, were likely beneficial.
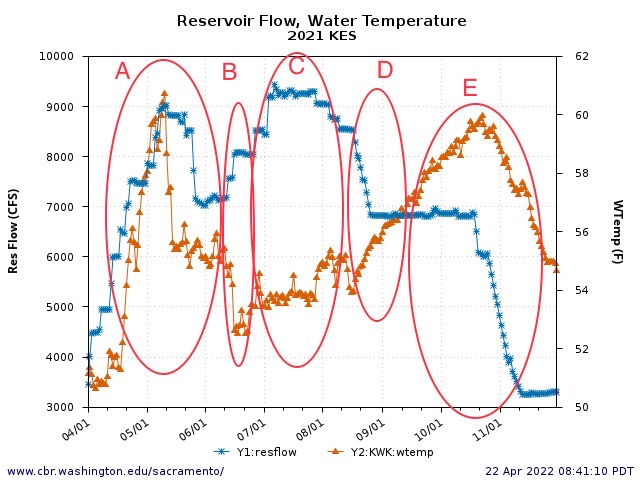
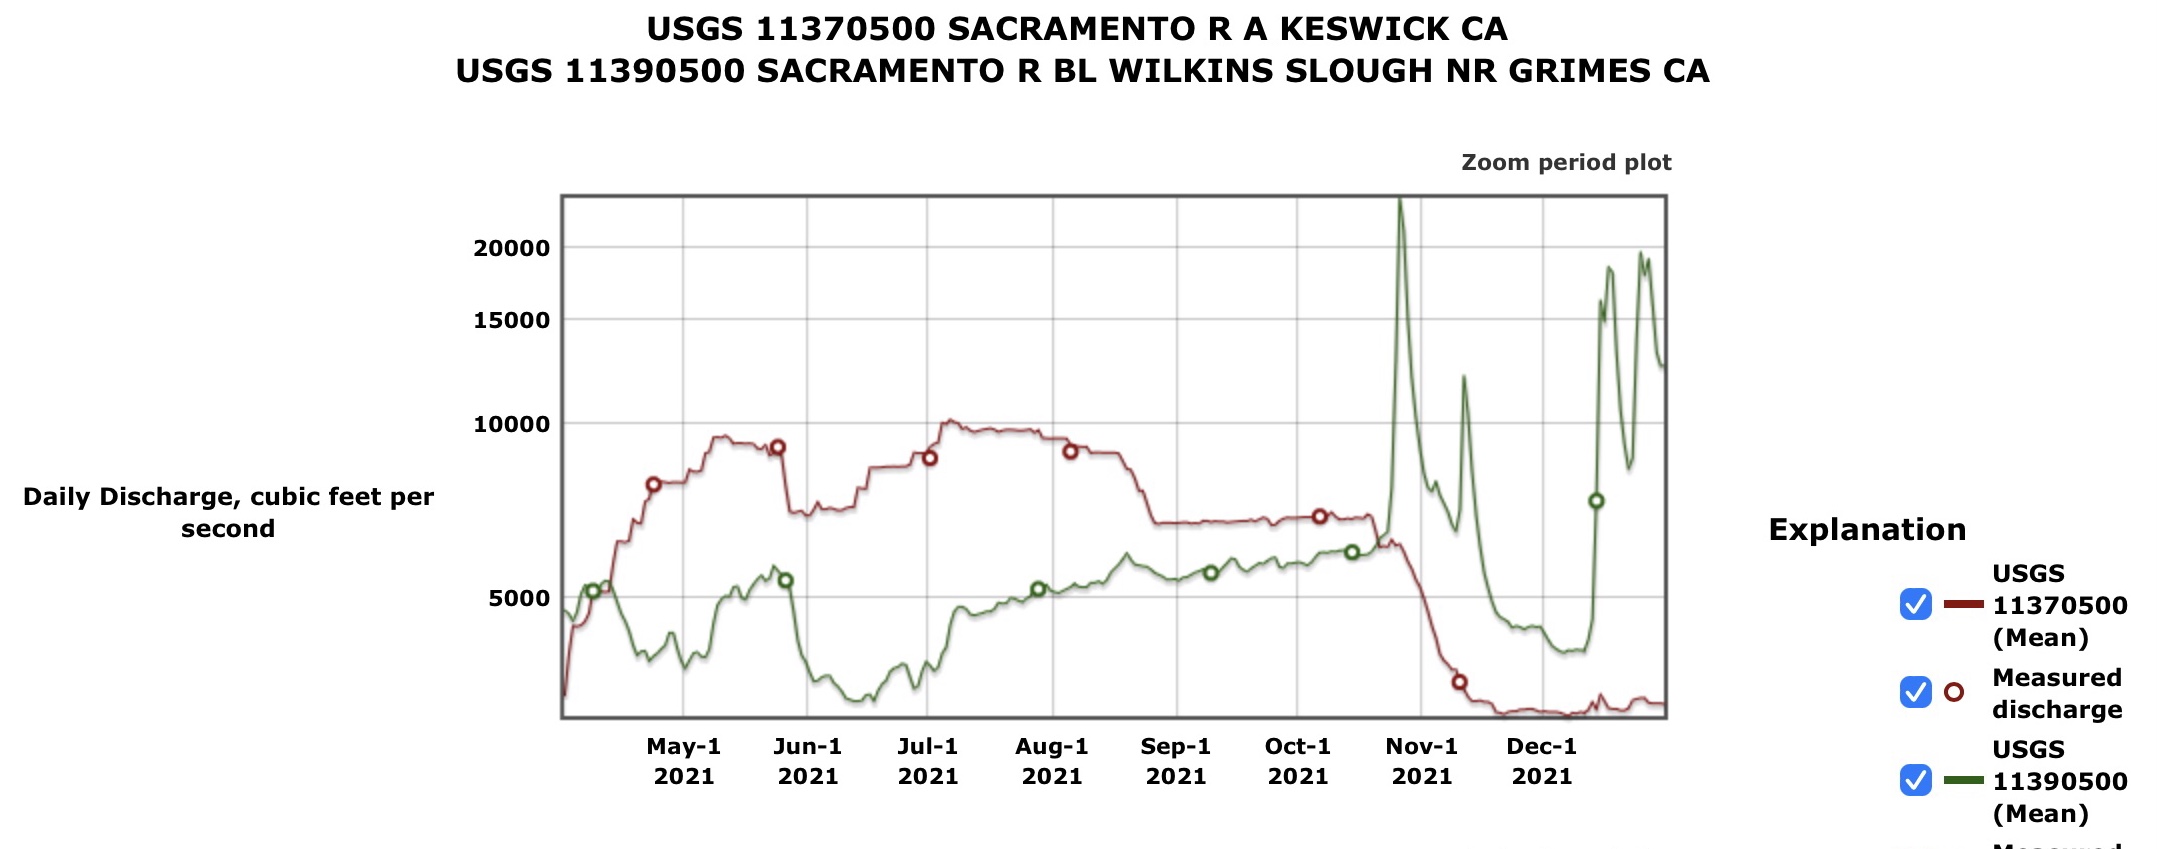
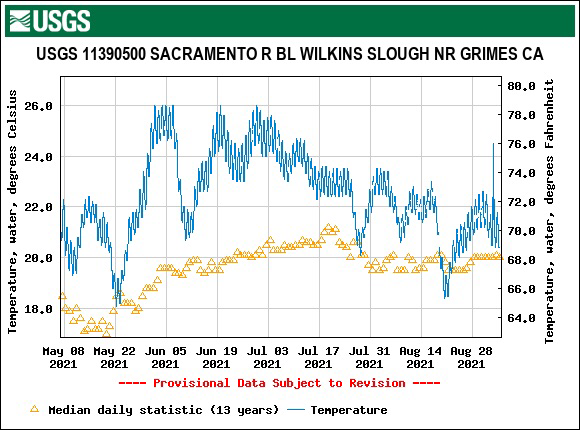
The downside of this huge run of fish became apparent in summer 2021. High air temperatures in mid-June pushed the thermometer over 100 degrees F. for several days, and water temperatures in Butte Creek soared. Meanwhile, operations of the imported West Branch Feather River water for PG&E’s DeSabla powerhouse hit a snag when one shallow (and warm) West Branch reservoir (Round Valley Reservoir) ran out of water earlier than expected. This led to a drop in flow that affected Butte Creek for about 24 hours (Figure 2 below). Colder water was released from another West Branch reservoir (Philbrook) a day later and quickly moderated temperature in the creek, but the brief drop in flow came about the same time as the start of the disease outbreak among the holding salmon in Butte Creek. Water temperatures began to rise above 19.8 degrees Celsius soon after the flow drop on June 23 (Figure 3 below). Dead fish afflicted with Ich and Columnaris began turning up in the pre-spawn mortality survey just a week later. Another two weeks later, hundreds of dead fish began rotting in Butte Creek or were dragged off by opportunistic wildlife. By the end of July, when surveys were interrupted by smoky conditions from the Dixie Fire, almost 14,000 pre-spawn mortalities had been counted.
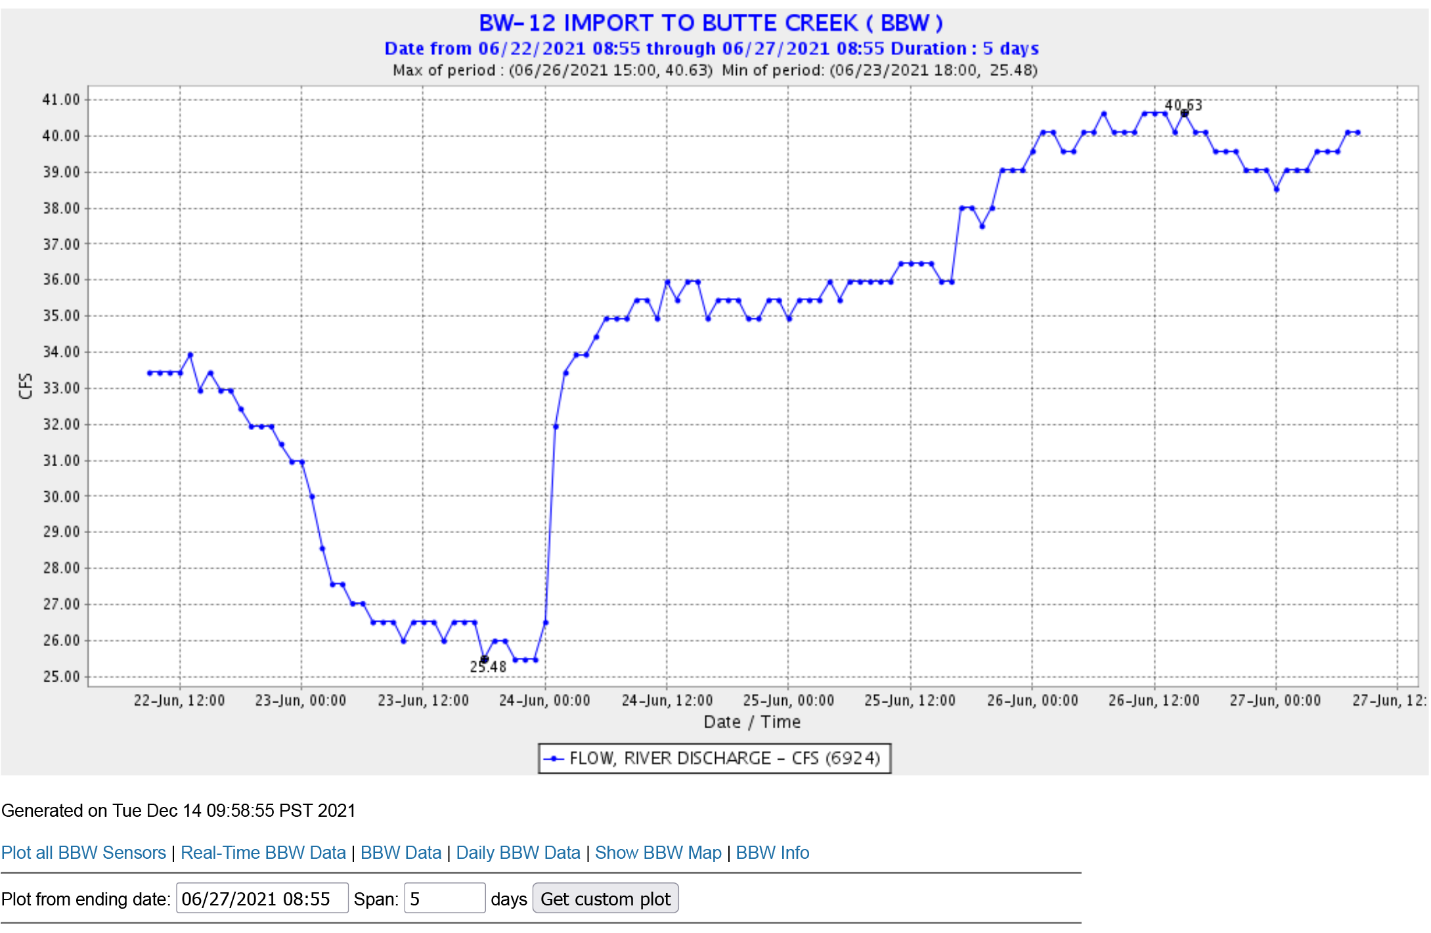
Figure 2. Water import from West Branch Feather River to Butte Creek, June 22-27, 2021.
Source: California Data Exchange Center
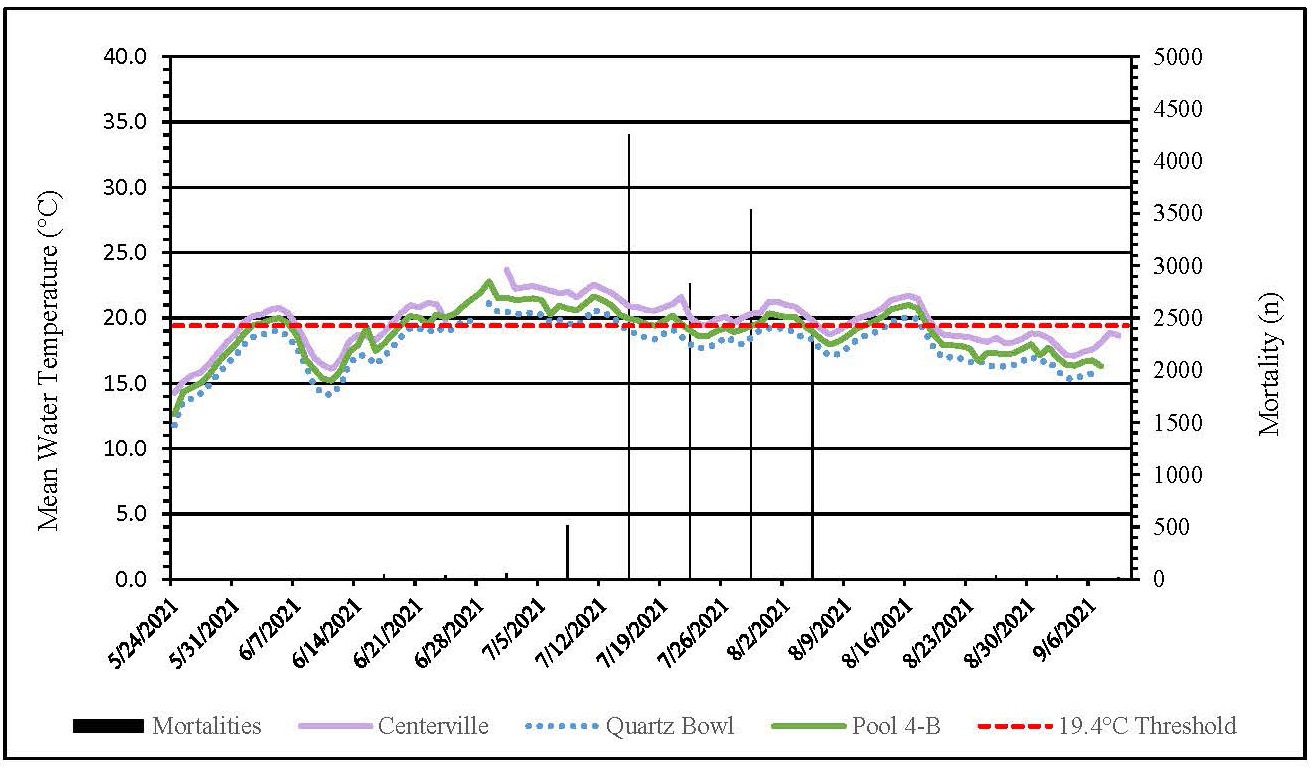
Figure 3: Recorded mean water temperature (ºC) within the 3 holding pool locations along with numbers of pre-spawn moralities recorded throughout the pre-spawn mortality survey.
Source: CDFW Butte Creek Spring-Run Chinook Salmon Adult Monitoring Report 2021
Butte Creek is the most productive salmon stream in California and is the home of what is far and away the state’s most important spring-run Chinook population. However, following a year with good production, good juvenile rearing conditions, good ocean conditions, but nearly 92% pre-spawn mortality, one has to wonder if the management and operations of Butte Creek in Butte Creek Canyon under the current configuration of infrastructure are ever going to be able to provide reliable conditions for spring-run salmon to thrive. Although 2021 was the hottest summer on record in California, new records seem to be set almost every year. The Quartz Bowl (Figure 4 below), where most of the 1807 spring-run that survived in 2021 managed to stay alive, is no longer the refuge it has been in the past.
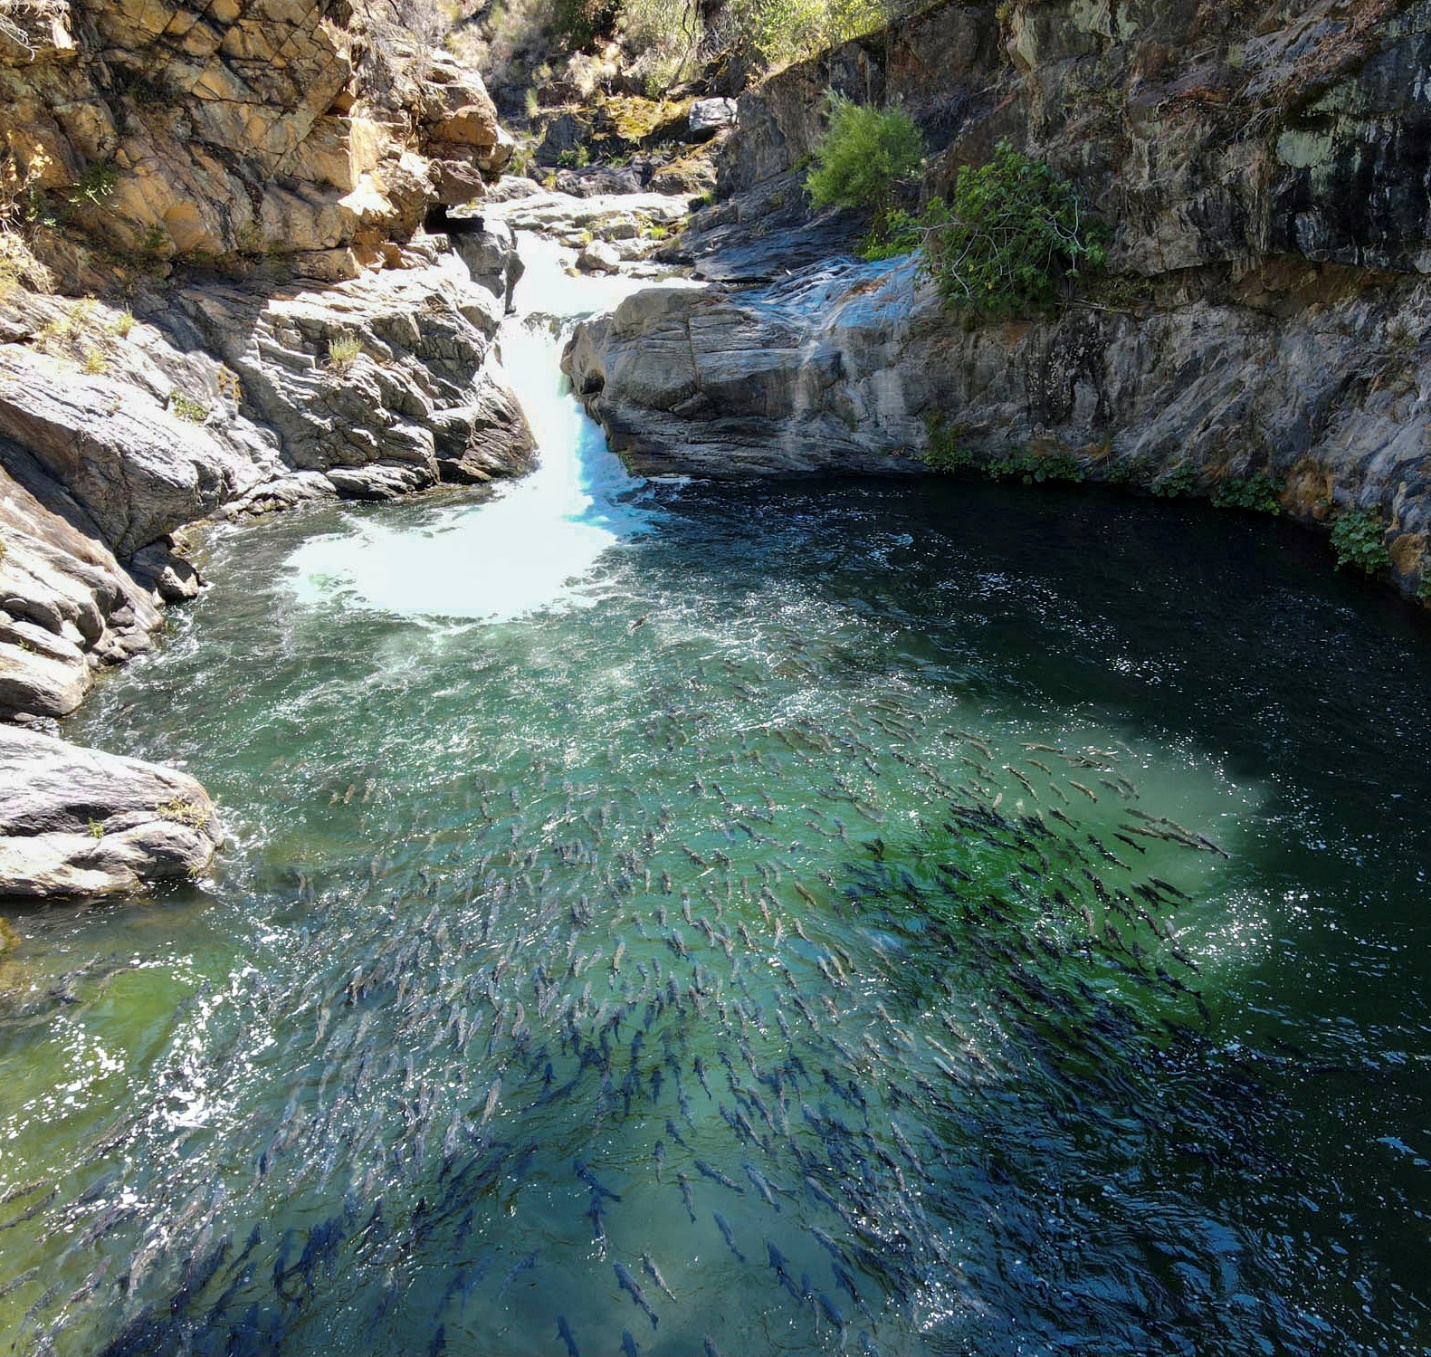
Figure 4. Quartz Bowl Pool, August 2021. Photo by John Sherman.
The salmon spawning reaches of Butte Creek, upstream of the old Covered Bridge near the intersection of Honey Run Road and Centerville Road in Butte Creek Canyon, are largely managed under PG&E’s DeSabla-Centerville Hydroelectric Project, FERC Project No. 803. The Project notably features diversion of water from Butte Creek into the Butte Canal and diversion of water from the West Branch Feather River into the Hendricks Canal and the Toadtown Canal. At the bottom of these canals is DeSabla Forebay (Figure 6 below), a ~200- acre-foot reservoir located next to Skyway (road) on the ridge uphill from the town of Paradise. Water collected in DeSabla Forebay is dropped through a “penstock” (pressurized pipe) into DeSabla Powerhouse, from which it is discharged into Butte Creek. DeSabla Powerhouse is located right next to Butte Creek, about two miles upstream of the Quartz Bowl Pool, the current upstream limit for Butte Creek’s spring-run salmon.
The DeSabla-Centerville Hydroelectric Project’s import of water from the West Branch Feather River helps provide additional cool water for spring-run salmon holding in Butte Creek when managed properly. Maintaining this import of water in some form is essential to the long-term viability of spring-run salmon in Butte Creek.
Historically, PG&E also diverted water at Centerville Head Dam, less than a mile downstream of DeSabla Powerhouse, into Lower Centerville Canal, where water flowed about 6 miles downstream to pass through Centerville Powerhouse, whose outfall re-entered Butte Creek near the community of Centerville. Centerville Powerhouse has been inoperable since 2011, and PG&E has not diverted water into Lower Centerville Canal since 2013.
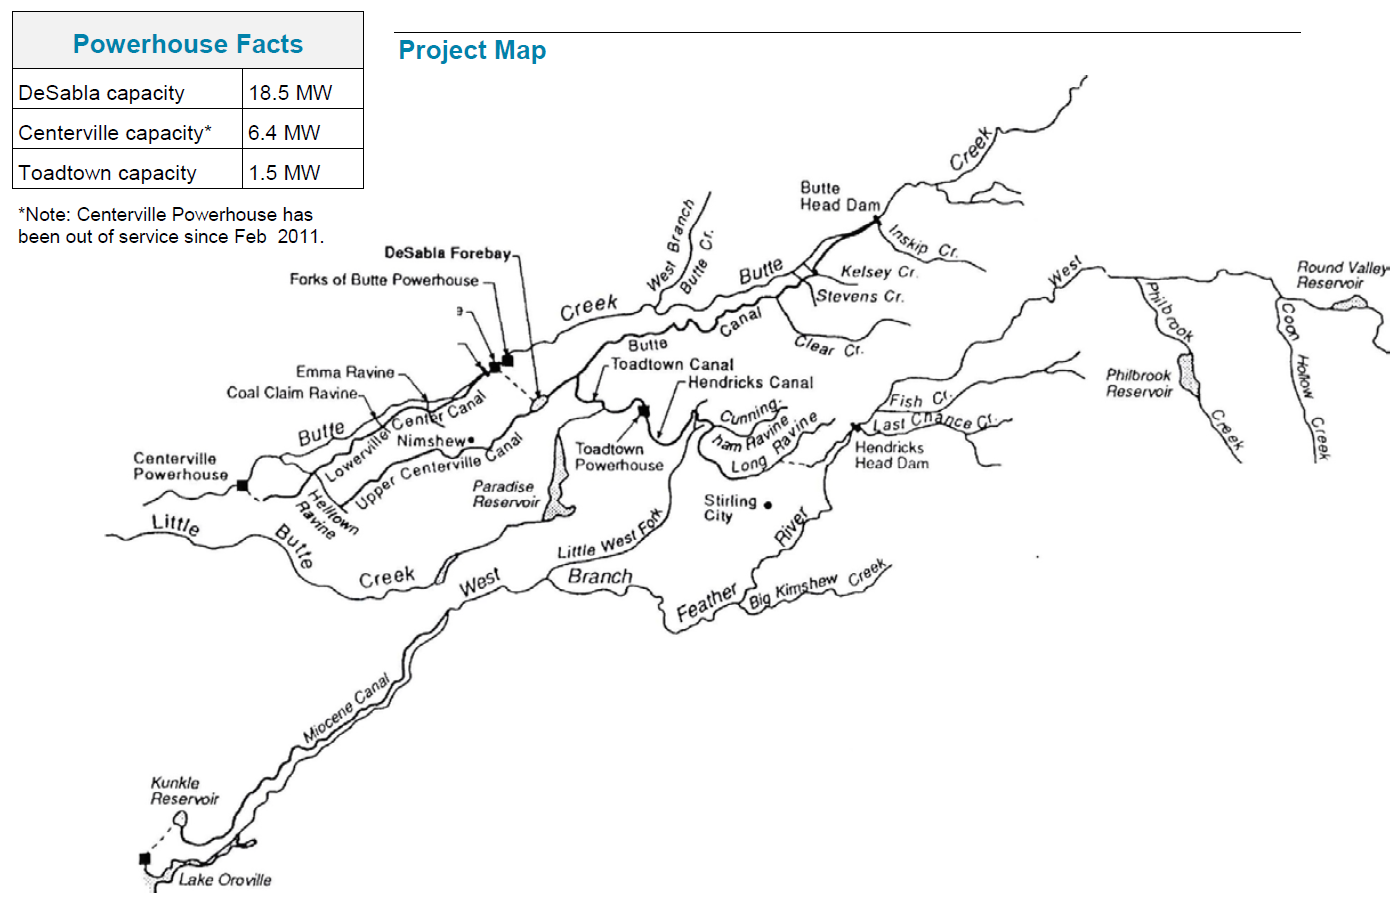
Figure 5. Map of the DeSabla-Centerville Project and area, from February 2017 PG&E flyer distributed simultaneous to PG&E’s request to FERC to withdraw its application for a new project license.
In October 2004, PG&E began the process of seeking a new hydropower license from the Federal Energy Regulatory Commission (FERC) for the DeSabla-Centerville Project. The relicensing was largely complete with the State Water Board’s issuance of a final water quality certification for the relicensing, revised in 2016. A biological opinion from the National Marine Fisheries Service (NMFS) for protection of Butte Creek’s spring-run salmon and steelhead under the Endangered Species Act was the last major remaining step before FERC’s issuance of a new hydropower license.
However, in February 2017, PG&E withdrew its application for a new license, announcing its intention to sell the project. FERC disallowed the withdrawal, but held the licensing process in abeyance pending potential sale.
Five and a half years later, on August 16, 2022, PG&E informed FERC that negotiations to sell the project had ended without sale, and PG&E requested that FERC complete the relicensing process. In the interim, none of the conditions that FERC and the State Water Board were poised to require of PG&E in the new project license have been implemented. Most notable among measures not yet implemented is a device to reduce heating of water as it is held in and passes through DeSabla Forebay. NMFS called out the need for such an infrastructure improvement in a Preliminary Biological Opinion in 2006.
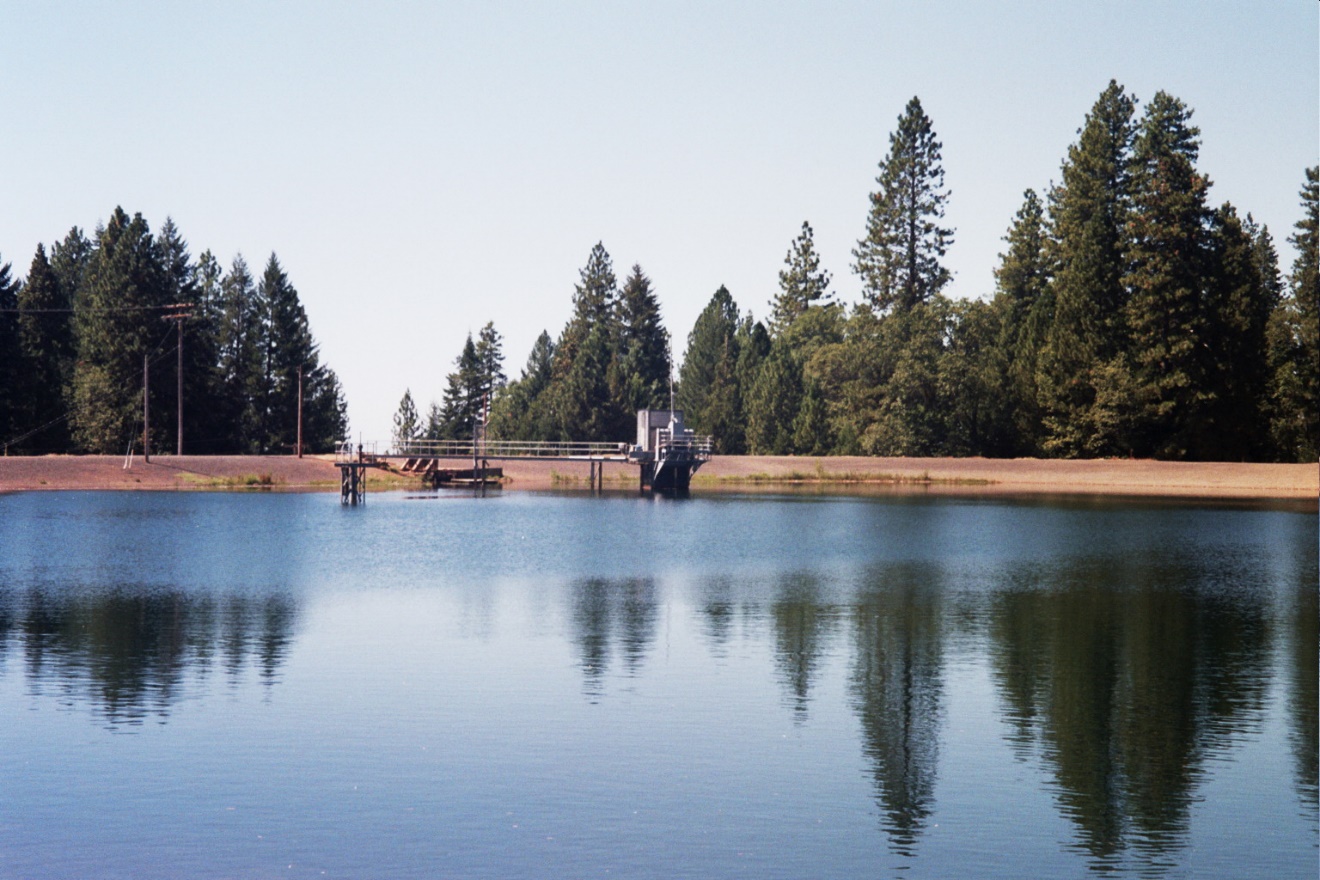
Figure 6. DeSabla Forebay and intake tower to DeSabla Powerhouse. The reservoir is almost totally unshaded; ambient summer temperatures are frequently in the 90’s and above. Photo by C. Shutes.
The mass pre-spawn mortality in 2021 put an enormous exclamation point on the urgency of completing upgrades in the DeSabla hydroelectric project. It should also cause fisheries managers and advocates to revisit decisions about whether a large-scale reconfiguration of infrastructure is needed to keep water imported from the West Branch cold enough to benefit spring-run salmon in Butte Creek. Admittedly expensive options like piping all or part of the Hendricks and Toadtown canals, or bypassing them with a tunnel, may be required. Outside funding may also be required.
Perhaps the best and most durable solution, and one that is being tested elsewhere, is to get the fish upstream to colder water. Three separate studies completed in 1997, 1998, and 2000 by Holtgrieve (CSU Chico), Kier Institute for Fisheries Resources, and Watanabe (CDFG) indicated that there is good habitat upstream, and all recommended further study.
There are problems with fish passage to the upper reaches of Butte Creek. These include natural barriers, such as that at Quartz Bowl, about which fisheries managers have traditionally been squeamish (a notable exception is a recently completed fish ladder past a natural barrier on Deer Creek), and also the no-longer-used Centerville Head Dam (Figure 7 below), which has no fish ladder.
There are also problems with diversion of water out of Butte Creek by the DeSabla Project (into the Butte Canal) and by the nearby Forks of Butte Project, the latter recently offered for sale.
In the past, fisheries managers concluded that the difficulties and costs of fish passage and major new infrastructure outweighed the potential benefits. But given the reality of climate change, increasing temperatures, and greater frequency of drier dry years, it is high time to revisit the tradeoffs. Large-scale improvements may provide value that is well worth the costs to save the extraordinary run of spring-run salmon in Butte Creek.
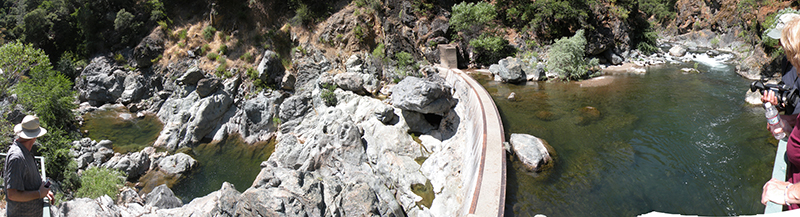
Figure 7. Centerville Head Dam. Photo by Allen Harthorn.
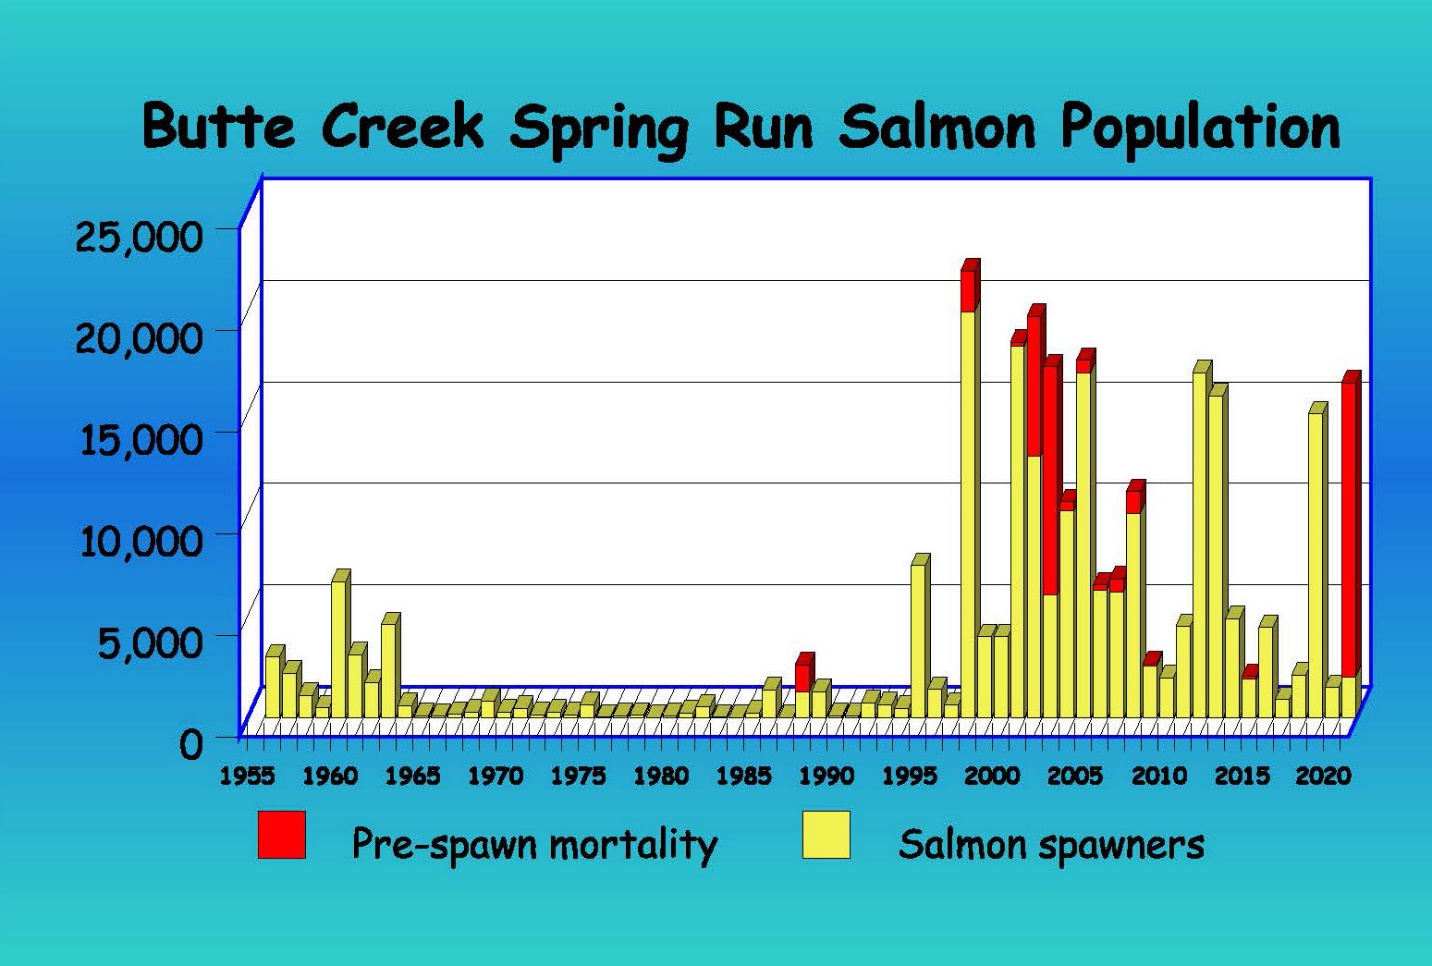
Figure 8: Butte Creek annual escapement and pre-spawn mortalities, 1956-2021. Figure created by Friends of Butte Creek.
Allen Harthorn
Executive Director
Friends of Butte Creek