Guest Blog: Salmon Declines and Hatchery Options

(Editor’s Note: From time to time, the California Fisheries Blog gets requests for guest posts. We like to accommodate requests for posts that we feel, at our sole discretion, are substantive and thought-provoking. Though we discourage pseudonyms, we may, as here, allow posts without attribution when such posts allow a platform to speak out for persons who are professionally constrained. We reserve the right to edit guest posts for clarity. As with all posts on the California Fisheries Blog, guest posts do not represent the policy or opinions of CSPA.)

By “Kilgore Trout”

On Saturday (March 18, 2023), Sep Hendrickson’s “California Sportsmen” radio show hosted James Stone, current president of the Nor-Cal Guides and Sportsmen’s Association. The Association recently lobbied to close the California salmon fishing season for 2023. The discussion raised several interesting issues about the status and management of salmon.

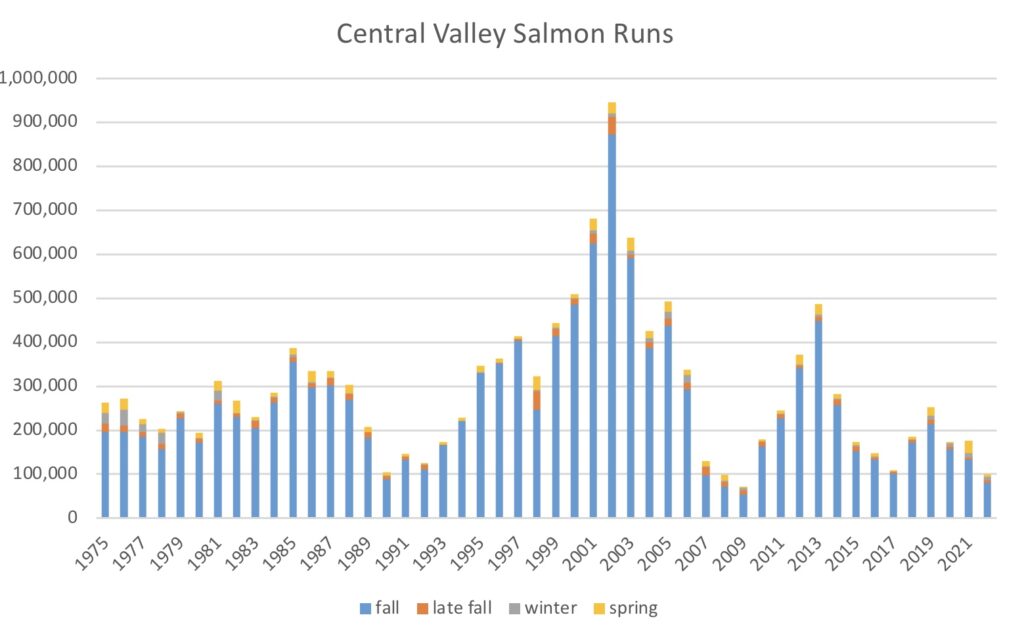
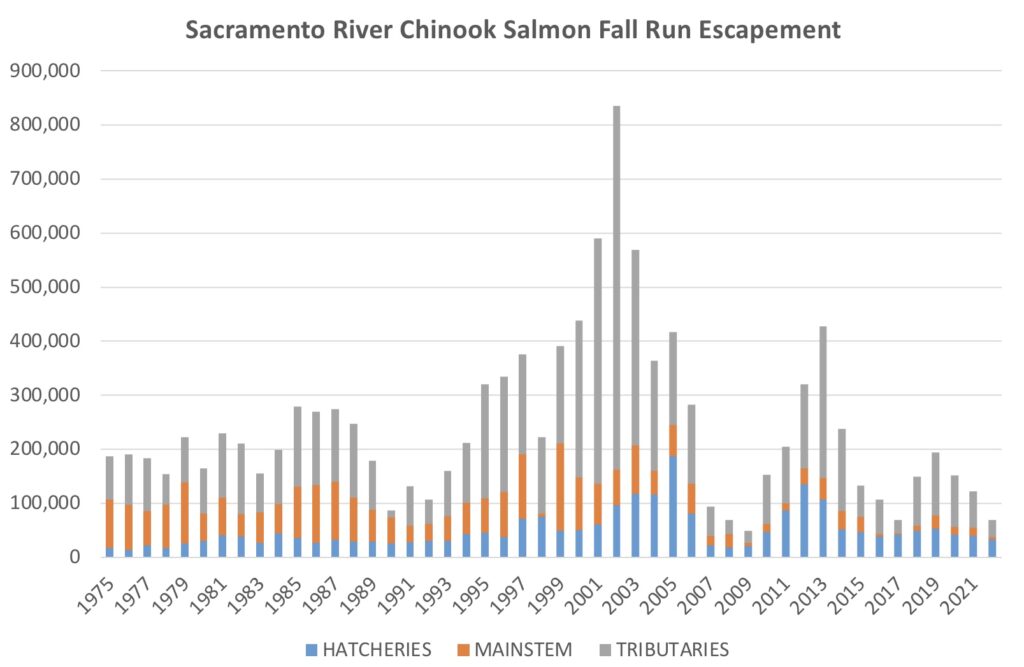
Mr. Stone questioned why regulators did not close the salmon fishery earlier than this year. He noted that in 6 of the last 8 years, the annual escapement of Sacramento fall-run Chinook salmon was below the minimum conservation objective of 122,000 adults, a dismal 75% failure rate for forecasters.

As background, the Sacramento fall-run Chinook is the dominant salmon population commercially fished offshore of California. The population is an aggregate of hatchery and natural production, dominated by hatchery production. A year’s escapement is the abundance of adults that return (in the fall) to spawn in the Sacramento River, its tributaries, and hatcheries. The following spring, the fall-run Chinook offspring of natural-origin emerge from the gravel, smolt, and migrate seaward; the hatchery-origin fish artificially produced by broodstock matings are fed and reared as fry and smolts (in raceways or ponds), then released near the hatchery, or trucked to the estuary or Bay for release.

Sep and James agreed that all too often, 100% of California’s recent salmon declines are blamed on climate change and droughts, not factors like overfishing after years of low escapement. Indeed, a NOAA study conducted after the 2008 closure of the California salmon fishery attributed the collapse primarily to poor ocean conditions, but also noted contributing factors like dry inland conditions and fishing.

Sep and James continued to discuss water management in California’s Central Valley. James reminded listeners that California’s Fish and Game Code 5937 requires dam operators to release water to protect fish. This is correct, and it seems that conservation objectives for salmon (like suitable river temperatures and minimum escapement numbers) should be established to account for environmental variations like hot summers and dry winters that contribute to poor brood years. What’s the point of establishing salmon protections if we scream “Emergency!” and toss protections aside whenever consecutive dry years put agricultural or municipal water users in a short-term bind?

But water management to conserve salmon is not as simple as host Sep Hendrickson framed it when he contended, “There is water behind dams that is oxygenated that can be added and cool at any time they want to; they choose not to.” There isn’t always enough water, and it’s not as simple as saying that politicians simply choose not to release it from dams.

Salmon juveniles emerging from the gravel near Redding must travel hundreds of river miles downstream, where they enter and transit the Delta and Bay to reach the Pacific. That means the Sacramento River must be cold enough for salmon from Redding to the Bay. At the same time, water is released from reservoir storage for agricultural and municipal uses. For there to be enough cold water in the bottom strata of Shasta Reservoir to cool the Sacramento River for salmon, water released from the reservoir in any year must both keep the river cold and retain enough water in storage so that it stays cold later in the year. Shasta’s operators must also retain enough water in storage to allow cold water management in the following year if the following year is dry.

There isn’t space here for a full discussion of Sacramento River water supply and use, or the constraints on achieving temperature (and other) requirements for salmon. This would involve considering complex topics like salmon biology, climate, flood control, drought management, federal water contracts, State water rights, Delta salinity, ocean conditions, and others. But the issues are more complex than politicians (like our Governor) simply choosing not to release water for salmon.

Recognizing the gravity of the Sacramento fall-run Chinook collapse, James Stone warned, “If we don’t raise more hatchery fish, we could possibly lose the fall run forever.” Sep Hendrickson responded, “We need a state-of-the-art hatchery. We can do this state with one hatchery, centrally located that handles everything…” James Stone told listeners they could join the Nor-Cal Guides and Sportsmen’s Association, which has lobbied since 2019 for funds (up to $100 million) for a new hatchery on the mainstem Sacramento River. Stone described it as a modern facility that would allow the trucking of fish and the return of fish, and help protect our stocks for many years. The hatchery’s objective would be to “re-colonize and re-populate the Sacramento River with hatchery fish” and “get them to spawn in the rivers and start reproducing the natural spawn.” Stone added that a healthy river is the best hatchery because it could produce millions more salmon eggs than a hatchery.

Getting funds could help if the objective of “…reproducing the natural spawn” could be achieved by supplementing the production of natural-origin salmon in the Sacramento River watershed.  But would another large, production hatchery “reproduce” the natural spawn, or hasten its replacement?

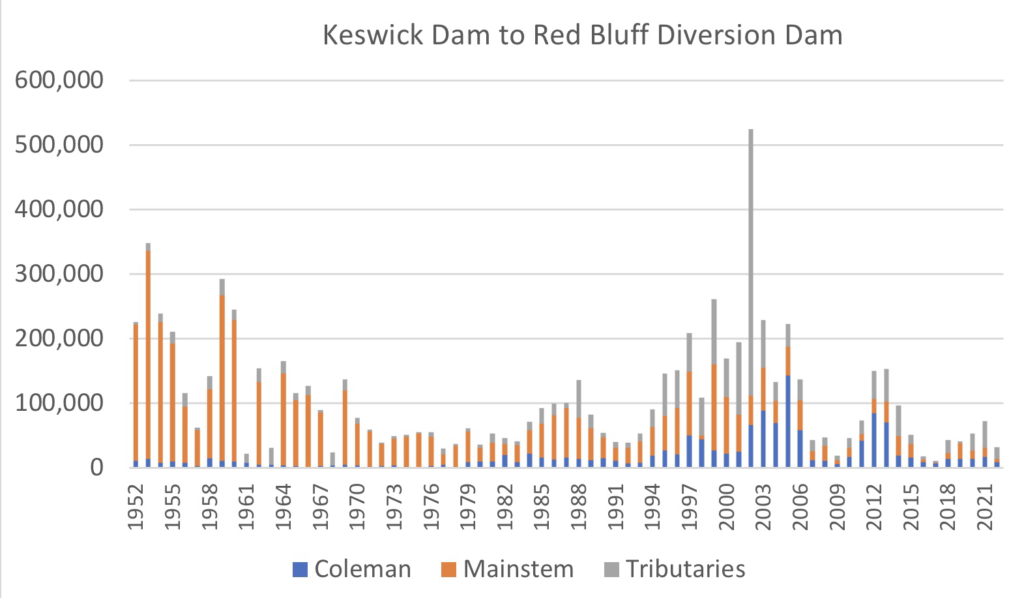
After all, hatcheries in the Sacramento River watershed already produce and release millions of Sacramento fall-run Chinook. The Coleman National Fish Hatchery (Battle Creek) releases 12 million fall-run Chinook smolts annually. The Feather River Hatchery has an annual goal to release 6 million smolts, and the Nimbus Fish Hatchery (American River) another 4 million. Other Central Valley hatcheries not in the Sacramento River watershed also release fall-run Chinook. The goal of the Mokelumne River Fish Hatchery is to release 5 million smolts, with an additional 2 million released into San Pablo Bay or into acclimation pens in the ocean. The Feather River Hatchery also produces an additional 2 million fall-run Chinook to truck downstream for an ocean enhancement program. Before building another large hatchery, it seems fair to ask why releasing millions of hatchery fall-run Chinook – year after year – hasn’t already reproduced the natural spawn.

What if current hatchery practices are also exerting negative effects on Sacramento fall-run Chinook, like overfishing and unbalanced water management do? Yes, some California hatchery facilities are very old, but what if investing $100 million to bring them to state-of-the-art production levels makes at least some things worse?

Ditto for building “one hatchery, centrally located that handles everything…” We already know that very little population structure remains in the Sacramento fall-run Chinook; the variation or diversity that once existed has been greatly diminished from the time when they thrived not only in the Sacramento River, but also in large tributaries like the Feather, Yuba, and American rivers, and in numerous other smaller rivers and streams in the watershed. Large dams that eliminated nearly all the upstream natal habitat of the winter-run and spring-run Chinook are generally regarded as the primary cause of the demise of these stocks. But the dams did not eliminate nearly as much fall-run Chinook habitat because the fall-run do not migrate as far upstream to spawn. So, relative to habitat loss due to dams, did hatcheries play a larger role in the “homogenization” observed in the fall-run Chinook stock?

We know that salmon in streams do not select mates randomly, so the random mate selection in hatcheries effectively eliminates adult competition. We also know that captive rearing and feeding of juvenile salmon minimizes the mortality that would naturally occur in a river. Do juvenile salmon in hatchery ponds acquire food or avoid predators the same as fish in the wild? It also makes sense that wild juveniles migrating hundreds of miles in a river must adapt to more perilous environments than do hatchery fish transported in trucks. Are the consequences of these hatchery effects the losses of vigor, the ability to adapt to local environments and variation, and evolutionary fitness?

It seems we could better understand hatchery effects by spending some of the $100 million on modern salmon monitoring. Genetics-based tools already exist, so that all hatchery broodstock can be tissue-sampled and genotyped, with the information stored in a computer database. All hatchery offspring (millions of fish) would be effectively “tagged” and their hatchery of origin could be identified later, if they are genotyped when captured — in the fishery, after straying to the natural spawning grounds, when interbreeding with wild fish, etc. Similarly, tissues from salmon carcasses on the natural spawning grounds could be collected and genotyped (they are already surveyed every year by the California Department of Fish and Wildlife). This process would genetically “tag” the natural-born offspring in the Sacramento River and its tributaries.

These tools would allow biologists and managers to know the origin of a salmon. They could also better understand the effects of artificial propagation, such as interbreeding, on natural-origin fish. We could begin to understand if hatcheries could “re-colonize and re-populate the Sacramento River with hatchery fish” and “get them to spawn in the rivers and start reproducing the natural spawn.”

An alternative to building and ramping up another large production hatchery might be  to try (mobile) conservation hatchery set-ups, to temporarily supplement wild stocks in the Sacramento River and tributaries. With genetic tagging, we could know how well the offspring survive to return and spawn, and how successful their offspring are at surviving and reproducing. We could detect if and when the rivers get healthier, and begin producing more eggs and adult salmon than the hatcheries do. We might get to a place where there is no need to clip adipose fins.

Let’s start working together to recover salmon!

With Salmon Season Closed for 2023, the Work is Just Beginning

The final rules adopted by NOAA Fisheries and California Department of Fish and Wildlife this spring will be much different than last year’s rules.  The 2023 commercial and sport fishing closure is designed to ensure that adequate numbers of fall run salmon, the primary stock of the fishery, return to spawn this year and  begin the recovery of the population to allow future fisheries.  The Pacific Fisheries Management Council (PFMC) and the California Fish and Game Commission are taking this extreme action as their authorized contribution to the recovery of collapsed California’s salmon populations.  This year’s salmon closure follows yet another three-year drought (2020-2022) and associated water mismanagement.

But the work does not stop at closing the season.  The legal authorities of other state and federal agencies must now kick in and do their part.  With the salmon out in the ocean now protected, the next steps are to protect broodyear 2022 that is now in the rivers and the Bay-Delta estuary, and to be ready for the return of remaining broodyear 2019 and broodyear 2020 and 2021 adult salmon that will re-enter fresh water to spawn this fall and next year.

Hatchery Production

There are 20 million or so fall-run salmon pre-smolts soon to be released this spring from the seven Central Valley salmon hatcheries.  Hatchery personnel will release these salmon to the rivers, Delta, Bay, and coast.  Where and when they do so will greatly affect how many salmon reach the ocean and return to the rivers to spawn (escapement).

The following measures if adopted will increase success:

  • Truck as many smolts as possible to the coast and Golden Gate. Hold as many as these as possible for late spring, summer, and late fall (yearling) release.
  • Limit in-Delta and East Bay releases, because to succeed they must occur in early spring when receiving waters are cool. Early spring releases are smaller fish that do not survive as well, especially if they are released near the hatcheries.
  • Coordinate river (near-hatchery) releases in spring with river and Delta inflow/outflow flow pulses and with optimal water temperature and turbidity conditions.
  • Appropriately clip all adipose fins, and coded-wire tag all smolts.
  • Track and analyze survival under varying release strategies.
  • Adopt a Parental-Based-Tagging (PBT) program to support the overall recovery program.
  • Fund and implement hatchery program facilities and operational improvements, as recommended and planned by agencies.

Natural Production

Millions of eggs will be spawned in rivers this fall, despite what may be a near-record-low number of returning adults (escapement) in 2023.  It is imperative that the young salmon hatched from these eggs survive and contribute a maximum of natural-born smolts to the ocean.  We are so lucky that Mother Nature has provided the necessary water resources this year to allow that to happen.

As it is, only 32,000 adult salmon spawned naturally in rivers last fall, compared to 300,000 just a decade ago.  The earlier 2010-2016 recovery was a great accomplishment soon after the 2007-2009 population crash, when natural born escapement was only 25,000-70,000 (see Table 1).  That recovery was brought about after two years of fisheries closures (2008-2009) and three relatively abundant water years (2010-2012).

The following measures if adopted will increase success:

  • Provide coordinated spring river flow pulses with storage reservoir releases and/or foregone water diversions (if necessary).
  • Maintain minimum flows in rivers to meet or exceed year-round water temperature standards.
  • Limit south Delta exports during natural or induced flow pulses, and otherwise follow the export restrictions required in the 2008-2009 Biological Opinion.
  • Minimize salmon egg, embryo, and fry stranding in spawning gravel beds (redds) that occur when reservoir releases are reduced after spawning has occurred.
  • Minimize stranding, entrainment, or adverse water temperature changes caused by otherwise legal water diversions.
  • Limit agricultural or municipal waste water discharges that may increase water temperature in key salmon habitats.
  • Upgrade gravel supplies in prime spawning habitats before next fall’s spawning season.

Future Fisheries

In addition to closing fisheries and limiting harvest this year, it will likely be necessary to limit harvest in 2024 and 2025.  This is because of the over-harvest in 2021 and 2022 of broodyears 2018 and 2019 (Figure 1), which will likely lead to poor returns from broodyears 2021 and 2022 (Figure 2).  Broodyear 2021 is of special concern, because, like broodyear 2020 (whose poor prognosis for 2023 escapement led to the fishery closure), broodyear 2021 reared and out-migrated in a critical drought year (2022).

The following measures if adopted will increase success:

  • Plan for a closure in 2024 to protect an expected poor return from broodyear 2021.
  • Consider as an option for the 2024 and 2025 seasons a mark-selective fishery if the measures under Hatchery Production outlined above are accomplished and show signs of being effective.

Other recommended actions

https://www.fisheries.noaa.gov/feature-story/endangered-salmon-regain-access-healthy-west-coast-habitat-through-20-projects-funded

https://wildlife.ca.gov/News/cdfw-announces-225-million-to-benefit-salmon-and-support-critical-habitat-projects-statewide#gsc.tab=0

Chinook escapement in Sacramento River

Table 1. Source: PFMC.

Graph of Sacramento Index from 1983 through 2022

Figure 1. Sacramento River fall-run Chinook salmon population index comprised of escapement (natural areas and hatchery counts) and river and ocean harvests. (Source: PFMC)

Graph recruits versus spawners

Figure 2. Author-developed spawner-recruit relationship using total escapements in Table 1. Number shown is recruit year escapement (left y-axis is log(x) minus 4 of recruits) plotted against spawner escapement (x-axis, recruitment three years prior). Actual number is shown in log scale on right y-axis. Red lines are target PFMC escapement range for fishery. Red and blue circles show recruitment difference between wet and dry years at maximum sustained yield spawner levels. (Spawner levels of 300-500 thousand levels can yield 500,000 recruits from wet years or as few as 100,000 recruits from dry years). Note poor recruitment in 2021 and even less in dry year 2022 due to over-harvest.


Yuba River Fall Run Salmon – Status Winter 2023

When I last assessed the status of the fall-run salmon population of the Yuba River near Marysville in a 1/31/22 post, I stated: “The population remains in a very poor state – at about 10% of recent historical levels during and subsequent to multiyear droughts 2007-2009 and 2013-2015 (Figure 1).” Since the record low run in 2017, the fall run on the Yuba River has not recovered.

The failure of the four more recent runs to show signs of recovery (Figure 1) is especially concerning because 2017 and 2019 were wet years. The failure to recover may be simply the lingering effects of the drought years 2014-2015 and the ongoing effects of the 2021-2022 drought. More likely, the spawning stock has collapsed and is in dire need of support. The 2022 run appears to be even worse than the past four runs,1 thus adding to the concern.

This post delves into the many possible causes of, or contributors to, the collapse of the Yuba River fall-run salmon population. The story is a complicated one. It starts with broodyear 2014.

Graph from 1953 though 2021

Figure 1. Yuba River fall-run salmon spawning escapement estimates 1953-2021. (Data source: GrandTab)

The first stop in pursuit of the potential causes of the recruitment failure that has occurred not only on the Yuba River, but in most of the other Central Valley fall-run salmon populations, is a close look at the escapement data.  The spawner-recruitment relationship (S/R) shown in the escapement data (Figure 2) provides a closer perspective than the simple histogram of the run sizes (Figure 1).

The S/R figure is a plot of the log of the escapement with the log of the escapement three years earlier. This is because about 80-90% of spawners are three years old.  The three red lines in Figure 2 show that adult spawners in 2014 produced the spawners 2017, which in turn produced the spawners in 2020.  The adult spawners in 2018 produced the spawners in 2021.  Spawners in 2019 produced spawners in 2022, which based on the incidental reports will likely show up to the lower left of 19.  The lower-left quadrant of an S/R plot is usually a place where a salmon population is headed toward collapse and an inability to sustain itself.

Graph of Spawners versus Recruits

Figure 2. Yuba River fall-run salmon spawner-recruit relationship (1978-2021) with recruit number shown in chart for specific years. Red lines point from spawner to recruit year. For example, recruits in 2017 led to recruits in 2020. Recruits in 2014 (12,000) led to only 1500 in 2017.

When Yuba River escapement (recruitment) is adjusted for strays from other rivers, the recruitment level in record low 2017 (Figure 3) shows itself to be even more dire.  The Yuba River receives many strays because it carries a strong cold-water signal into the Feather River and on into the lower Sacramento River in late summer and early fall.  The Yuba River also attracts spring-run and late-fall-run hatchery salmon that are included in the Yuba River’s fall-run spawning counts.

It is helpful to start the analysis of the 2017 population crash by reviewing the early life cycle of broodyear 2014 – as eggs in their mothers.  Their parental stock, broodyear 2011, had been reasonably normal, if not in the range that might be considered the Maximum Sustained Yield 10,000-15,000 (Figures 1 and 2).  The strong numbers of broodyear 2011 spawners (and their broodyear 2014 eggs) arrived in the Bay in summer 2014.  The questions become what happened to:

  1. those broodyear 2011 adult females;
  2. their broodyear 2014 eggs and their hatchlings in summer-fall 2014;
  3. the surviving broodyear 2014 fry in winter 2015; and smolts in spring 2015;
  4. the yearlings, two-year-olds and three-year-olds in the ocean; and finally
  5. the adults making up the 2017 run counted in the Yuba River spawning grounds.

The answer is that survival conditions were not good for all five categories above.  Each question is addressed below.

Two graphs

Figure 3. Yuba River escapement numbers. Source: PFMC 22, p.49.

1. The first question addresses the conditions that faced broodyear 2014 eggs when they entered the Golden Gate inside their broodyear 2011 mothers that fateful summer of 2014. Water-year 2014 was a critical drought year, during which the State Board weakened Delta water quality standards for the year.

    • Unusually warm water met the salmon when they entered the Bay in summer of drought year 2014 (Figure 4). By the time they reached the mouth of the Feather River at Verona (if they got that far), water temperatures were near the lethal 75º F level through September (Figure 5).  Elevated water temperatures occurred through the entire route from the Golden Gate to the Yuba River.
    • Once on the spawning grounds of the, Yuba the parents of broodyear 2014 eggs encountered drought-year low flows (Figure 6), which in addition to being warm provided minimal available spawning habitat quantity and quality.
    • By the time the parents were ready to spawn in early fall, they were likely compromised by disease and thiamine deficiency, limiting the viability and survival of the broodyear 2014 eggs, and thereby the potential reproductive success of broodyear 2014 and its contribution toward 2017 recruitment.

2. The second question addresses the subsequent fate of surviving broodyear 2014 eggs and the hatched alevins in gravel redds. The eggs and alevins in the spawning beds faced unusual stresses in the form of erratic flow and very low flows (Figure 7).  Eggs spawned in October-November were subjected to scouring flows in December.  Eggs spawned in December under the high flows were subsequently subject to dewatering in January.

Graph water temprature versus time

Figure 4. Water temperature in San Francisco Bay spring-summer 2014.

Graph of water temperature versus time

Figure 5. Water temperature in Sacramento River below mouth of the Feather River at Verona gage July-October 2014.

Graph of Daily Discharge in 2014

Figure 6. Streamflow in Yuba River at Smartsville and Marysville gages July-October 2014.

Discharge Graph 2014

Figure 7. Yuba River streamflow in water year 2015 and 53-year average at Marysville gage.

3. The third question addresses conditions in the late fall through spring in critical drought water year 2015. Emergent fry likely benefitted from the February flow pulse that facilitated some fry movement out of the Yuba toward the Delta (see Figure 7).  Those fry that did not move were then subjected to extremely low flows (and stressful water temperatures) through the spring in the lower Yuba River and the lower Sacramento River below the mouth of the Feather River (Figure 8).  Delta and then Bay conditions were at their worst for young Yuba salmon on their way to the ocean in the spring of drought year 2015, made worse by the State Board’s continued weakening of water quality standards.

Graph of discharge in 2015

Figure 8. Streamflow and water temperature in the lower Sacramento River below the mouth of the Feather River at Verona gage in winter-spring 2015.

4. The fourth question regarding broodyear 2014 addresses growth in the ocean from 2015 through early summer 2017. In the ocean, they were subjected to strong fishery pressure (Figure 9) in all three years by the commercial and sport fisheries.  This provokes a series of questions.  Why did the Pacific Fisheries Management Council or PFMC allow those 50%+ harvests after the 2008-2009 collapse and fishery closures, and lack of subsequent population recovery?  Had the fall-run salmon populations really recovered sufficiently to sustain 50%+ harvests?  How accurate were those harvest rate estimates?  How hard were the stocks being preyed upon by seals and orcas?  Were the salmon whose diet had largely consisted only of anchovies becoming thiamine deficient by the time they spawned in the Yuba in early fall 2017.  In considering all these questions, one can only conclude that the summer upstream migration of fall-run salmon to the Yuba in 2017 had been highly compromised before it started.

5. The fifth and final question regarding broodyear 2014 salmon addresses conditions adult fish faced when they re-entered fresh to spawn after having been subjected to high harvest rates in the ocean from 2015-2017 (implied in Figure 9).  Upon returning to the Bay in summer 2017, a wet year, they encountered much better conditions during their upstream migration and spawning period.  After a final tweak by the summer river fishery, they spawned in the Yuba River in record low numbers.

Nearly identical circumstances and outcomes occurred with broodyear 2015 in 2018 (see Figure 3).  Broodyears 2016-2019 were subject to similar stresses.  Broodyears 2020 and 2021 were subject in-river to critical drought years 2021 and 2022.

In conclusion, it appears that the damage to broodyear 2014 and broodyear 2015 had been done for the most part by the time they returned as adults to the Bay in 2017 and 2018.  The record-low numbers of spawners estimated from the carcass surveys in 2017 and 2018 (Figure 1 and 2) were the cumulative effect of a series of survival factors, beginning with stresses on their parents in drought years 2014 and 2015, and ending with high harvest rates in the ocean and rivers in 2017 and 2018.  Management decisions by the State Board and PFMC, with acquiescence by federal and state resources agencies, contributed to this fateful series of events.  The events and their consequences were predictable, and the State Board and PFMC should have anticipated them and taken appropriate measures at the time.

It appears the same mistakes were made in regard to broodyears 2016-2021.  The effects of drought in years 2021 and 2022 will likely contribute further to the crash of the Yuba River salmon population, with even lower Yuba River and Central Valley salmon escapement in 2023-2025.

For more on the problems faced by Yuba River fall-run salmon and what can be done about them, see this October 2018 post.

Figure 9. Sacramento River fall-run salmon index 1983-2019. The 122 on y-axis is the target starting population level (122,000) under which harvest is allowed. Note the fisheries were closed in 2008 and 2009. Source: PFMC.


Sacramento River Salmon Harvest Forecast: More Bad News

The harvest of Sacramento River fall-run salmon – the largest of California’s dwindling salmon runs – is managed by both state and federal agencies and is based on past-to-present figures of long-term adult escapement (i.e., fish that aren’t caught and survive to spawn) (Figure 1).

The harvest is coordinated under the Pacific Fishery Management Council (PFMC), because many of the ocean fisheries take mixed stocks from both the US states and Canadian provinces. The “fishable” Sacramento River fall-run population is defined as the total number of adults in the ocean and rivers available for harvest in the ocean and rivers. The harvestable stock is defined as adults. It does not include grilse (salmon returning to freshwater after a single season at sea), whose harvest is generally not allowed.

Chart showing past-to-present figures of long-term adult escapement

Figure 1

The PFMC has declared an adult salmon escapement of 122,000-180,000 as a target goal range, a figure that theoretically provides a sustained yield for the fishery.  However, because escapement estimates are not made until the end of the fishery harvest, total escapement has usually fallen below the maintenance goal – especially during drought years or after multiyear droughts.

In some years, sanctioned harvests have led to over-fishing (e.g., 2007, Figure 2). This is because the harvest control rules the PFMC employ are often based on inaccurate estimates of the size of the harvestable stocks and the relative effectiveness of the fisheries – how good the fisheries are at catching salmon (very good, it turns out).

Together, these harvest model errors and biases have led to over-fishing.  This is not a new problem.  Excessive harvests contributed to closure of the ocean salmon fishery off California in 2008 and 2009.

The PFMC and its constituent states and provinces are now developing harvest control rules for the 2023 fisheries.  For the Sacramento River fall-run population, the preliminary estimate of the 2023 harvestable stock is approximately 180,000 fish; accordingly, the PFMC is anticipating a sanctioned harvest, and is now preparing harvest control rules.

But it would be a grave mistake to authorize a 2023 Sacramento River fall-run harvest; there should be no harvest allowed this year.  Why?  There are multiple reasons.

First, the 2019 to 2022 population trend was decidedly downward (Figure 1), and the salmon stock was overharvested in 2021 and 2022.  Also, water year 2021 was a critical drought year that led to poor survival of the 2020 brood year fish.  Due to drought conditions, 2021 brood year salmon experienced poor spawning, incubating, rearing, and emigration conditions.  As a result, the fishable brood year 2020 and 2021 stocks now in the ocean are likely small, and their return to their natal rivers will likely be minimal.  Indeed, the return (escapement) numbers for the 2020 brood year fish could be even lower than those for 2009, 2017, or 2022 – all abysmal years for returning salmon.

The bottom line: prospects for recovering a wild or natural-born salmon population in the Sacramento River and its tributaries will be substantially diminished if a salmon fishery is allowed in California this year.

Chart of the Sacramento Index and relative levels of its components.

Figure 2. Note harvest in 2007 and 2015-2017 resulted in failure to meet escapement goal of 122,000 adult salmon.

Table of the performance of Chinook salmon stocks in relation to 2022 preseason conservation objectives.

Figure 3. There was a fishery in 2022. Note 60,000 escapement for 2022 was only a third of the target goal of 180,000.


Missing an Opportunity Downstream of Shasta Lake Late Fall – Early Winter Pulse Flow for Salmon Needed

Juvenile winter-run, spring-run, fall-run, and late-fall-run salmon need a flow boost in the fall and winter to help them emigrate 300 miles down the Sacramento River from their spawning area below Shasta Lake to and through the Bay-Delta.1 Yet while winter storms have now caused massive runoff downstream, the spawning reach of Sacramento River remains at its minimum flow. Even small pulse releases from Shasta and Keswick reservoirs during storms would start hundreds of thousands of juvenile salmon on their way to the ocean.

Historically, more than 50% of salmon spawning in the lower Sacramento River took place downstream of Clear Creek (Figure 1). That distribution has now changed, with over 90% of the spawning upstream of the mouth of Clear Creek in the 20 miles of river downstream of Keswick Dam. This change is a consequence of water management that confines suitable spawning habitat in summer and fall to the uppermost river reach.

Many juvenile salmon begin their migration to the ocean when the first fall rains create a pulse in streamflow. These fish include winter-run and late-fall-run smolts, and fall-run and spring-run fry. The first fall rain-induced flow pulse has been long recognized as an important functional flow event for all four salmon runs. For many decades, the fall pulse was recognized as an important feature needed in salmon management to ensure good survival of smolts to the ocean.

The fall pulse has often been forestalled in recent decades both by droughts and by water management. When the fall pulse comes, it comes only from upper river tributaries. But the natural salmon production cycle in the upper 20 miles of the spawning reach misses out on the flow benefit of fall rains. All runoff is captured in Shasta Reservoir. While downstream reaches receive tributary rainfall-induced streamflow (Figure 2), the upper river receives no pulse from Shasta Reservoir despite significant inflows (Figure 3). This factor alone is a key factor limiting natural production of the four salmon runs in the upper Sacramento River.

Lack of flow from Shasta also limits the effectiveness of the overall flow pulse (Figures 4 and 5) that carries the juvenile salmon downstream to the estuary. The upper Sacramento River, McCloud River, and Pit River flow into Shasta Lake. These major spring-fed rivers are the largest contributors of natural flows to the Sacramento River watershed, especially in drier years. They have not provided any the mainstem streamflow to the Bay-Delta estuary as yet this year. This pattern is generally true in all but the wettest water years.

Shasta Lake gained about 40,000 acre-feet in the first fall storm (Figure 6). A pulse flow of 5000 cfs for three days (an increase of approximately 2000 cfs for 72 hours) would have amounted to approximately 12,000 acre-feet, or roughly 30% of the water gained and (0.8% of the total storage). Considering that much of the first storm fell as snow, water managers could have reasonably have executed such a short pulse..

The second storm has delivered Shasta Reservoir another 100,000+ acre-feet. With a wet forecast for January, it is now time to release a least a short pulse from Shasta to move juvenile salmon downstream to where they can surf the tributary inflow to the Sacramento River downstream to the Delta. It is not too late. Before the storm that began December 29, most of the juvenile salmon remained upstream of Red Bluff or downstream in the river above the Delta,2 as few had shown in Sacramento seines and trawls (data not shown).

CDFW map

Figure 1. Upper Sacramento River and historic salmon spawning distribution by percent by region. River-mile shown in parentheses. (Data source: CDFW)

Graph of 2022 Sacramento flows

Figure 2. Fall river flows at seven locations from Keswick Dam RM-300 (KWK), Bend RM-250 (BND), Hamilton City RM 200 (HMC), Colusa RM-144 (COL), Wilkins Slough RM-140 (WLK), Verona RM-80 (VON), and Freeport RM-50 (FPT) in the Delta.

Graph of Shasta River Flows

Figure 3. Shasta Reservoir inflow and outflow in December 2022. (Data source: CDEC)

Graph of fry/smolt

Figure 4. Screw-trap catch of fry spring-run and fall-run salmon with environmental data in fall 2022 at three locations in lower Sacramento River.

Graph of Juvenile Chinook

Figure 5. Screw-trap catch of winter-run fry-smolt salmon with environmental data in fall 2022 at three locations in lower Sacramento River.

Graph of Shasta storage levels

Figure 6. Shasta Reservoir storage level in Nov-Dec 2022.