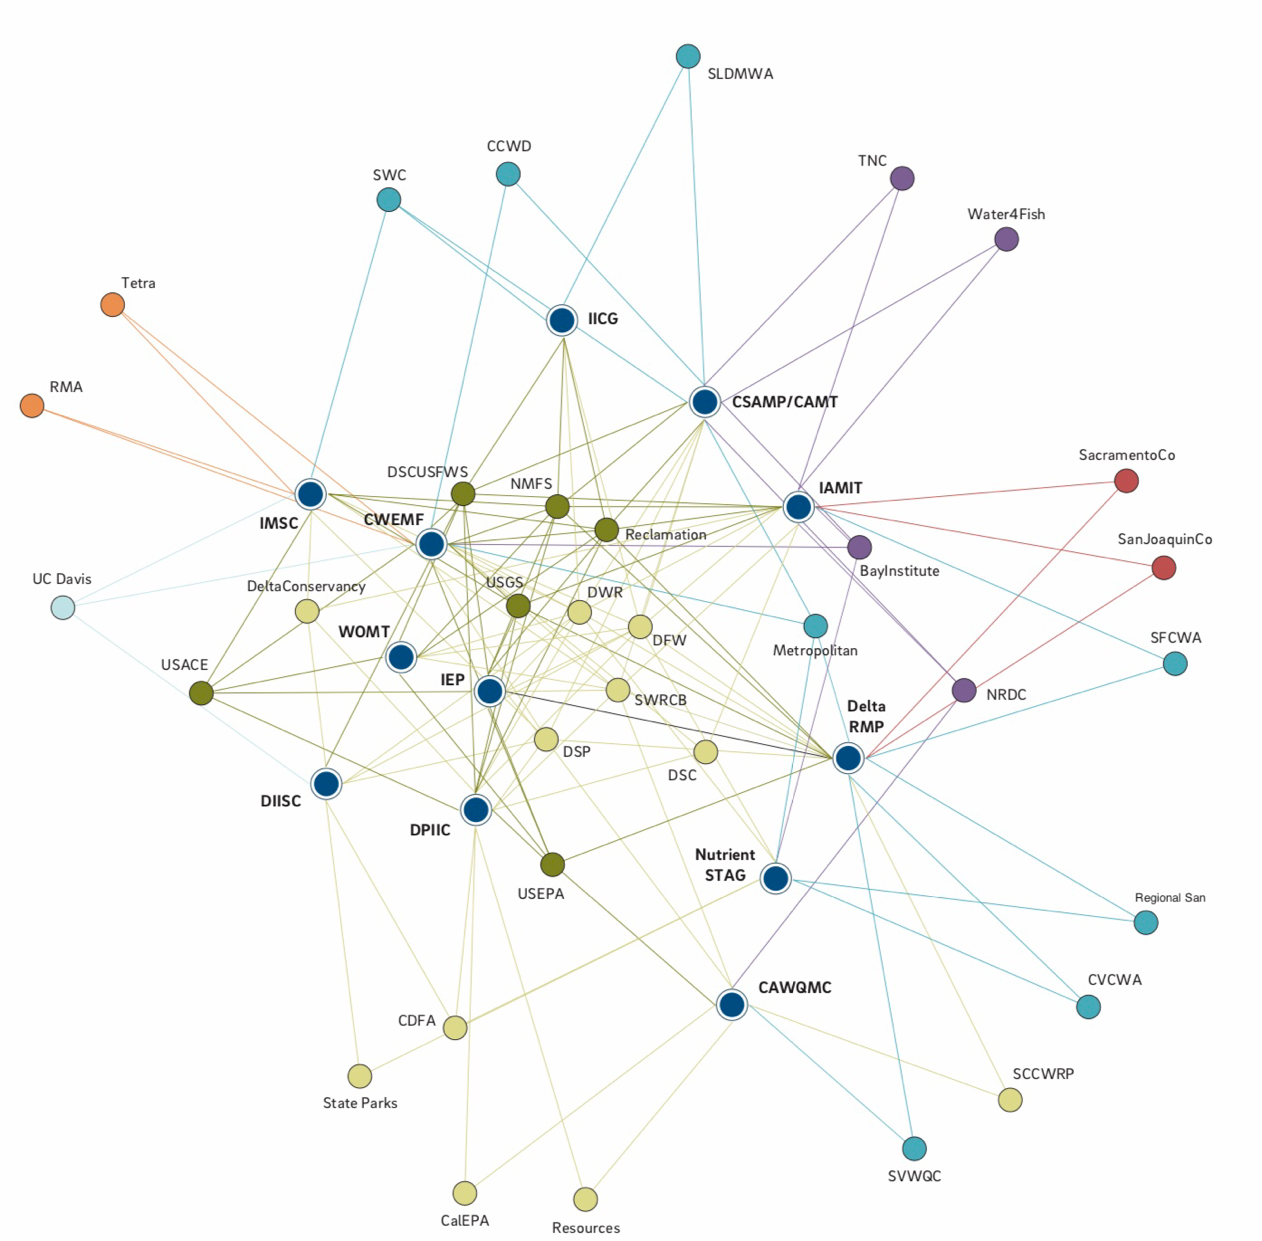
From Delta Science Plan Figure 1-1 | Network map of collaborative groups in the Delta
The new Delta Science Plan (Plan) is a “call” for more collaborative science to improve government decision making affecting the Delta ecosystem. The first page announces the vision for the plan as being “One Delta, One Science.” Really?
Science is not just one thing; it is many things. Science is knowledge. Delta science is knowledge on what makes up the Delta and how it all works together. There is science for all Delta social, economic, and ecosystem components. There is Delta smelt science. There is Sandhill Crane science. There is science on water quality, water supply. There is science on roads, farming, and flood control. There is science on large ship movement through the Delta. The Science can be good, bad, or simply inadequate; it is only as good as the predictions and decisions that one can make from it.
What is missing from the current Plan is a presentation of the major actions that will affect the Delta ecosystem and the ramifications these actions would have on the ecosystem. Also missing is a description of key decisions to be made relating to these actions and the associated science needed to make the decision.
Each ecosystem component should have science and advocates that can assess how specific actions can affect the resources related to that component. Delta smelt should have its science and advocates. These folks need not communicate with the crane folks. On the other hand, the smelt folks may need information from the water folks. Each action should have its own science and science group to understand what the action entails and how it might affect other ecosystem components. Each decision process and decision group should have its science. Each group may need information from other science groups.
The Plan should include a compilation of each ecosystem component’s science and needs, and a clear depiction of the important actions and decisions under consideration for that component. A good plan would summarize the science of each ecosystem component, each major action being considered, and each major decision being contemplated.
The overall success of the Plan will depend on how good the science is in predicting outcomes. Each science group is responsible for its own science, as well as how other groups use it.
Stakeholders need a Plan that instills confidence that each ecosystem group knows its science. Stakeholders also need to know what actions are being planned and how decisions will be made.
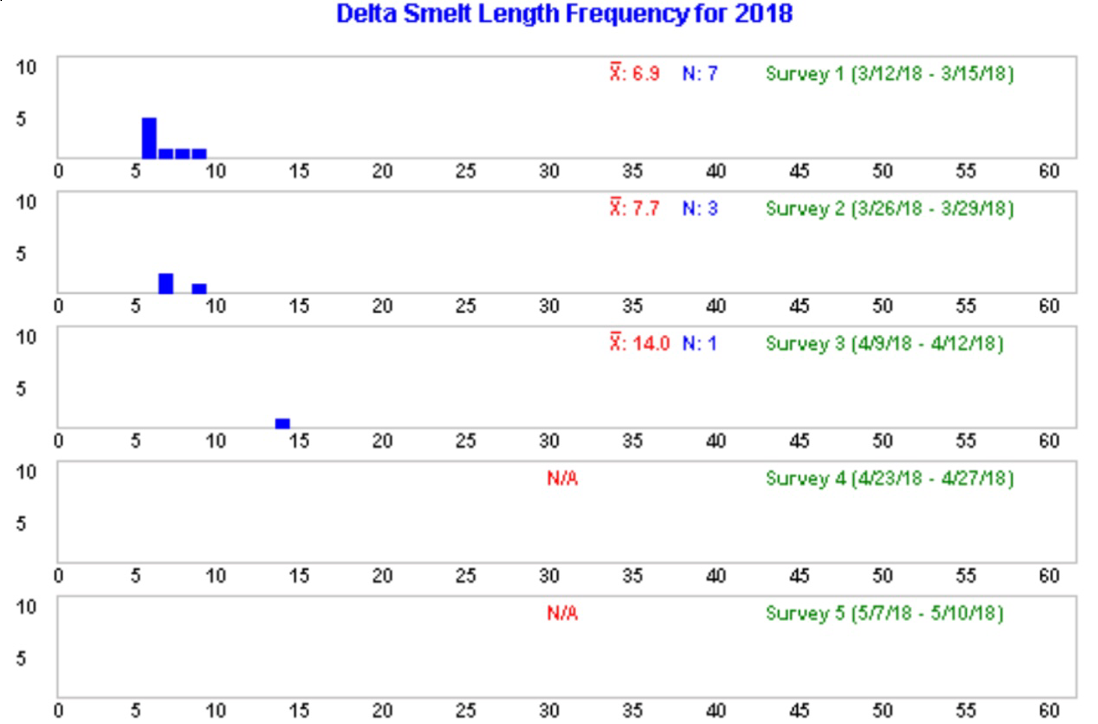
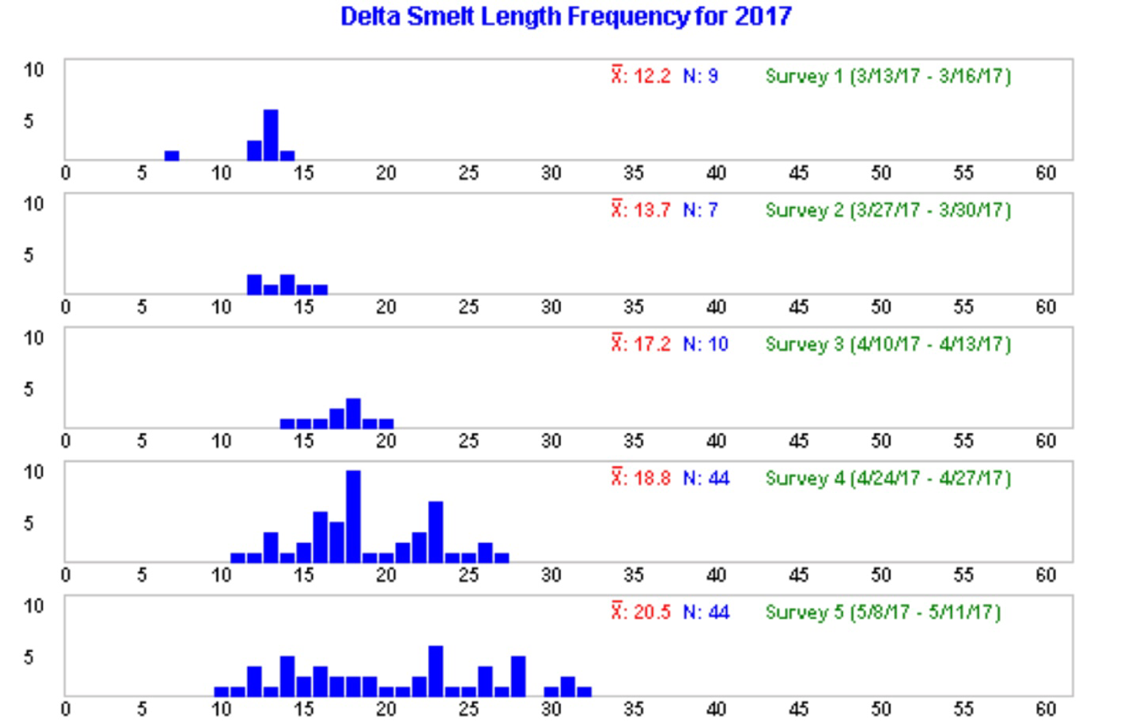
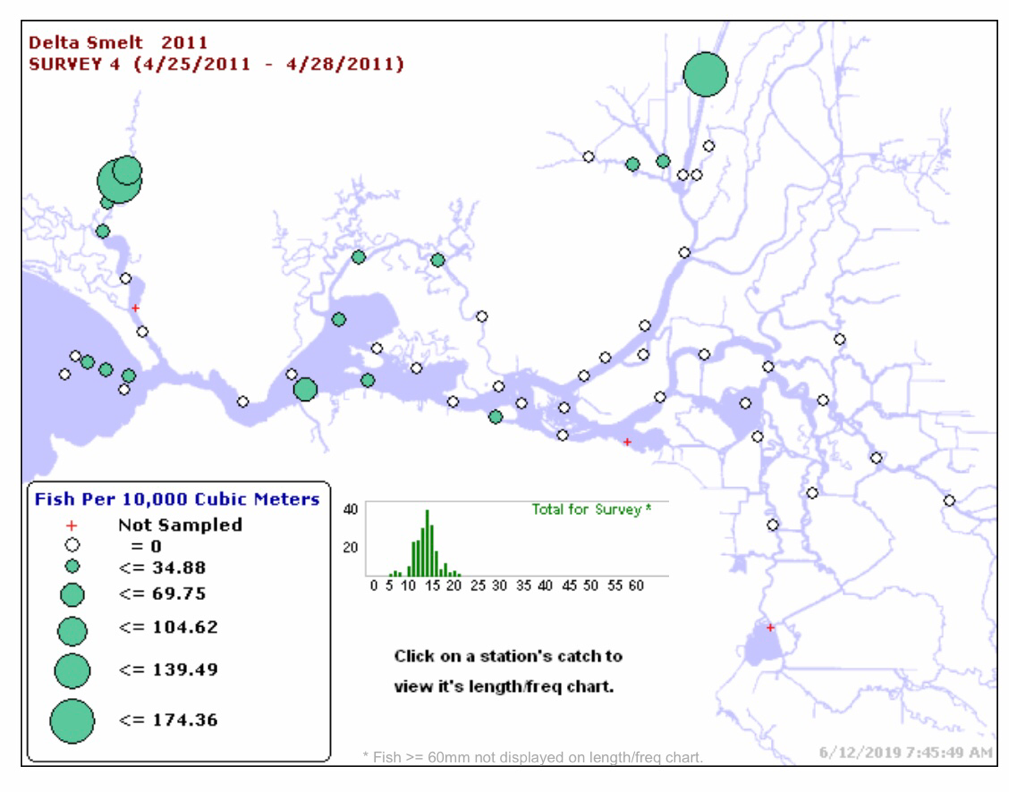
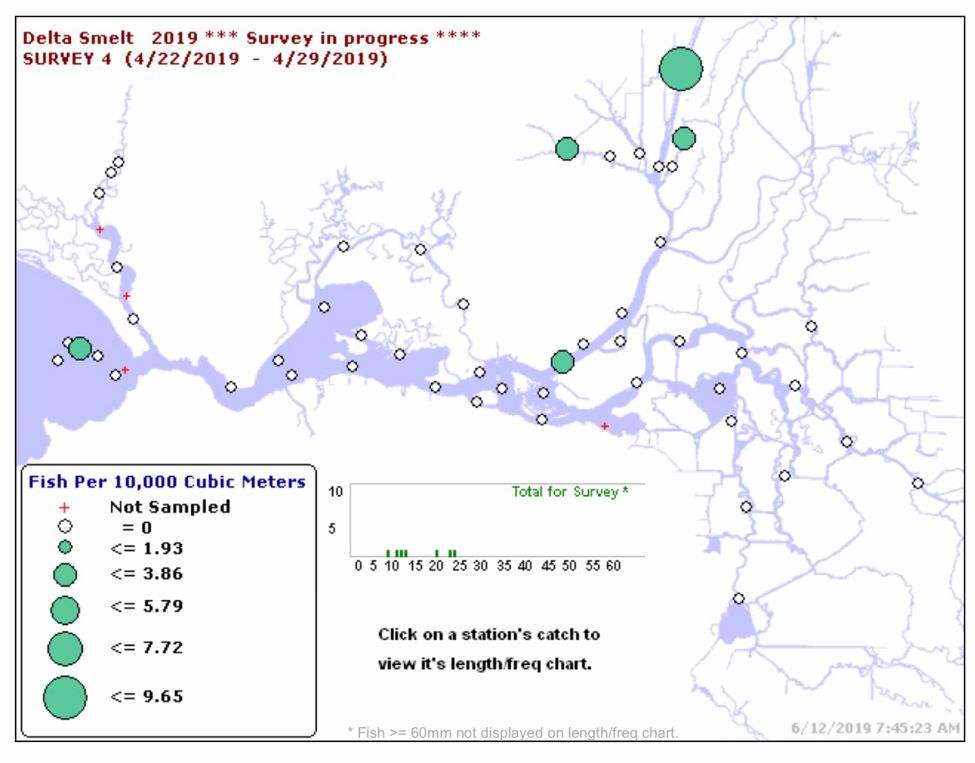
Personally, I want to see what the smelt science indicates that smelt are lacking in the Delta ecosystem. I want to see a description of how the USFWS/CDFW plan to restore Delta smelt. I want to see how the State Board plans to set new Delta water quality standards. I hope to see how Delta levees will be addressed. I want to know whether Delta flow barriers are being considered and what factors may affect that decision. I am interested in the future for Sandhill Cranes and the factors that may affect that future. And I want to know how each ecosystem component will address climate change.
In summary, I want to see a plan that includes a description of our understanding of each key Delta ecosystem component, what actions involving the Delta are being considered, and what decisions that might affect the Delta are being contemplated.