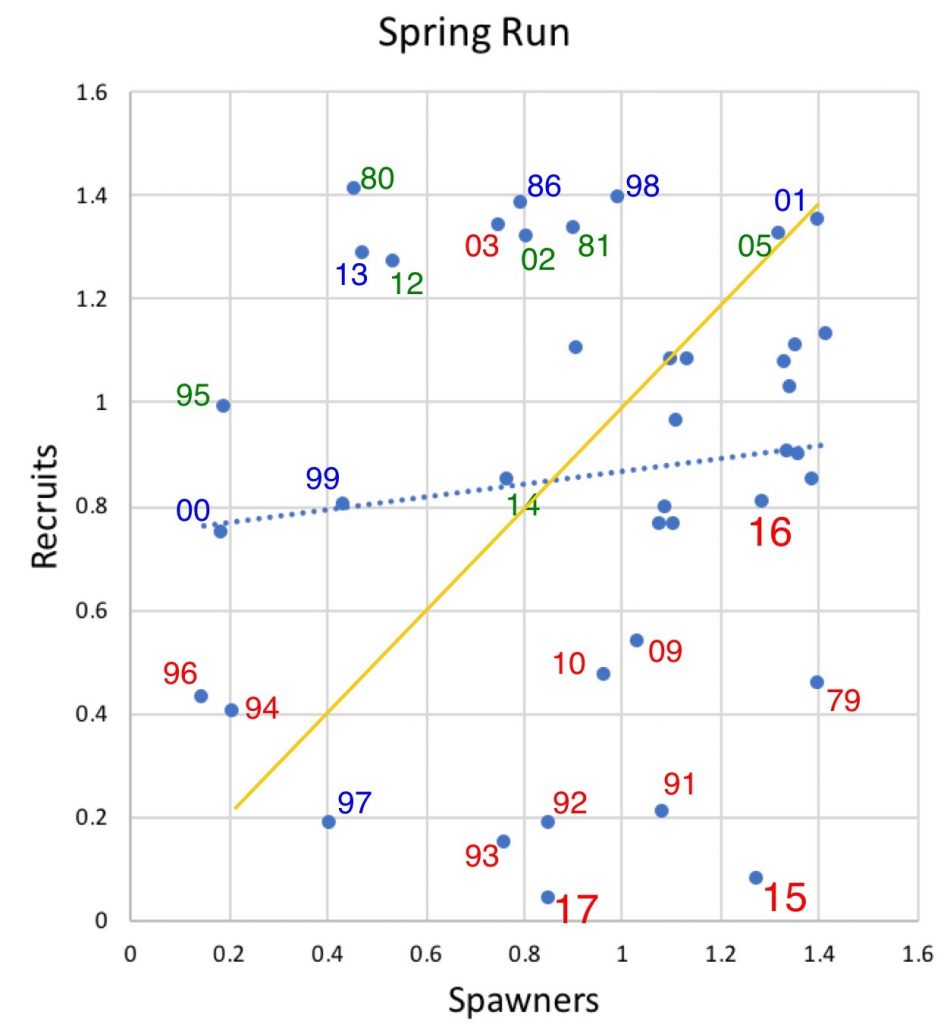
In a February 2018 post I last updated the status of longfin smelt in the Bay-Delta. I showed that longfin smelt have a strong spawner-recruit or stock-recruitment relationship wherein new recruits into the population depend on the abundance of spawning parents (Figure 1). The relationship also indicated a strong influence of water–year type.
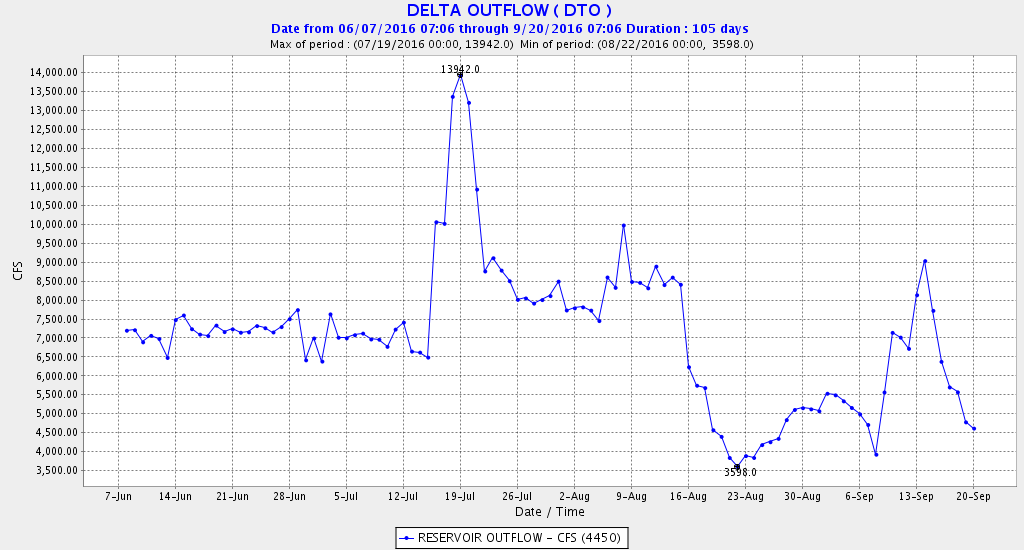
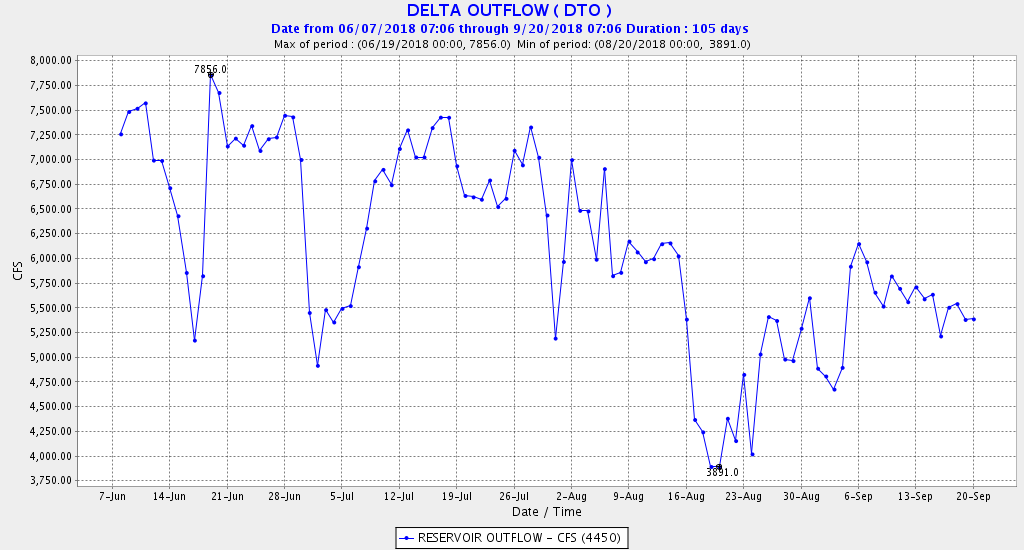
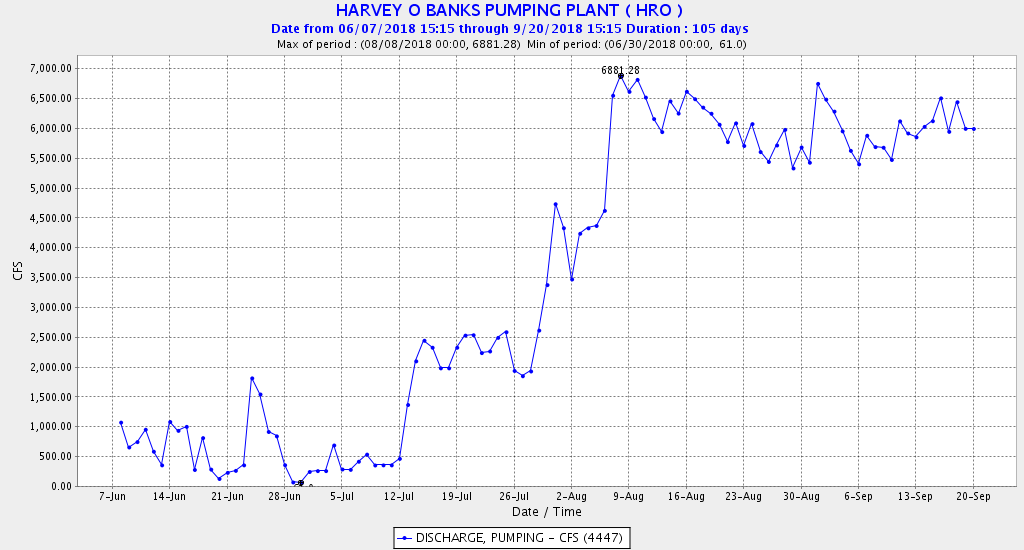
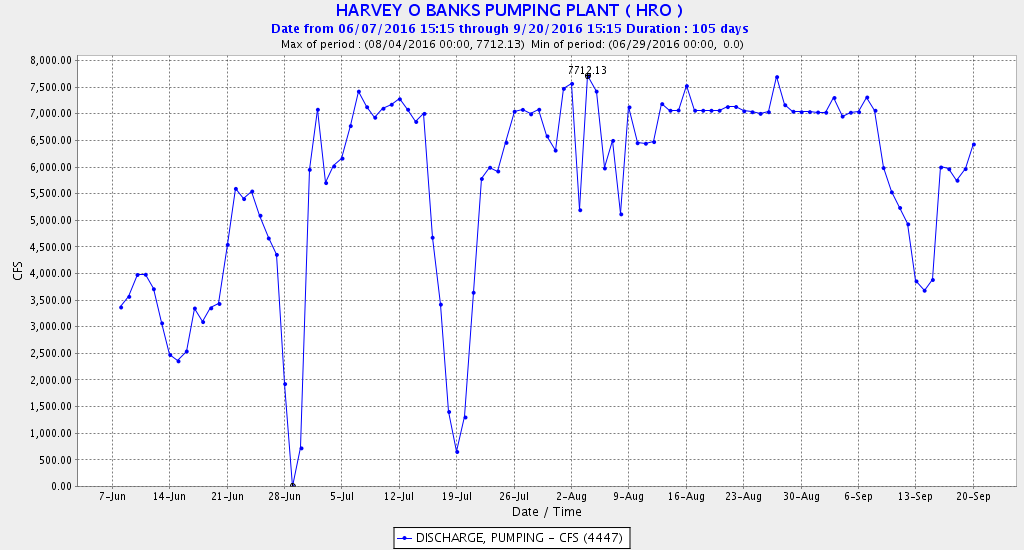
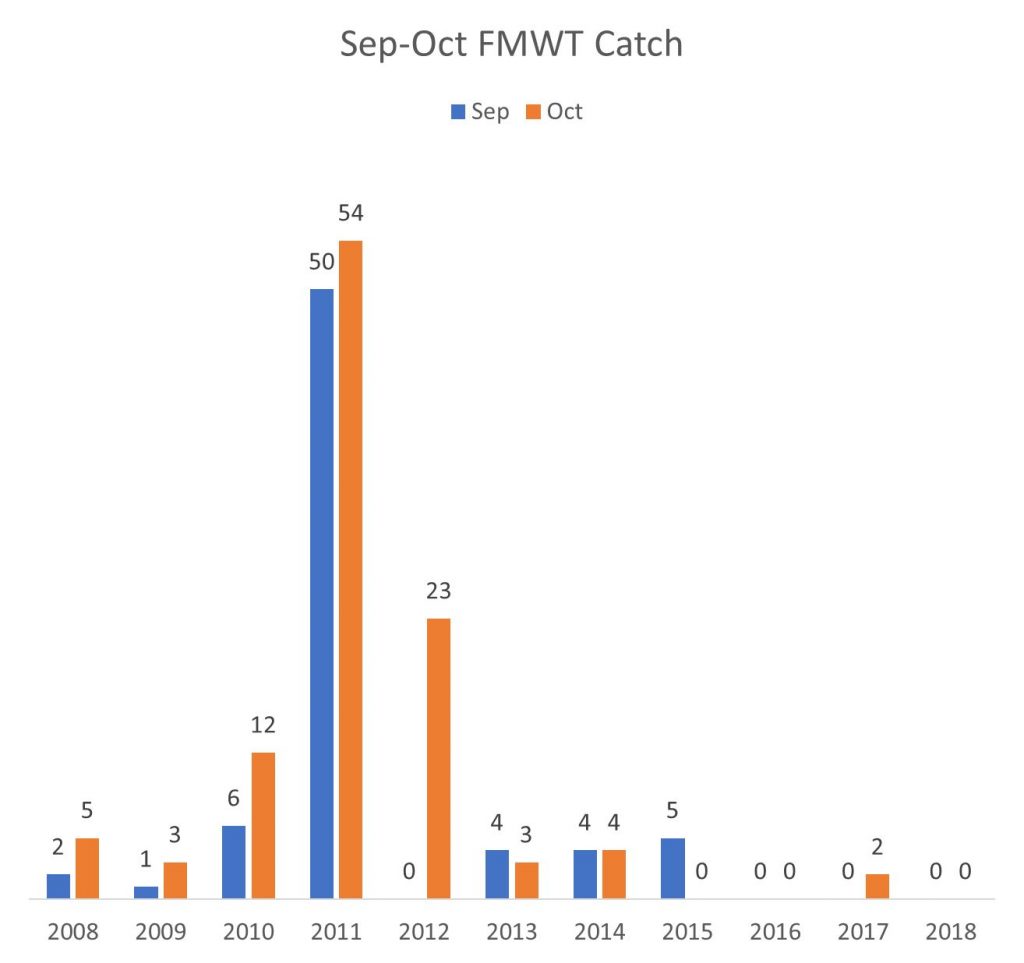
What is it in wetter years that improves survival? What is it about wet years that is important to longfin survival? My analysis is it is the spring Delta outflow, with June likely being important. The fall longfin index is significantly correlated with June outflow (Figure 2). It requires Delta outflows in the 8000-10,000 cfs range to keep the low salinity zone and young longfin in the Bay, west of the Delta and away from the south Delta export pumps and warm low-productivity pelagic habitats.
Present standards (see link, pdf pages 26-27) for June require outflow of 7100 cfs on a 30-day running average. This contrasts sharply with previous June standards under Water Rights Decision 1485 (see link, pdf page 43) which required an average monthly flow of 9500 cfs in some below normal years, 10,700 cfs in Above Normal years, and 14,000 cfs in Wet years. In its ongoing update of the Bay-Delta Plan, the State Water Resources Control Board must account for the importance of the outflow standard for June in protecting Bay-Delta ecological resources.
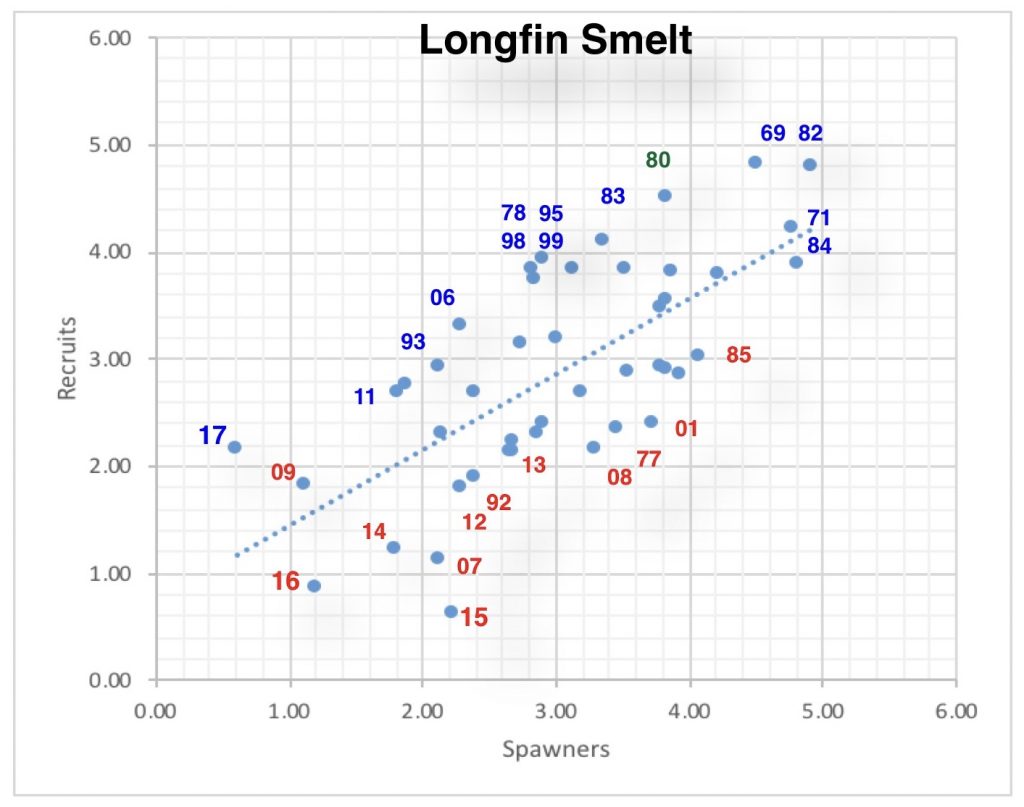
Figure 1. Longfin Recruits (Fall Midwater Trawl Index) vs Spawners (Index from two years prior) in Log10 scale. Wet years in blue. Dry years in red. Note the progressive decline in recruits in the last three wet years (06, 11, 17). The relationship is very strong and highly statistically significant. Taking into account Delta outflow in winter-spring makes the relationship even stronger. Recruits per spawner are dramatically lower in drier, low-outflow years (red years). Source: http://calsport.org/fisheriesblog/?p=1360.
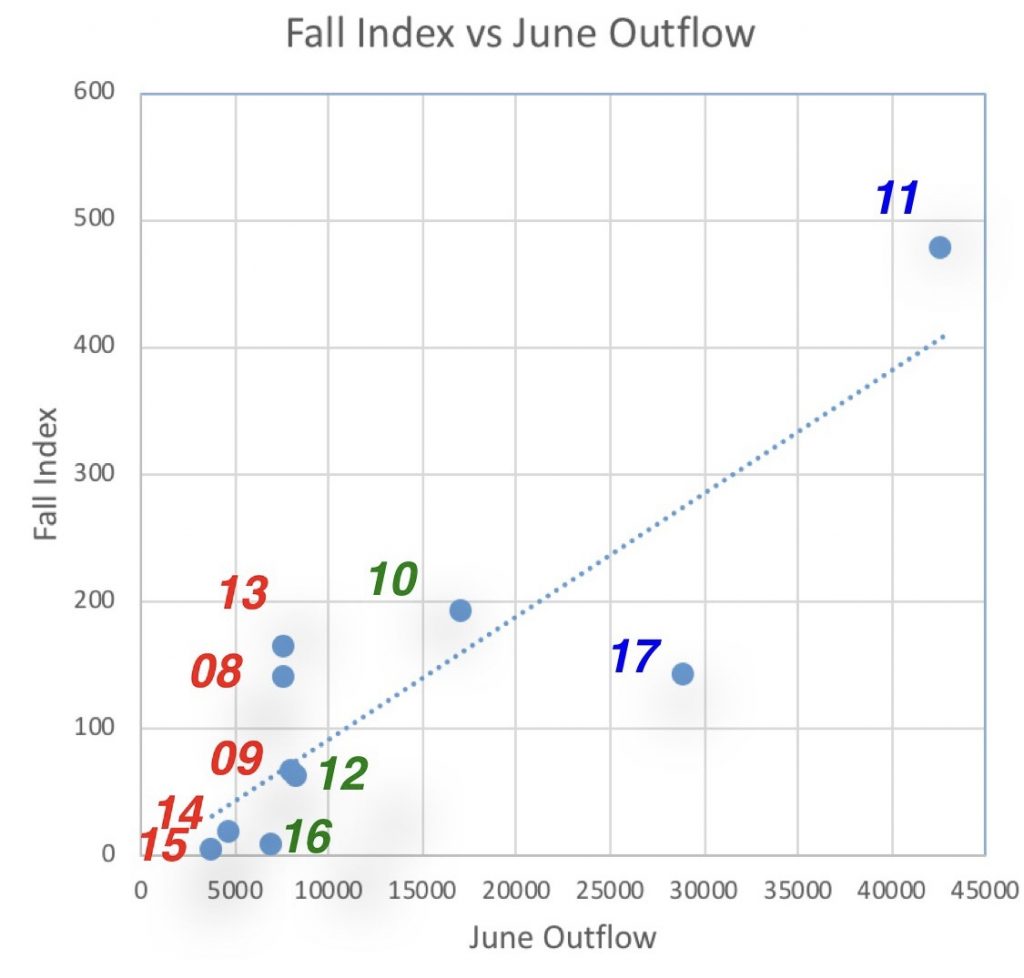
Figure 2. Fall midwater trawl index for longfin smelt versus average June outflow (cfs) 2008-2017. Wet years in blue. Normal years in green. Dry years in red. Source of data: http://www.dfg.ca.gov/delta/data/fmwt/indices.asp?view=single.