One never hears much about Delta zooplankton, the food of most of the pelagic fish including smelt, and also the food of shad, young striped bass, and even young salmon. Zooplankton are the heart of the Delta foodweb. For decades, surveys by CDFW and others have noted that zooplankton suffer in droughts, as do fish that feed upon them. I (and many others) have always believed that zooplankton were one of the key factors in Delta pelagic fish declines. Many science papers suggest shifts in species composition over decades and declining densities after clam invasions as being key factors in long term trends in zooplankton. Rarely are freshwater inflow/outflow or Delta exports offered as key factors in zooplankton trends.
The multi-decade Bay-Delta zooplankton survey database is large and complex, making analyses difficult and time-consuming. There are no indices to follow abundance patterns as there are for fish.
In this post, I provide some insights using a few specific comparisons of zooplankton densities between 2015, a drought year, and 2017, a wet year. I focus on spring and early summer, when zooplankton are perhaps at their greatest importance as fish food and when the difference between year-types is usually greatest.
Some example comparisons are presented in charts below. Figure 1 depicts the difference in May between 2015, a critically dry year, and 2017, a wet year, for Cladocera (commonly referred to as water fleas), a predominantly freshwater zooplankton and important pelagic fish prey. Figure 2 depicts differences between June 2015 and 2017 densities of Pseudodiaptomus, a key young smelt food. Figure 3 depicts differences for total copepod nauplii in July. In each figure, the location of the low salinity zone is referenced by the X2 factor.
My interpretation of all this is that zooplankton abundance and thus pelagic fish production are controlled by (1) flows through the Delta, (2) the location of the low salinity zone, and (3) south Delta exports. A much greater proportion of these key zooplankton populations are highly vulnerable to south Delta exports in drier years with low flows. Furthermore, the proposed WaterFix would exacerbate these conditions and contribute further to the decline of Bay-Delta fish, primarily by reducing spring flows in the northern Delta channels and shifting the low salinity zone eastward. WaterFix would be less ofa factor in summer as south Delta exports are likely to predominate.
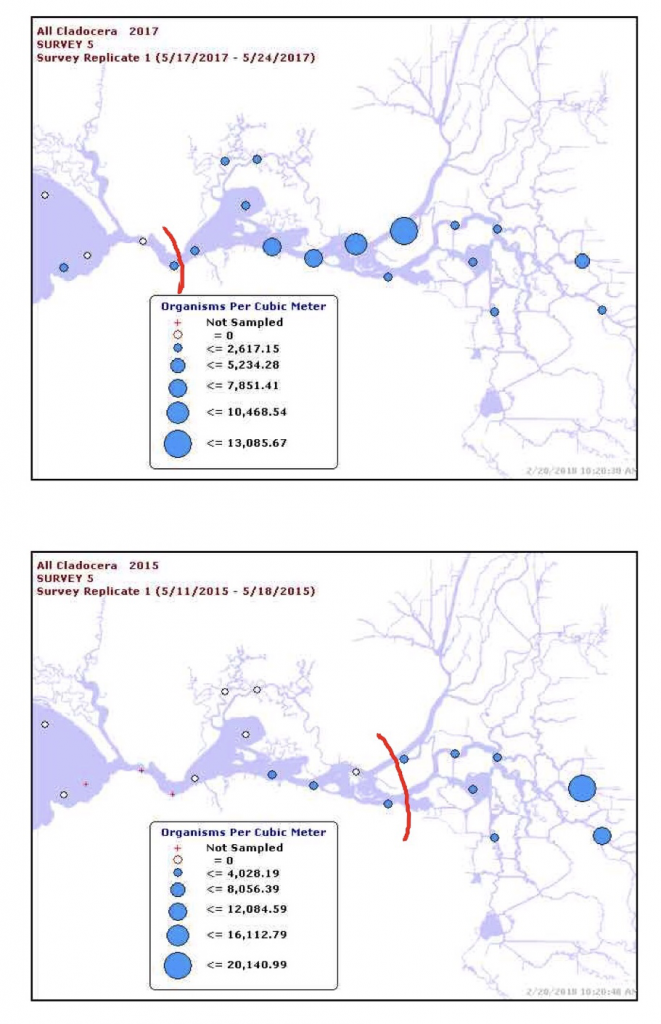
Figure 1. Comparison of Cladoceran densities in May plankton surveys in 2015 and 2017, critical dry year and wet years, respectively. Red line denotes X2 (~3800 EC) in center of low salinity zone. Note that cladocera distributed further downstream in wetter 2017.
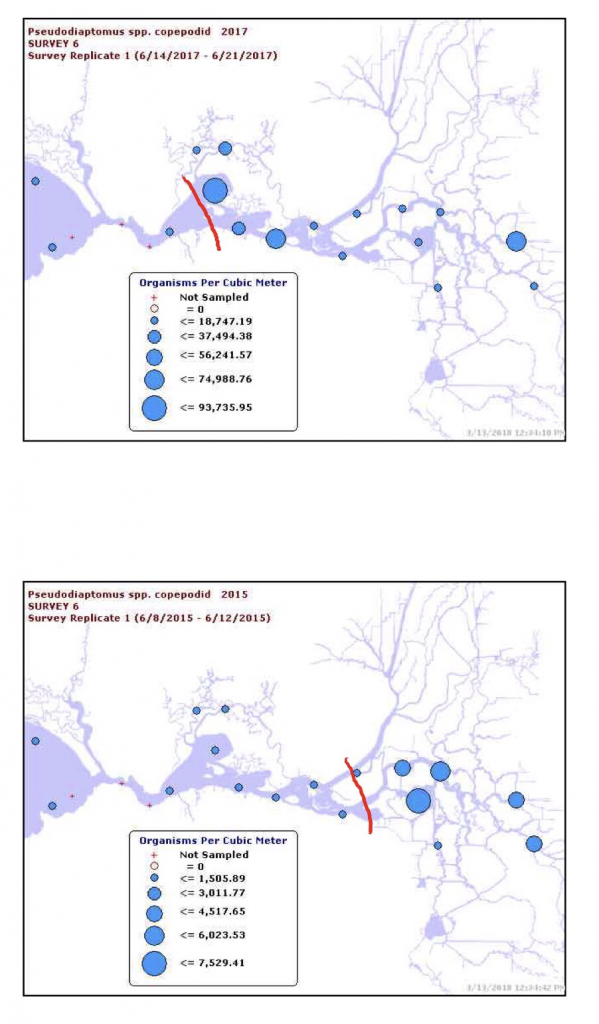
Figure 2. Comparison of Pseudodiaptomus copepodid densities in June plankton surveys in 2015 and 2017, critical dry year and wet years, respectively. Red line denotes X2 (~3800 EC) in center of low salinity zone. Note higher densities and distribution further downstream in wetter 2017.
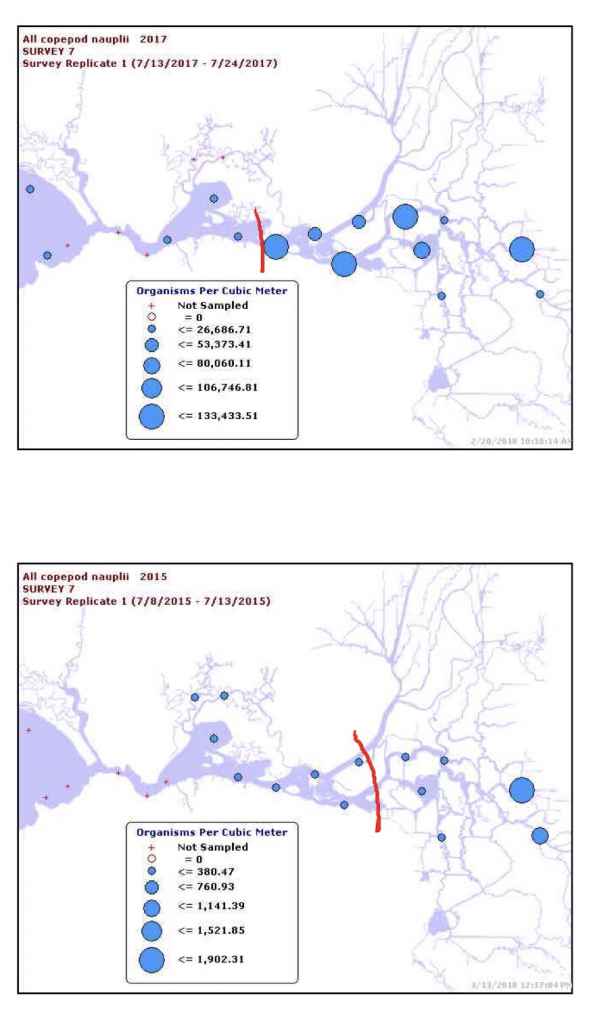
Figure 3. Comparison of copepod nauplii densities in July plankton surveys in 2015 and 2017, critical dry year and wet years, respectively. Red line denotes X2 (~3800 EC) in center of low salinity zone. Note higher densities and distribution further downstream in wetter 2017.