In the coming months and years, regulatory processes involving water rights, water quality, and endangered species will determine the future of Central Valley fishes.
To protect and enhance these fish populations, these processes will need to address four fundamental needs:
- River Flows
- River Water Temperatures
- Delta Outflow, Salinity, and Water Temperature
- Valley Flood Bypasses
In this post, I summarize a portion of the issues relating to River Flows: Summer Flows. Previous posts covered fall, winter, and spring flows.
Summer flows have long been neglected in water management and water quality standards. This absence is a major factor in the decline of salmon, steelhead, sturgeon, Delta smelt, and other Delta native fishes.
Summer River Flows
River flows in summer drive many natural ecological processes in the Central Valley related to reservoir tailwater spawning, egg incubation, and over-summer rearing in Valley rivers. Valley rim dam releases are prescribed to meet these needs as well as water supply demands. All four salmon runs, steelhead, Pacific lamprey, and white and green sturgeon are dependent on river flows in summer. Below Shasta Reservoir on the Sacramento River, flow is necessary to sustain (1) salmon eggs/embryos, fry, fingerlings, and smolts of winter-run salmon, (2) juvenile fall-run, spring-run, and late-fall-run salmon; (3) juvenile steelhead, and (4) newly hatched fry of green and white sturgeon. Below Oroville and Folsom reservoirs, flow is needed to sustain juvenile steelhead as well as numerous over-summering smolts and pre-spawn adults of both spring-run and fall-run salmon. The Sacramento and San Joaquin Basin Plan (Central Valley Basin Plan) prescribes water quality objectives to protect these beneficial uses. The applicable key water quality objectives are for water temperature and streamflow.
During the dry summer season, much of the Central Valley and Bay-Delta water supply and environmental needs depend on water releases from storage reservoirs. Reaches above the reservoirs and non-dammed streams depend on springs and snowmelt. Like spring-run salmon in un-dammed tributaries, spring-run adults downstream of rim dams, most notably on the Sacramento, Feather, and Yuba rivers, must hold over the summer awaiting their September-October spawning season. Winter-run salmon continue to spawn into August in the Sacramento River below Shasta; their progeny, and the progeny of those that spawned earlier in the summer, are sustained by cold-water dam releases as embryos in gravel beds.
Throughout the summer, winter-run fry move out of their redds downstream of Shasta. Water released from Shasta must be sufficient in amount and cold enough to sustain salmon eggs/embryos, fry, fingerlings, smolts, and over-summering and newly arriving adults, as well as young steelhead. Sufficient river flows are necessary in over 200 miles of the lower Sacramento River to keep water temperatures below lethal levels for salmon, trout, and sturgeon. Adult fall-run salmon, whose migration begins in summer, need cool water (<70°F) to commence their run from the Bay up the river.
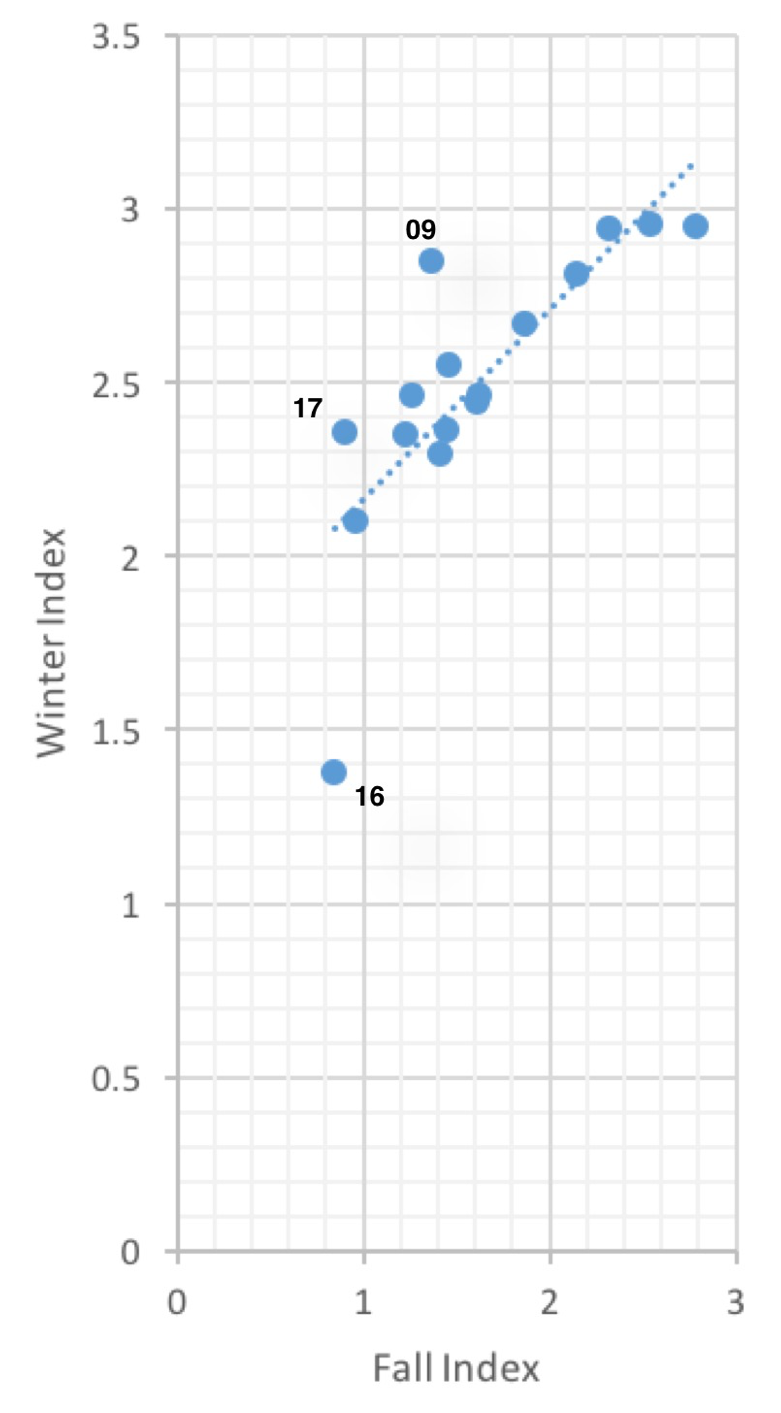
The Central Valley water quality plan’s limit of 68°F for the river is rarely enforced. Sacramento River flows of 6000-8000 cfs downstream of the major irrigation diversions are necessary to maintain the required water temperature, but these flows and are met only in wet years (Figure 1). The same holds true for the San Joaquin River, where low flows and high temperatures in late summer hinder that river’s salmon runs. Summer river flows into the Delta are also important in maintaining water temperatures within sustaining levels for Delta smelt (<73°F). Under low Delta inflows, not only is the smelt critical habitat warmer (Figure 2), but it is further upstream in the Delta, away from cooler Bay breezes. Further, during the summer, Delta water temperatures reach critical levels (>73°F) far more often under low Delta outflows (~5000 cfs) than moderate outflows (~10,000 cfs) (Figure 3).
In summary, river flows and water temperatures in summer are critical habitat needs. These needs require stronger summer flow standards and additional management attention to protect the salmon, steelhead, sturgeon, smelt and other species dependent on Central Valley and Bay-Delta habitats during summer portions of their life cycles.

Figure 1. River flow (cfs) in lower Sacramento River below major irrigation diversions in four recent years representing four water-year types. Green line represents minimum flow needed to maintain essential ecological processes in the lower river and Bay-Delta. Red line represents preferred minimum level protecting ecological processes. Summer flow is generally depressed even in wet years.
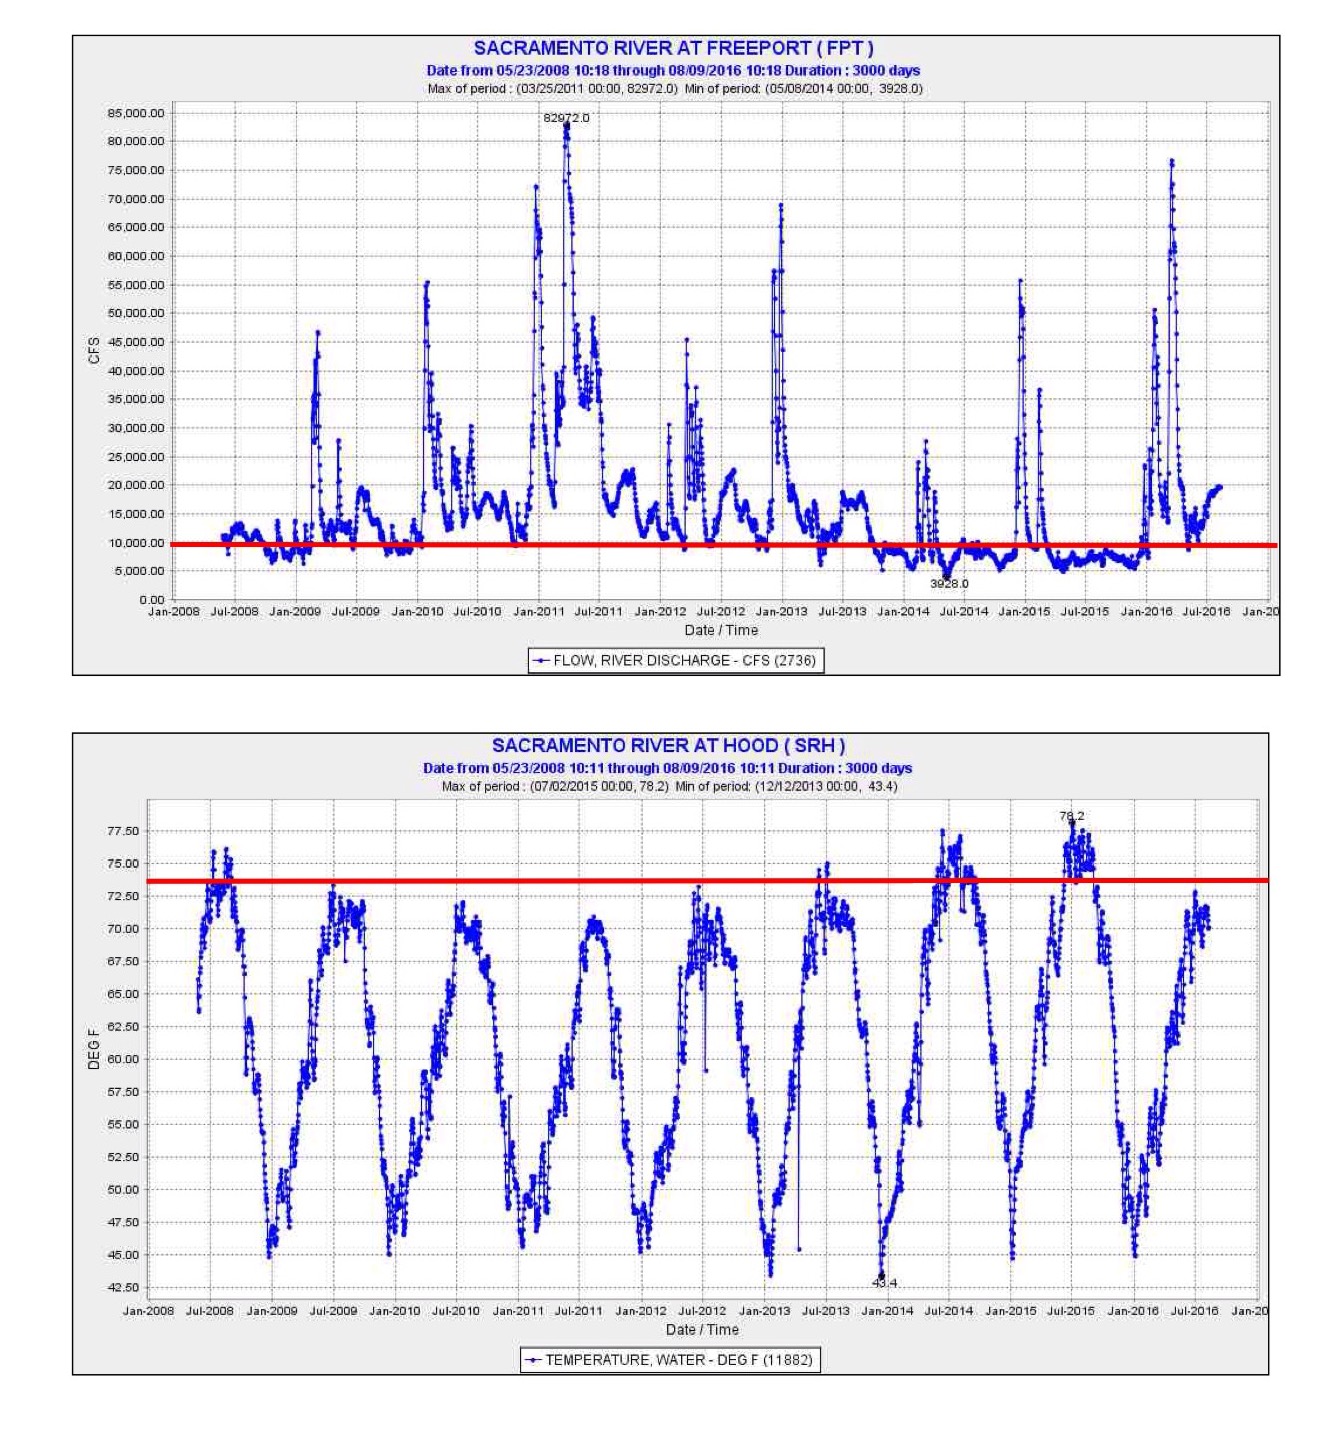
Figure 2. Water temperature in the north Delta channel of the Sacramento River 2008-2016. Red line denotes 73°F limit of sustainability for Delta smelt.
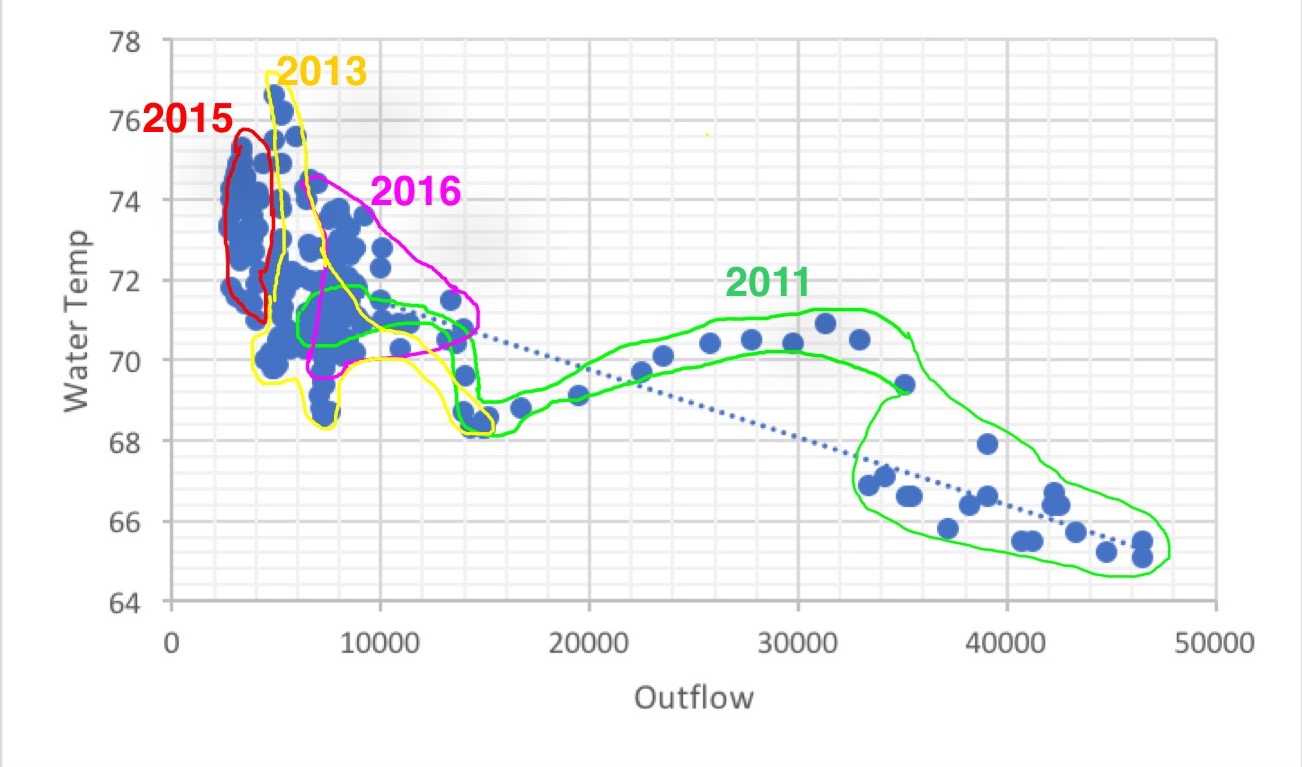
Figure 3. Delta outflow and water temperature (daily average) at Rio Vista in the north Delta channel of the Sacramento River in summer (mid-June to mid-August) of four recent years: critically dry years 2013 and 2015, below normal year 2016, and wet year 2011. Note that the daily averages are not independent from one another within years, and the effect of air temperature is not shown. Regardless, the effect of flow on water temperature, particularly in the readily controllable flow range of 5,000-15,000 cfs, appears significant among years. Source: CDEC.