This is an update on my last several posts on spring habitat conditions in the Bay-Delta in this Above Normal water year. After a wet winter-spring with good Delta and Bay conditions in Above Normal water year 2024, June 2024 water project operations returned the river, Delta, and Bay to drought-year conditions. I warned in late June that habitat conditions (flows and water temperatures) were getting bad and that a forecasted heat wave could make conditions even worse. It’s happened.
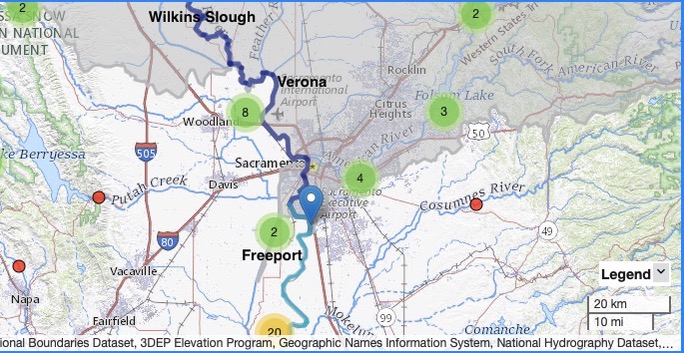
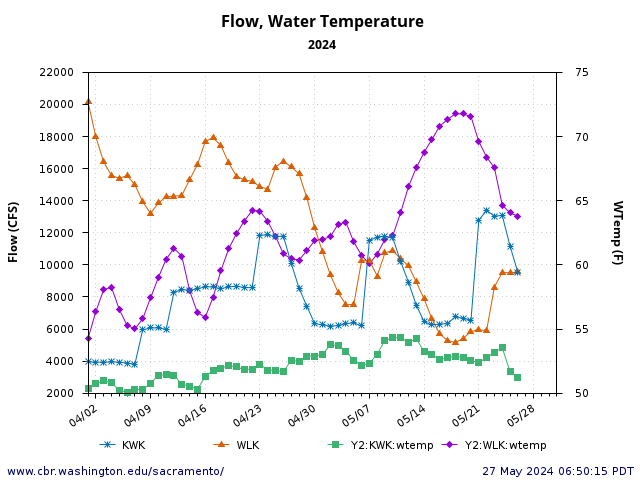
The State Water Project (SWP) and the Central Valley Project (CVP) started moving water south in earnest at the beginning of July. Shasta, Oroville, and Folsom reservoir releases increased, raising Delta inflow at Freeport to 20,000 cfs (Figure 1). SWP south Delta exports are at maximum at 6,000 cfs (Figure 2). CVP south Delta exports were already maxed out at 4,000 cfs. The Sacramento River contractors also removed their portion of the Shasta pie (6,000 cfs, Figure 3), to make the total water project haul from the Sacramento Valley 16,000+ cfs. Note this total does not include water diverted upstream of the Delta from Sacramento tributaries or from the San Joaquin River and its tributaries.
Impact to Freeport Water Temperature
On the positive side, the increased Delta inflow at Freeport dropped water temperatures slightly at Freeport as the heat wave commenced (Figure 4). I contend that the water temperature would have increased significantly with heat wave if the flow had not increased.
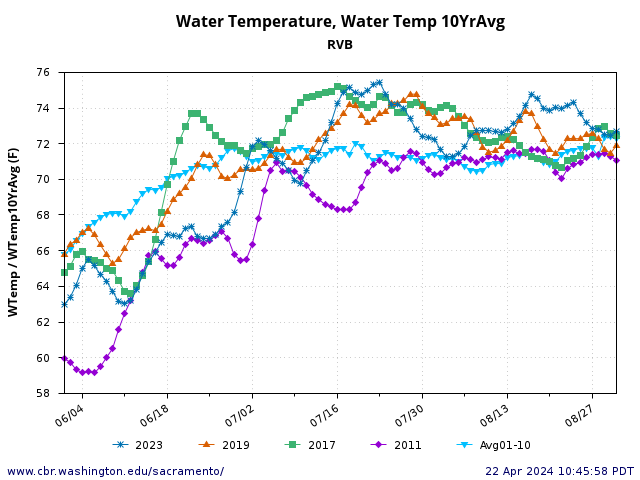
Impact to Rio Vista Water Temperature
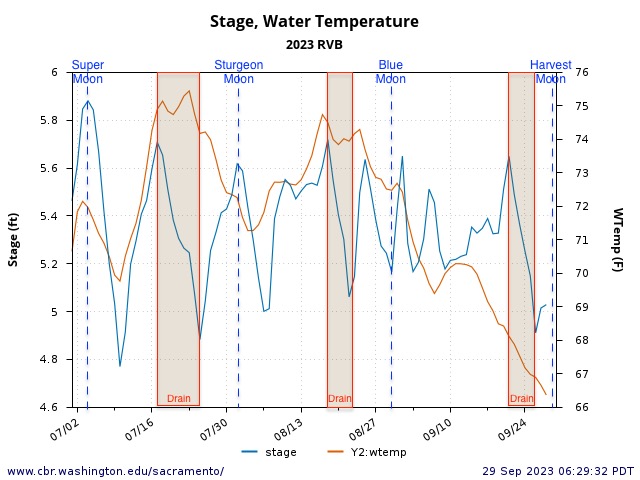
On the negative side, the main problem from the state action was increased water temperature at Rio Vista (to 75oF) due to the combination of higher south Delta exports, high air temperatures, and lower Delta outflow (Figure 5). I contend that slightly higher Delta inflows and lower south Delta exports (thus, higher Delta outflow and higher net Rio Vista flows) could have kept Rio Vista water temperatures closer to 72oF.
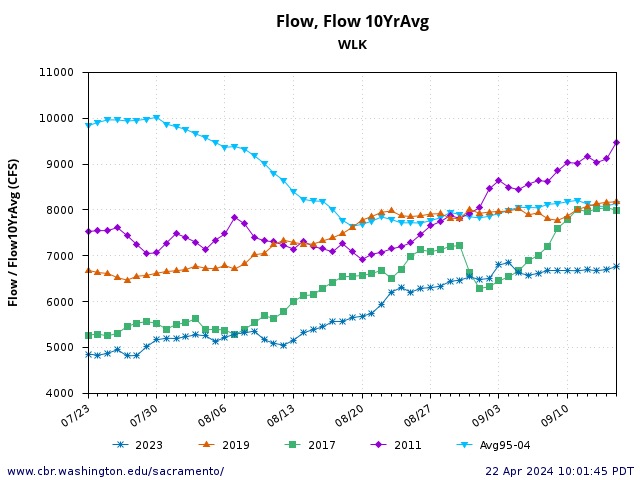
Impact to Lower Sacramento River Water Temperature
On the positive side, the increased flow in the lower Sacramento River from the Shasta Reservoir releases (see Figure 1) kept lower Sacramento River water temperatures from increasing during the heat wave (Figure 6). That experiment proved the potential benefit of such an action on its own
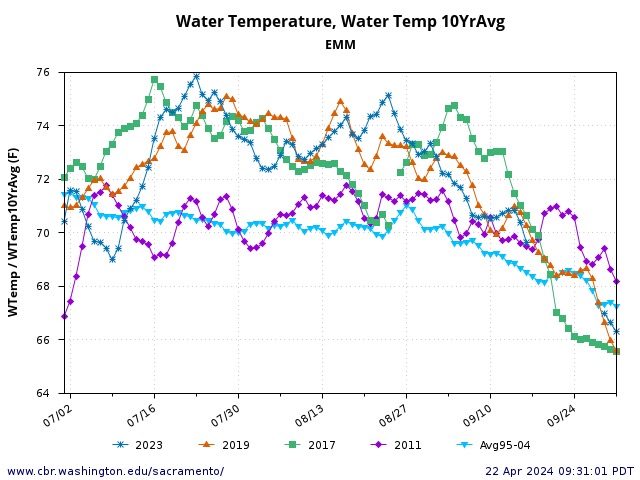
Impact to Bay Water Temperature
Bay water temperature during the early July heat wave also increased to 74-75oF during ebb tides, as warm Delta (Rio Vista) water entered the eastern Bay (Figures 7 and 8). On flood tides, cooler 68-70oF water returned to the eastern Bay. After several days of these conditions, the eastern Bay warmed by 2-3oF. I contend that if Delta outflow had not dropped to 8000 cfs with the higher south Delta exports, and the Delta (Rio Vista) had thus been maintained closer to 72oF, that Bay temperatures would have been several degrees cooler (likely less than 72oF).
Conclusion
The State Water Project should not have started full transfer of Sacramento Valley reservoir water to southern California via its south Delta export pumps during an early July heat wave. Such action compromised San Francisco Bay’s already-stressed environmental conditions, which could lead to fish die-offs in the Bay again this summer.
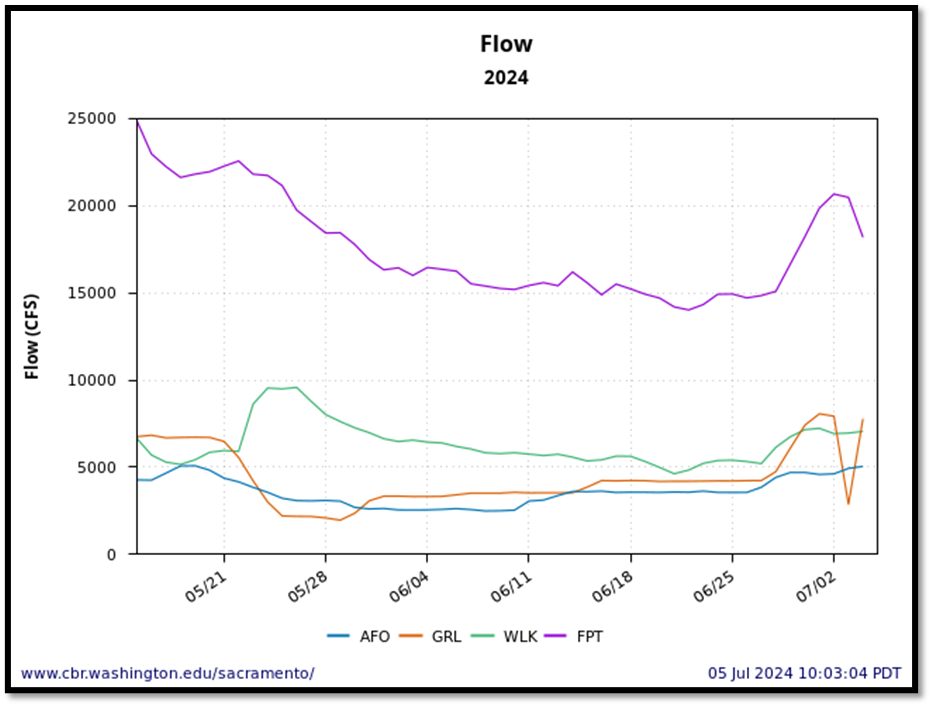
Figure 1. American (AFO), Feather (GRL), and Sacramento River (WLK) flows, making up Delta inflows at Freeport (FPT) May 15-July 5, 2024.
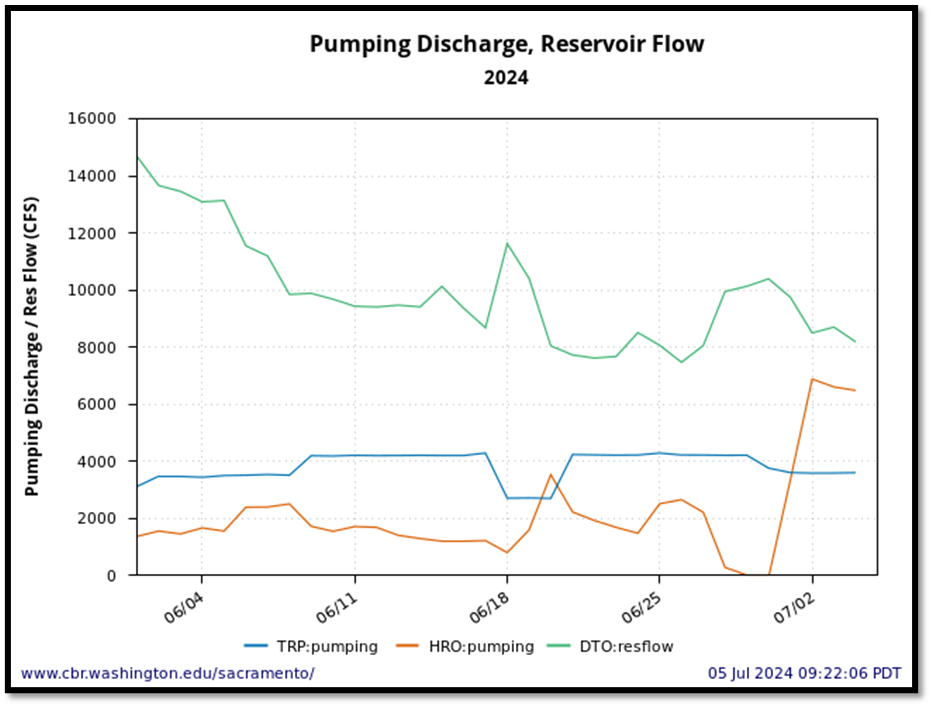
Figure 2. Delta outflow (DTO) and CVP’s Tracy (TRP) and SWP’s Harvey Banks (HRO) export rates 6/1-7/5, 2024.
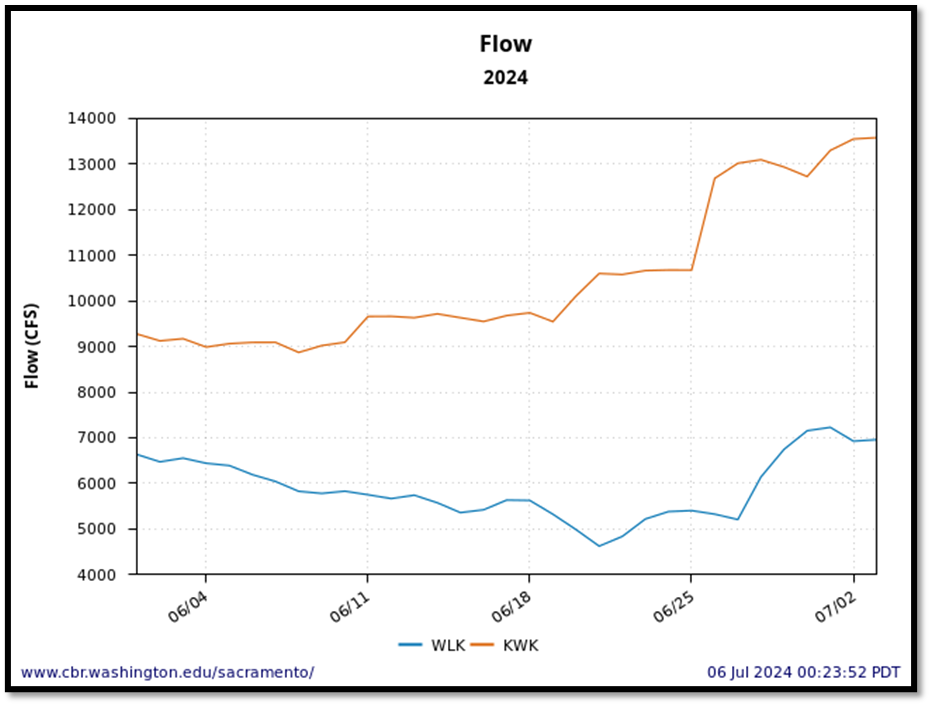
Figure 3. Sacramento River June 2024 streamflows at Keswick Dam (RM 300) and Wilkins Sough (RM 120) gages. Diversion loss equals difference plus above-Wilkins tributary inputs.
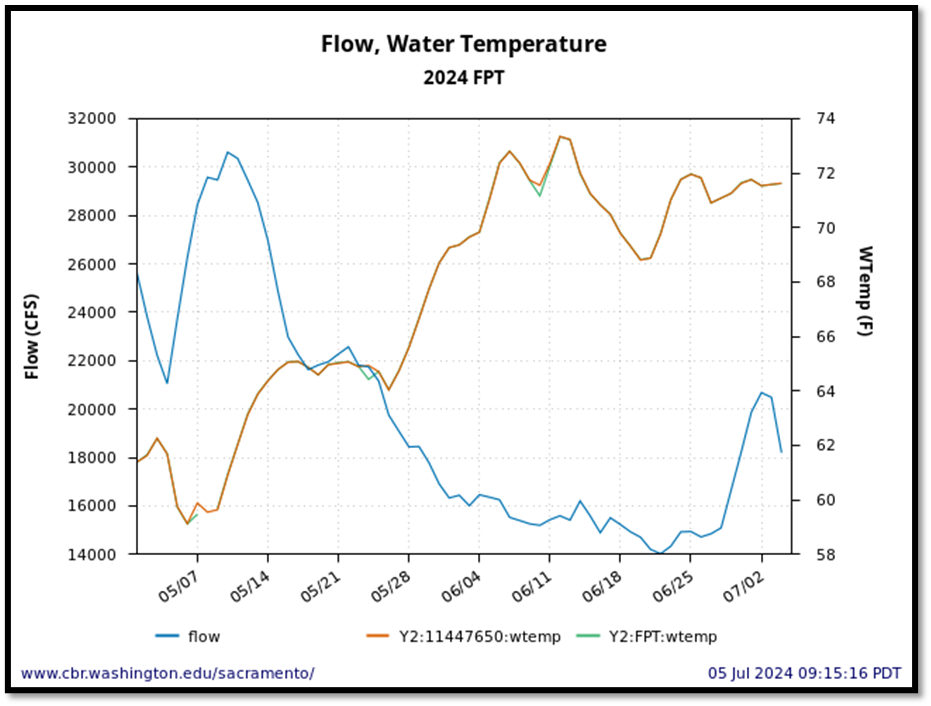
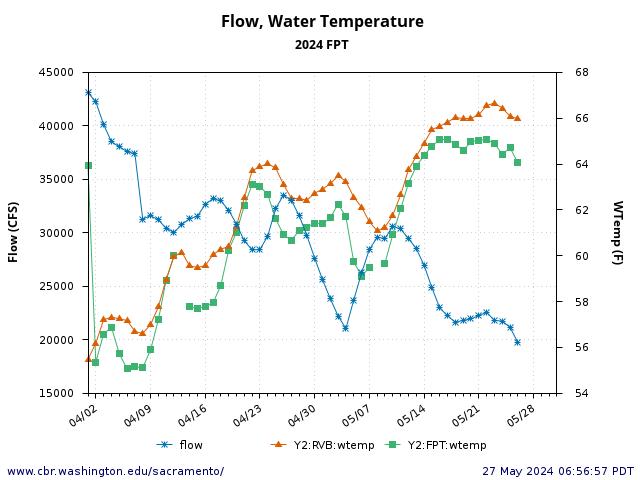
Figure 4. Sacramento River channel flow and water temperature at Freeport (FPT), 5/1-7/5 2024.
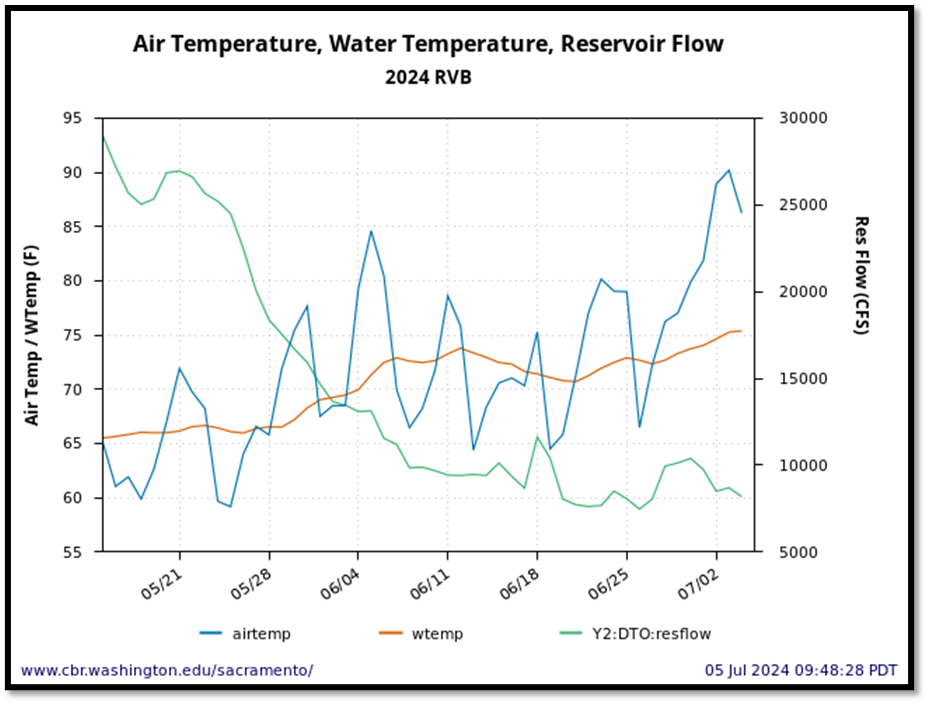
Figure 5. Water and air temperature at Rio Vista Bridge gage with Delta Outflow 5/15-7/5, 2024.
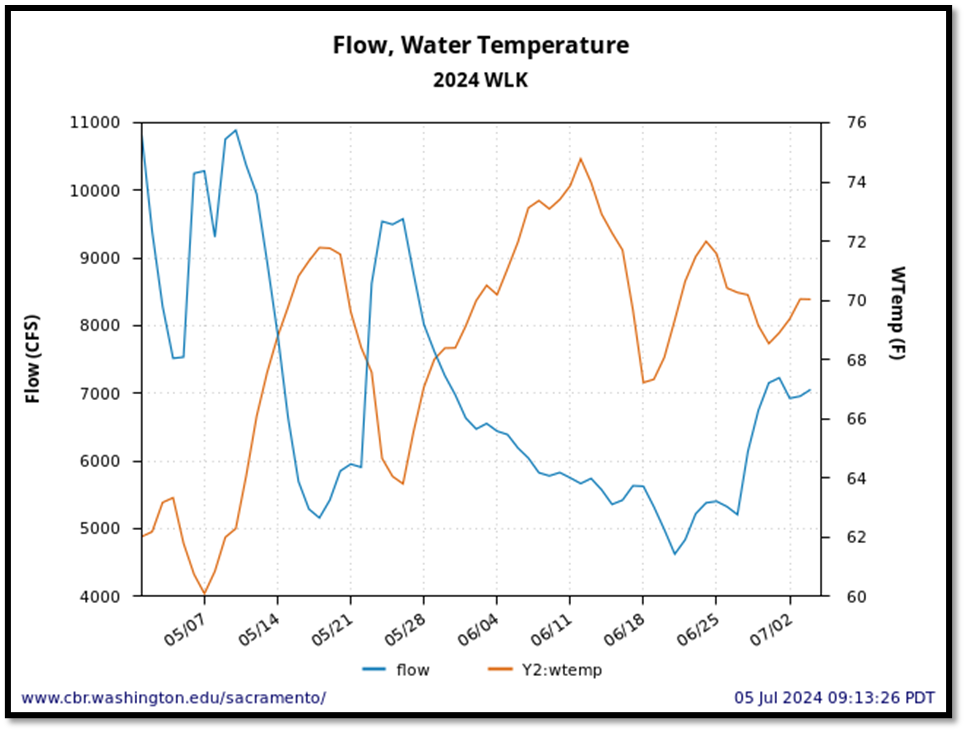
Figure 6. Sacramento River channel flow and water temperature at Wilkins Slough (WLK), 5/1-7/5 2024.
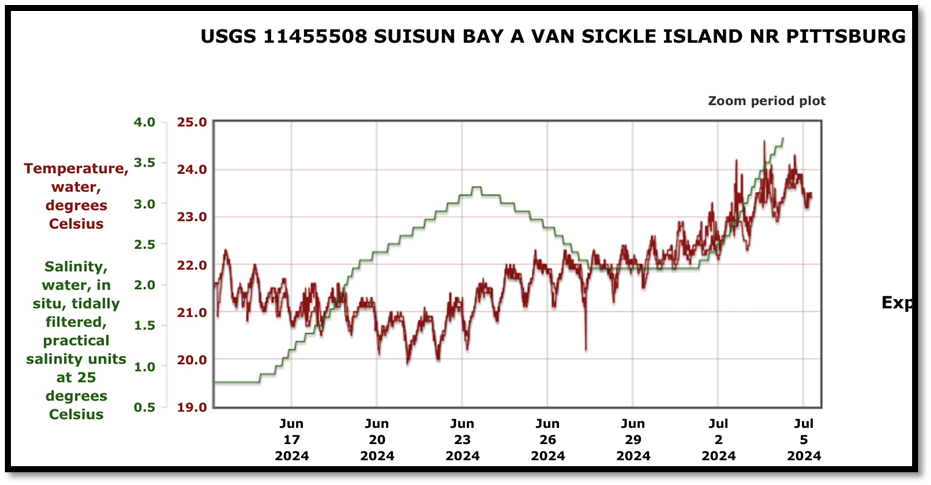
Figure 7. Tidally filtered salinity and water temperature in eastern Suisun Bay near Pittsburg, CA. 6/15-7/5, 2024.
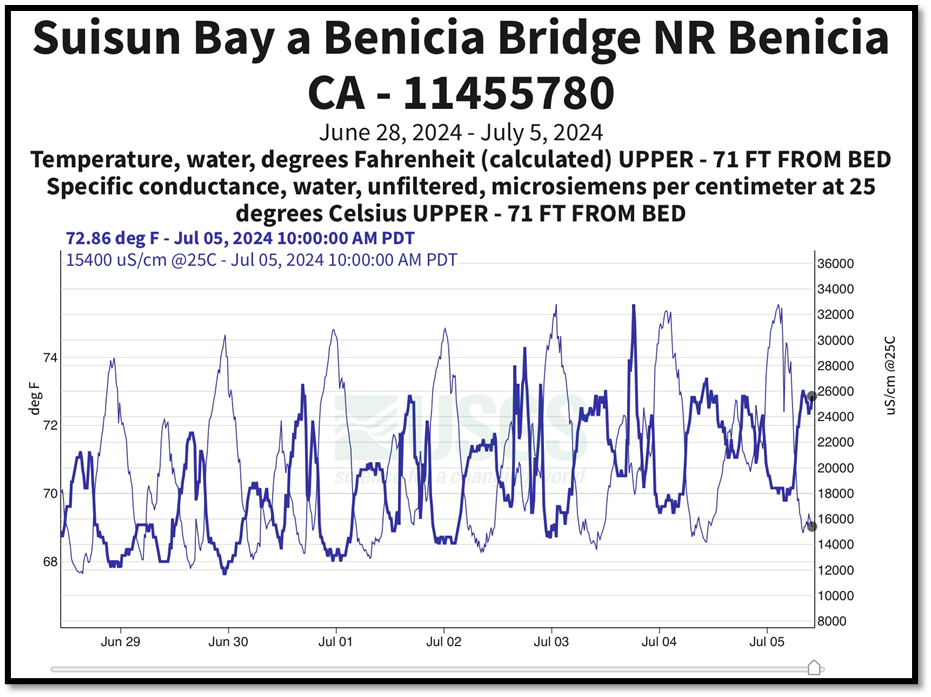
Figure 8. Salinity (EC) and water temperature in western Suisun Bay at Benicia Bridge near Benicia, CA. 6/28-7/5, 2024.