Sturgeon Moon August 2023

It is August 2023, and the month will feature two “Super Moons.” The first full moon is called a “Sturgeon Moon,” originally coined in reference to the ease of catching sturgeon in the Great Lakes during a full moon in summer.1 Its cycle began with the quarter moon and neap tide on July 24 until the full moon on August 1.2 This year’s Sturgeon Moon was regrettably prophetic in that it coincided with a new sturgeon die-off in San Francisco Bay in summer 2023.

Last summer, there was die-off of nearly a thousand adult white sturgeon in the greater San Francisco Bay due to a toxic algae bloom. More dead white sturgeon adults have been showing up on Bay beaches again this summer.3 After analyzing data related to the die-off, I now blame the white sturgeon die-off on the Sturgeon Moon (i.e., the tides) and some complicit factors.

Why are toxic algae blooms occurring, and sturgeon dying, again this year, in a wet flood year? Toxic blooms are not supposed to occur in wet years.

Based on the information available, this summer’s die-off event is occurring during a Sturgeon Moon. The Sturgeon Moon cycle (that occurred in late July and early August this year around the August 1 full moon) causes the Delta to rapidly fill from the Bay and stop flowing (termed a spring tide). In the recent heat, all that water in the Delta and lower rivers heated up to 75ºF. Then the Sturgeon Moon cycle drained (neap tide) the Delta into the Bay. When the top three feet or so of warm Delta water all drained into the Bay, it triggered the toxic algae bloom, low oxygen, and hot water. In combination, these factors are killing the fish.

Sturgeon likely suffered their initial stress from the warm lower rivers where they spawned in May. By the time of the Sturgeon Moon, many had moved downstream into the Delta toward the cooler Bay. The emptying of the warm Delta into the Bay during the neap tide likely stimulated further movement into the Bay. Once in the Bay, the stressed sturgeon received added stress from the warm Bay and its new toxic algae bloom and hypoxia conditions. The accumulated stress from the whole series of events likely caused the die-offs observed in the past two summers.

Yes, the Sturgeon Moon, Bay pollution, and algae seeds from last years bloom played a part, but the biggest culprits were state and federal water managers, who allowed the rivers and Delta to heat up in early summer by making high water deliveries upstream of the Delta and exporting high volumes of water from the Delta.

I worry about the accuracy of the loss estimates of adult white sturgeon in the Bay. As noted in the Chronicle article cited and linked above, there may be many dead sturgeon that have gone undetected at the bottom of the Bay. Last year, as many as 1000 sturgeon were found dead. There are probably less than 10,000 adult white sturgeon left in the Bay-Delta spawning population. Sport fishermen generally harvest about a thousand each year. The California Department of Fish and Wildlife and the California Fish and Game Commission are revisiting fishing regulations this fall and may close or restrict the popular sport fishery. 4

Could these circumstances have been avoided? Yes. First by maintaining lower Sacramento River and Delta inflow temperatures (Figure 1) at or below the state water quality standard of 68ºF (20ºC) with adequate flows (greater dam releases and/or less water deliveries). The lower Sacramento River flow of 5000 cfs is far too low for early summer, especially in a wet year. Second, by maintaining Delta temperatures at least in the 20-22ºC range (there is no Delta water temperature standard) with adequate cool inflows. Third, by maintaining water temperatures in Bay below 20ºC with adequate cool Delta outflow during the spring tides. This solution would have been difficult to achieve in drought year 2022, but not in flood year 2023.

Water project managers should have foreseen the tidal patterns coming in the summer (Figure 2) and the inadequacy of the estimated flows they were providing to the Delta (Figure 3). Measured Delta outflow by USGS was actually lower than the DWR model predictions (Figure 4). Instead, water managers provided approximately 20,000 cfs of water deliveries, including near-maximum export pumping from the Delta (Figure 5). The upstream pull to the south Delta export pumps reached a peak near 10,000 cfs in interior Delta channels at the end of July (Figure 6).

The influx of warm water reached a peak at the maximum ebb tide on July 24. This can be seen in Figure 7 at the Carquinez Bridge gage, and Figure 8 in Suisun Bay. Evidence of the Bay bloom can be seen in Figure 9, as the North Bay water returned to the East Bay with its algae (chlorophyll) concentrations and low dissolved oxygen at the end of July, coinciding with the return of the spring tide. Further evidence of the bloom is indicated in Figure 10 in the low nitrogen concentrations at the end of July in Suisun Bay.

In summary, the recent reappearance of a die-off of white sturgeon in the Bay appears to have been triggered by the strong tides of the summer Sturgeon Moon draining warm water from the Delta into the Bay. The warm water, in turn, was the result of excessive water diversions upstream of the Delta and near-maximum water exports from the Delta, combined with tidal dynamics.
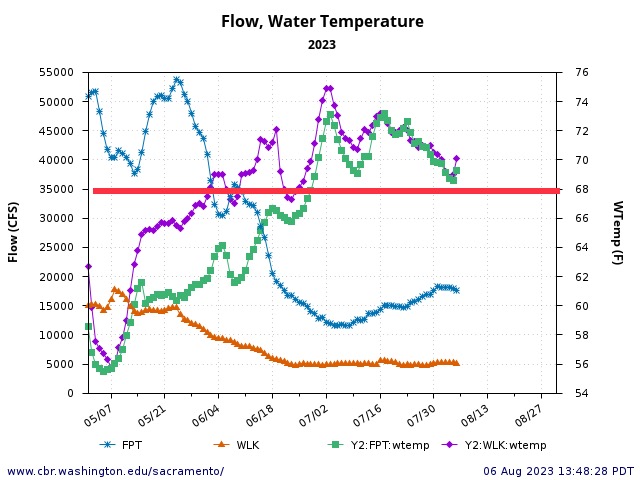
Graph showing flow and water temperature in the lower Sacramento River upstream of the Delta at Wilkins Slough (WLK) and at the entrance to the tidal Delta at Freeport (FPT). Red line is water quality standard for lower Sacramento River.
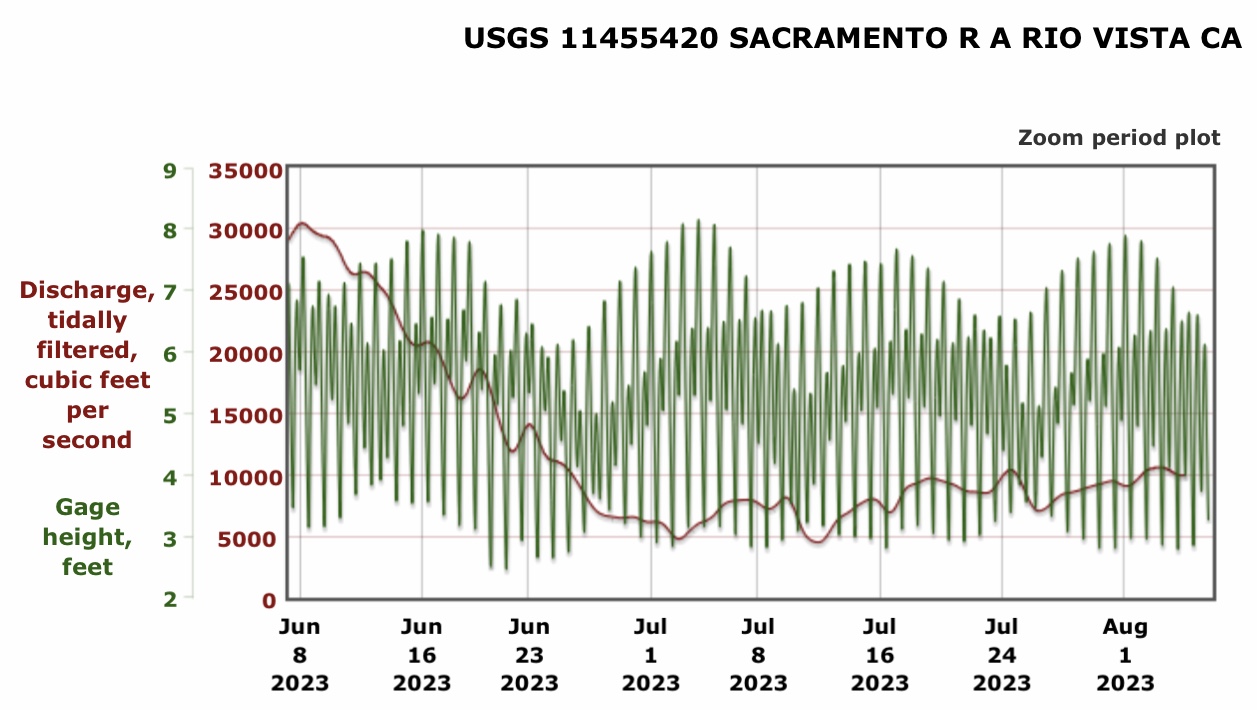
Figure 1. Flow and water temperature in the lower Sacramento River upstream of the Delta at Wilkins Slough (WLK) and at the entrance to the tidal Delta at Freeport (FPT). Red line is water quality standard for lower Sacramento River.

Graph showing Average daily flow and hourly stage at Rio Vista in North Delta near exit to the Bay.

Figure 2. Average daily flow and hourly stage at Rio Vista in North Delta near exit to the Bay. Note the sharp flow increase and the drop in stage on 7/24 (Delta draining under the neap tide of the initial quarter of the Sturgeon Moon.)
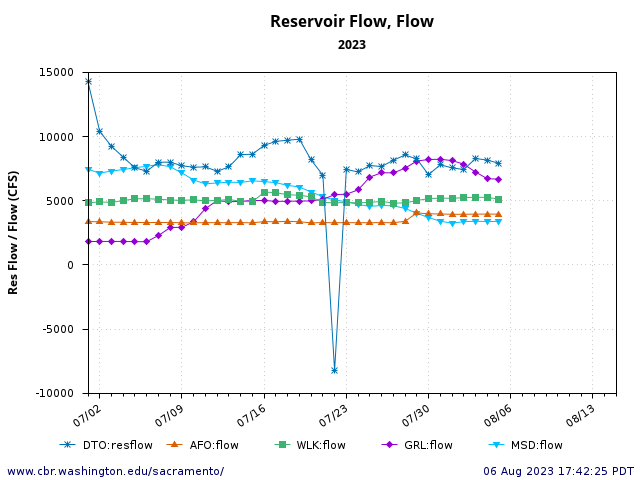
Graph showing Stable Delta conditions in July 2023. Inflows = (American River AFO + Lower Sacramento River at Wilkins Slough WLK + lower Feather River at Gridley GRL + lower San Joaquin river at Mossdale MSD. Outflow (DWR-DTO) = Inflow – exports. Note relatively stable conditions.

Figure 3. Stable Delta conditions in July 2023. Inflows = (American River AFO + Lower Sacramento River at Wilkins Slough WLK + lower Feather River at Gridley GRL + lower San Joaquin river at Mossdale MSD. Outflow (DWR-DTO) = Inflow – exports. Note relatively stable conditions. Note DWR outflow is calculated (not measured) from daily flows.
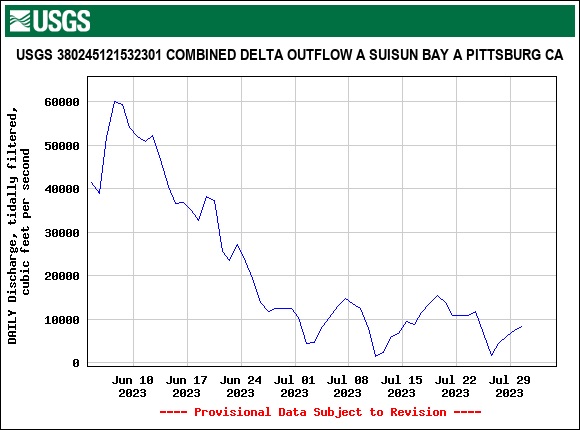
Graph showing Delta outflow as estimated by USGS from flow gages.

Figure 4. Delta outflow as estimated by USGS from flow gages. Note drop in Delta outflow (at the peaks in spring tides) beginning on 7/24 as shown in Figure 2, but not in Figure 3. Also note the peak outflows were higher in USGS outflows.
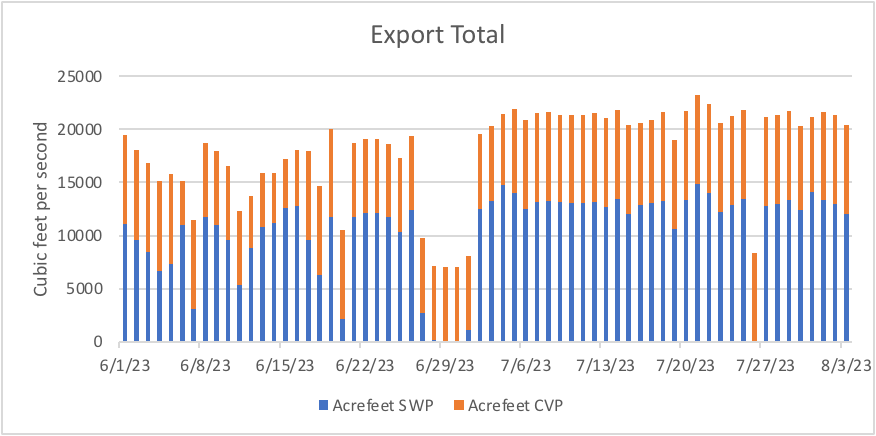
Graph showing South Delta SWP and CVP exports June-July 2023.

Figure 5. South Delta SWP and CVP exports June-July 2023. Note 20,000 acre-ft per day is approximately hourly average of 10,000 cfs. Maximum export rate is 11,400 cfs (approximately 23,000 acre-ft per day).
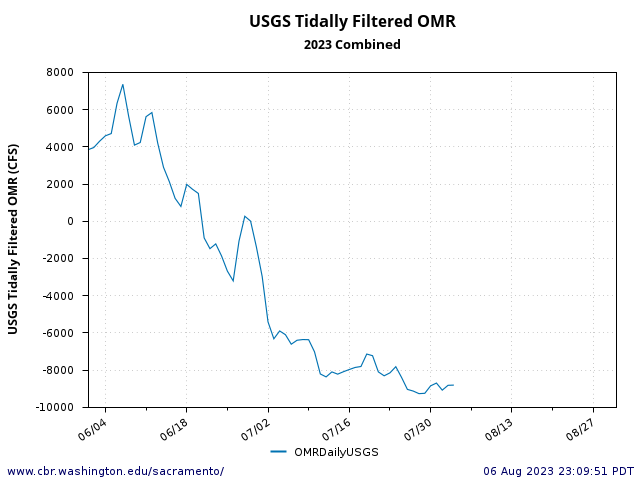
Graph showing Old and Middle River flows toward export pumps in south Delta.
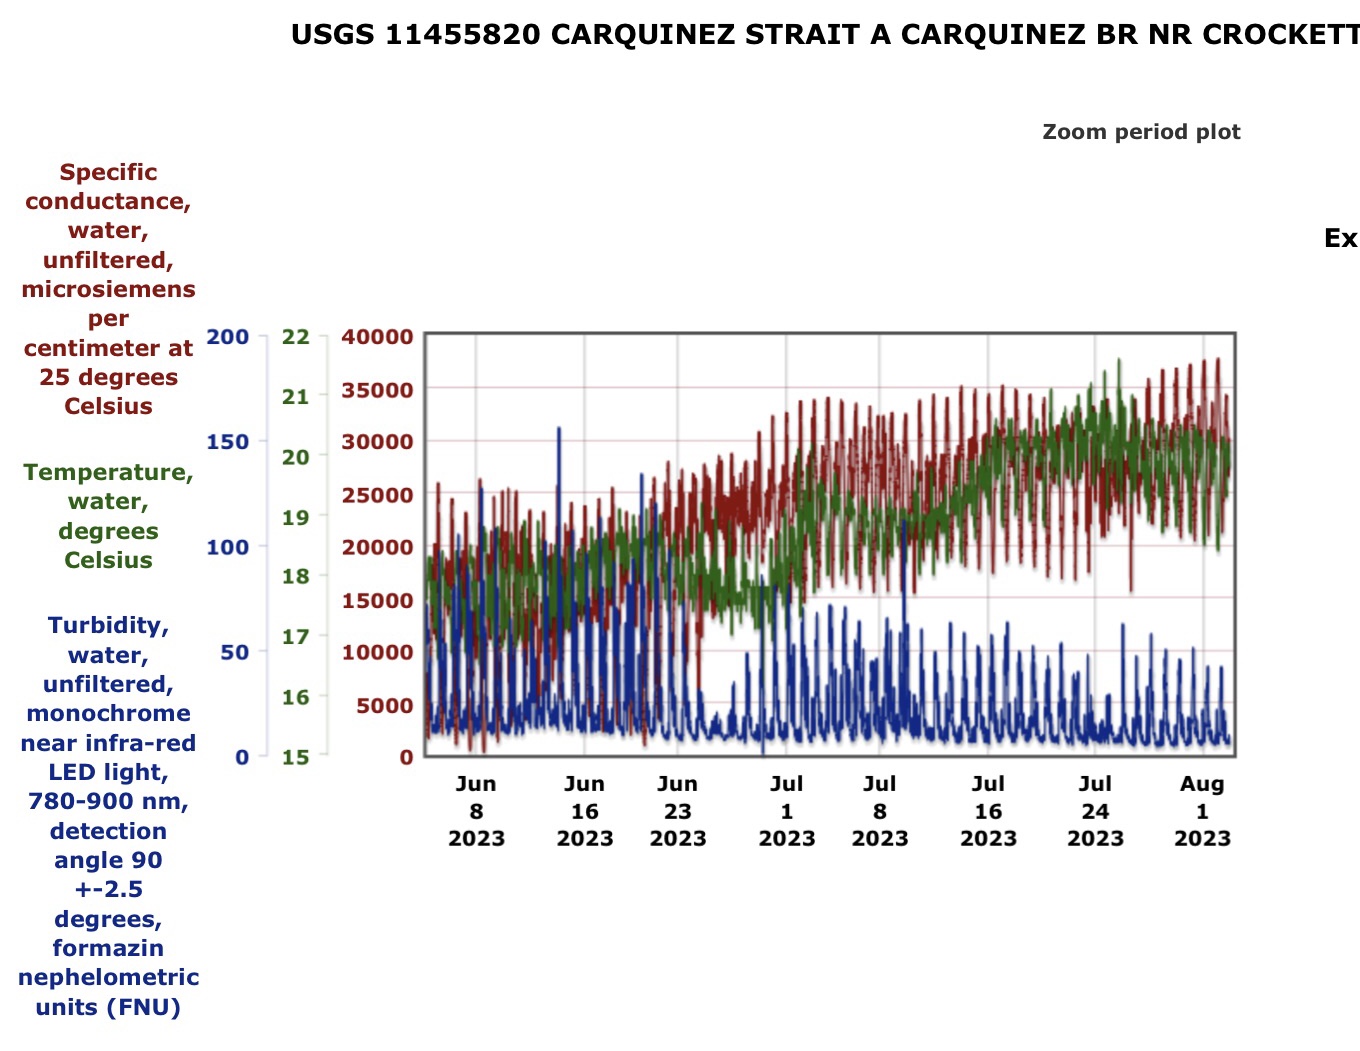
Figure 6. Old and Middle River flows toward export pumps in south Delta.

Graph showing Salinity (EC), water temperature (C), and turbidity at Crockett in north Bay in June-July 2023.

Figure 7. Salinity (EC), water temperature (C), and turbidity at Crockett in north Bay in June-July 2023. Note neap tide and lower salinity, warm, clear water on 7/24-25.
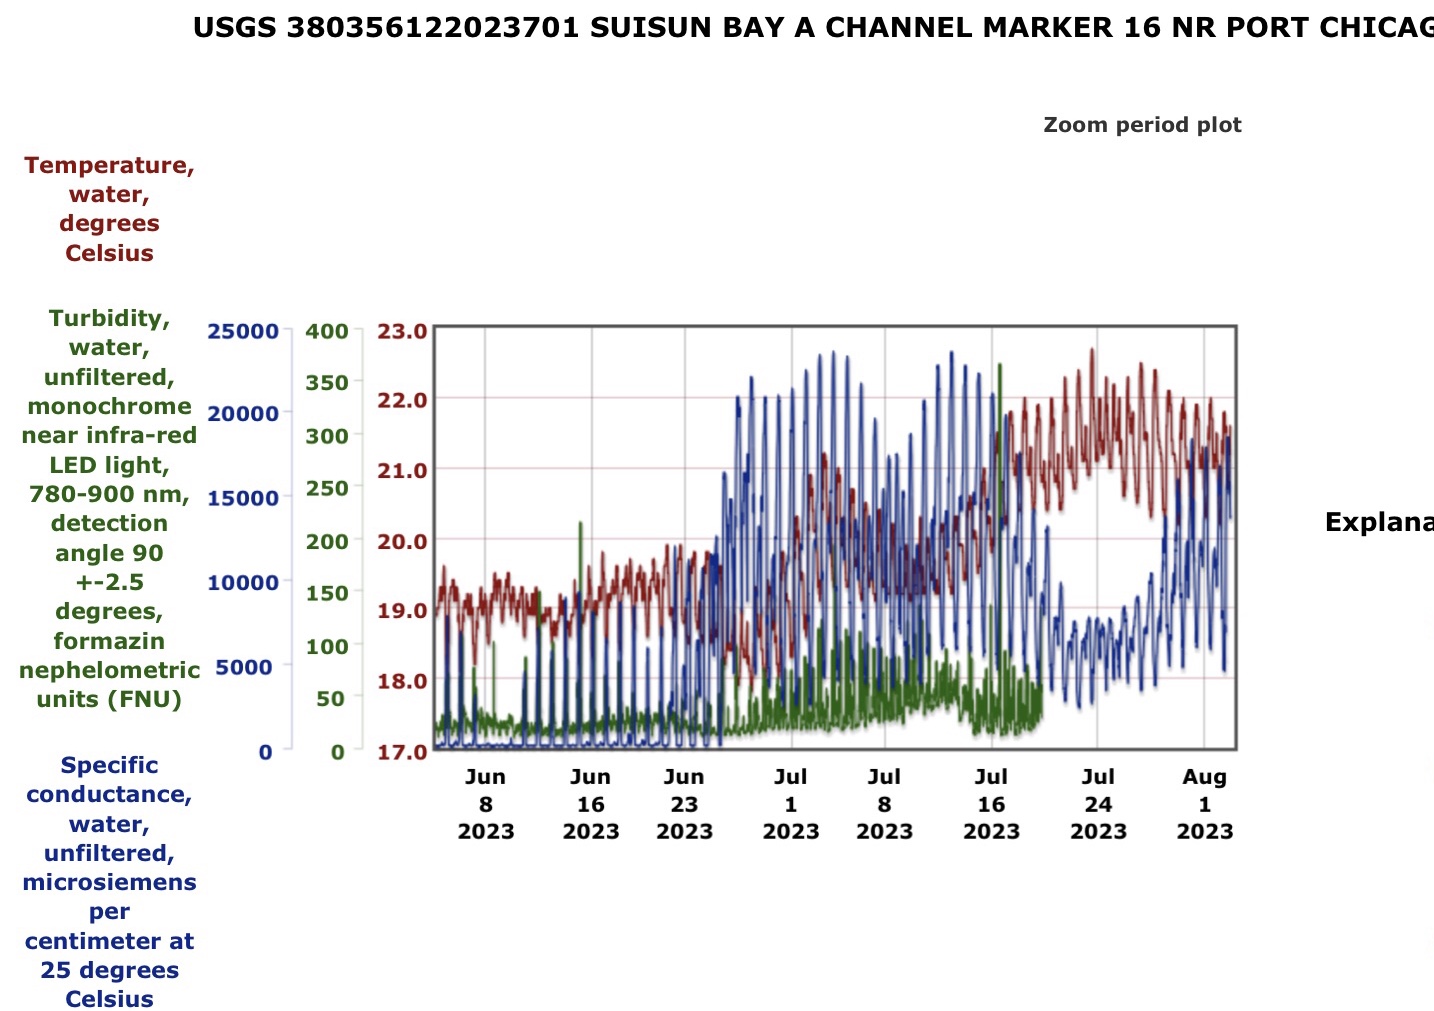
Graph showing Salinity (EC), water temperature (C), and turbidity at Port Chicago in east Bay in June-July 2023.

Figure 8. Salinity (EC), water temperature (C), and turbidity at Port Chicago in east Bay in June-July 2023. Note neap tide and lower salinity and warmer water on 7/22-25.
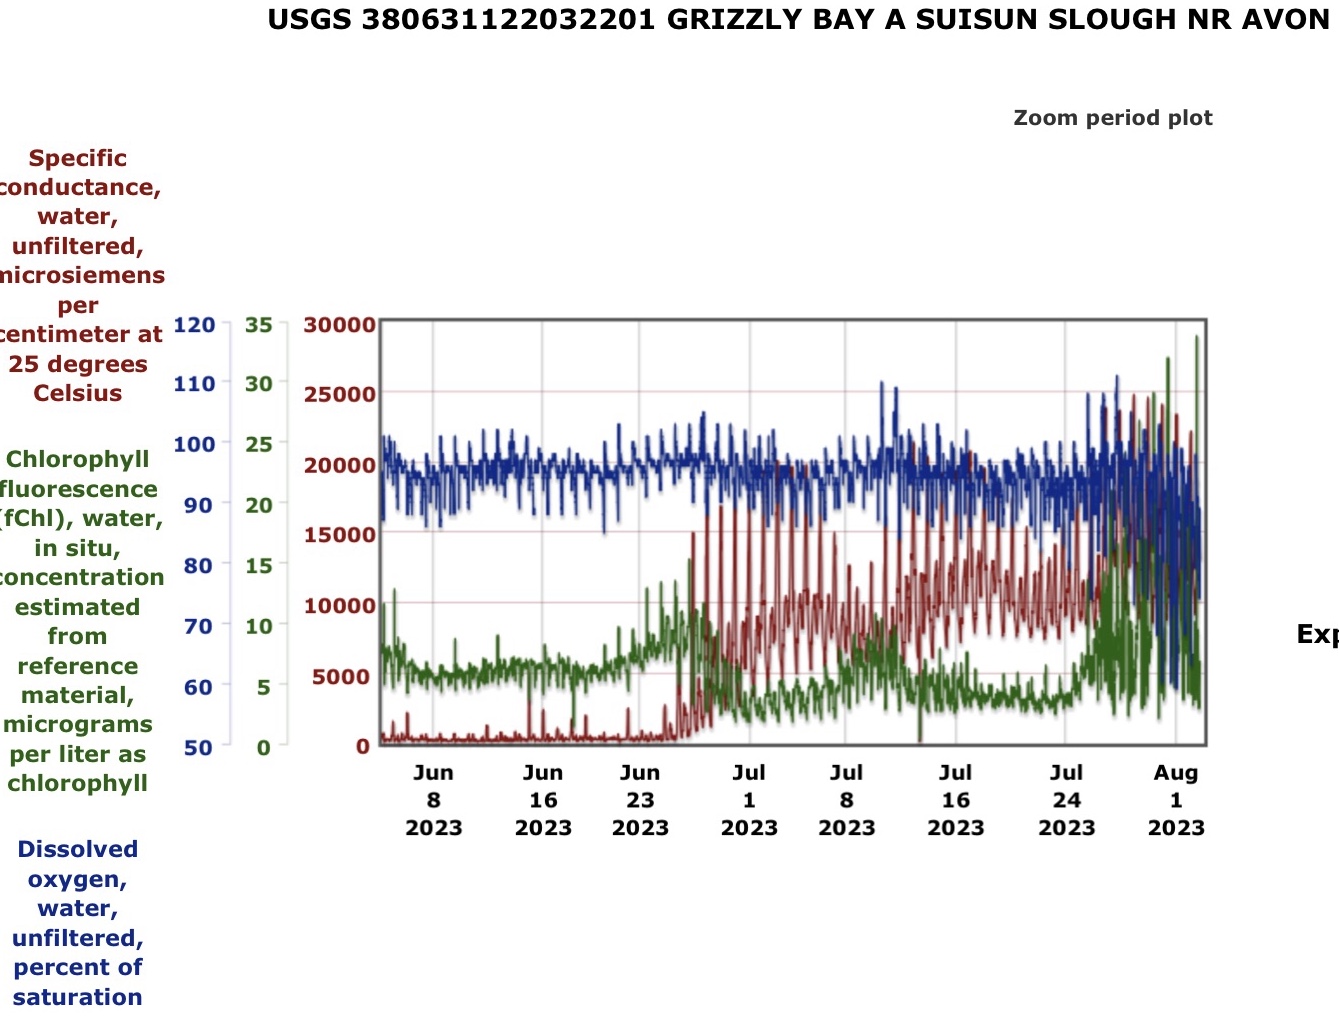
Graph showing Salinity (EC), dissolved oxygen, and chlorophyll concentration in east Bay in June-July 2023.

Figure 9. Salinity (EC), dissolved oxygen, and chlorophyll concentration in east Bay in June-July 2023. Note bloom, higher salinity, low dissolved oxygen beginning on 7/25.
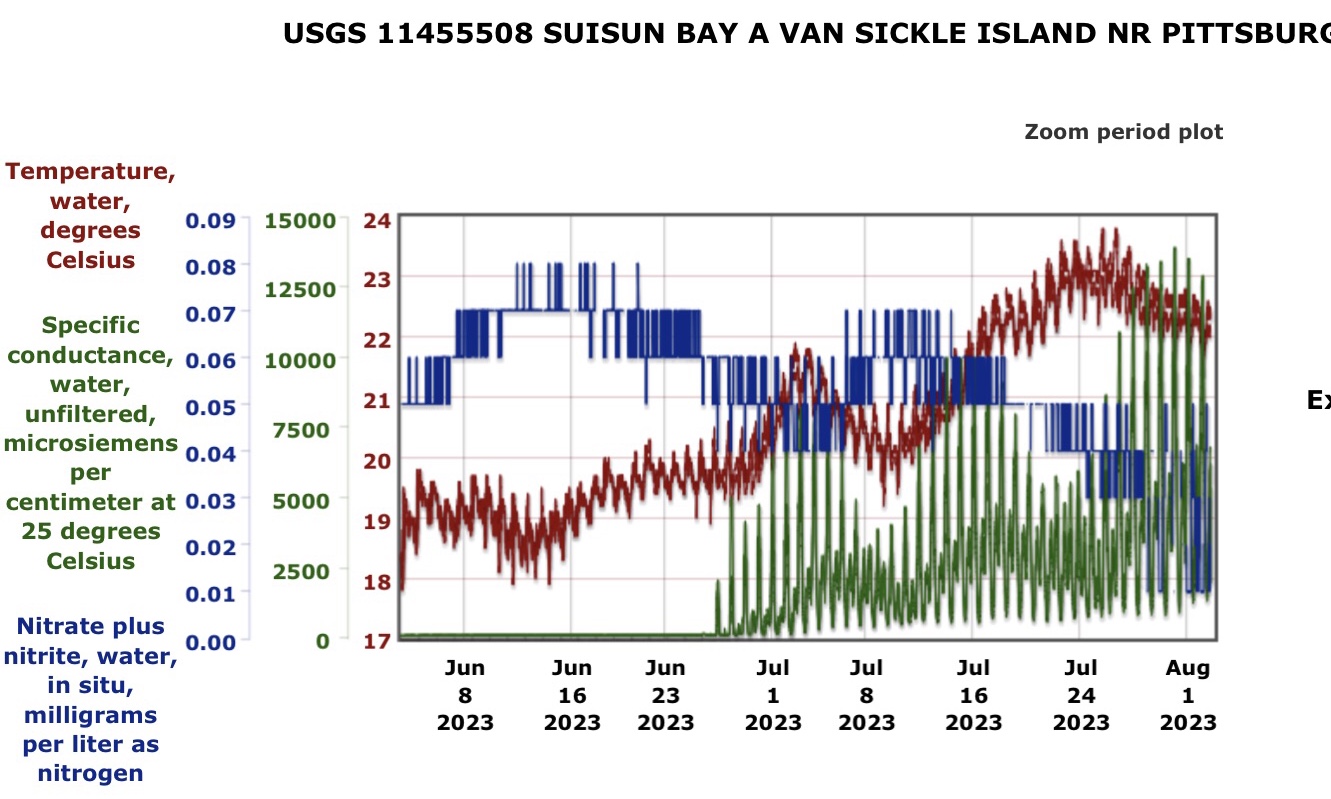
Graph showing Salinity (EC), water temperature (C), and total nitrogen at Pittsburg in east Bay in June-July 2023.

Figure 10. Salinity (EC), water temperature (C), and total nitrogen at Pittsburg in east Bay in June-July 2023. Note higher salinity and water temperature, and reduced nitrogen (from algae uptake) beginning on 7/24-25.

  1. Two supermoons will light up the night sky in August. Here’s what you need to know https://www.sfchronicle.com/bayarea/article/supermoons-two-blue-sturgeon-18270736.php ↩
  2. Spring tides always happen when the Moon is at the full or new phase, which is when the Sun, Moon and Earth are in alignment. Neap tides occur around the first and last quarter phase of the Moon, when the Moon’s orbit around Earth brings it perpendicular to the Sun. ↩
  3. https://www.sfchronicle.com/climate/article/fishkill-18279379.php ↩
  4. https://ncgasa.org/2023/04/17/white-sturgeon-meeting-and-overview-from-cdfw/ ↩
Whatever Happened to Adaptive Management?

The big hype over the past several decades in the Central Valley has been Adaptive Management.  Whatever happened to it?  Did we forget about it, or simply take it for granted?  Did we rebrand it, morph it into something else?  I wrote a “white paper” on the topic for CALFED over 20 years ago.  My version was more about conducting experiments to address unknowns to help inform management decisions.

The definitions immediately below are further refinements.

Adaptive management, also known as adaptive resource management or adaptive environmental assessment and management, is a structured, iterative process of robust decision making in the face of uncertainty, with an aim to reducing uncertainty over time via system monitoring.

Above definition from Wikipedia

Adaptive management is a science-based, structured approach to improving our understanding of the problems and uncertainties of environmental and water management. (Older)

Adaptive management provides a structured approach for adaptation in a context of rapid, often unprecedented, and unpredictable environmental change. Its success depends on support from the larger social, regulatory, and institutional context, or “governance system.”   (Newer)

Above definitions from Delta Stewardship Council

The Delta Stewardship Council holds a forum every two years on Adaptive Management.  This year, the forum delves into governance.  Presenters and participants are from Delta governments and those who would like to participate in Delta government.  Topics include equitable adaptation, governance systems and needs, and human dimensions of adaptation and governance. 

While that all is nice, it is not what I am looking for to manage the Delta ecosystem.  I am more for the older definition.  We need answers.

Why are the Sacramento River and Delta so warm in the past decade or so?  Is it all climate change, drought, and air temperatures?  What has changed, and what can be done about it?  Those are my questions.  We need more adaptive management questions and some scientific experiments and monitoring.  I have analyzed much of the available data and developed theories on causes (with supporting data and analyses), but theories need testing through controlled scientific study that can lead to effective changes: adaptive management.

My theory is that we need 5000 to 10,000 cfs streamflow in the Sacramento River to keep it cool in summer.  We need to test that theory to find out how much water is really needed, and how much, when, and where under highly variable air temperatures.

Water managers have consistently opposed this kind of experiment.  They refuse to use the water for this kind of experiment.  And more importantly, they refuse to do an experiment that might produce the answer they don’t want to be known, let alone supported by rigorous study: more flow is needed.

On the contrary, there is a constant, built-in bias towards “experimenting” with how little water one can use to achieve biological objectives.  If too little water won’t achieve the desired outcome, managers, and in some cases scientists, try modifying the threshold biological objectives.

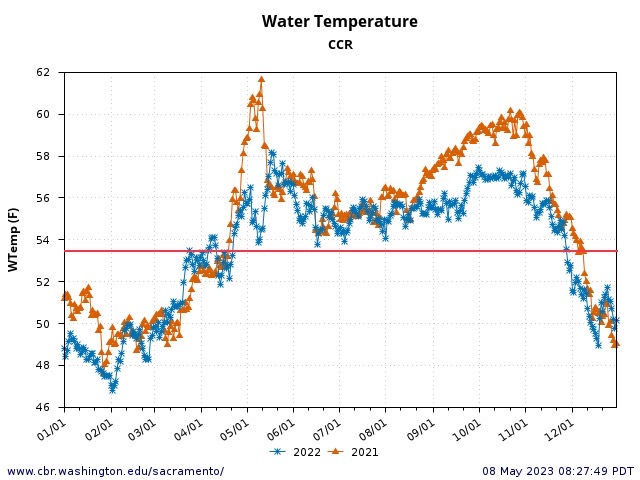
56oF was supposed to be fine for salmon spawning near Redding.  In 2021 and 2022, agencies including Reclamation thought they could get away with 58-60oF for periods (they couldn’t, Figure 1).  It turns out from controlled experiments that 56oF was too warm – 53oF is needed to keep eggs alive and well in the gravel.  There is simply no getting around it.  The agencies were experimenting with critically endangered salmon with poorly designed, un-scientific management strategies.

In the Vernalis Adaptive Management Program in the early 2000s, ten years of experimenting found that relatively small increments of flow increase in the San Joaquin River from mid-April through mid-May, combined with minimum Delta exports by the state and federal water projects, did not dramatically increase survival of San Joaquin River juvenile salmon migrating downstream.  The “adaptive” element of adaptive management did not thereafter increase the flows to see if that would improve juvenile survival.  On the contrary, water managers declared that more flows don’t help, and the Bureau of Reclamation since 2011 has serially ignored the flow requirements and export restrictions in mid-April through mid-May to which the rules were supposed to revert after the “experiment” concluded.

Here are some further questions that are begging for controlled scientific experiments, associated monitoring, and adaptive action:

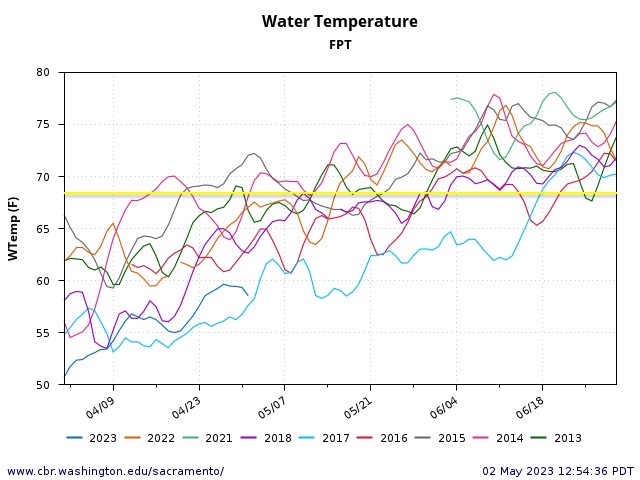
What will it take to keep the spring-summer Delta water temperature in key areas (such as the low salinity zone) below 72oF, at least through spring (Figure 2)?

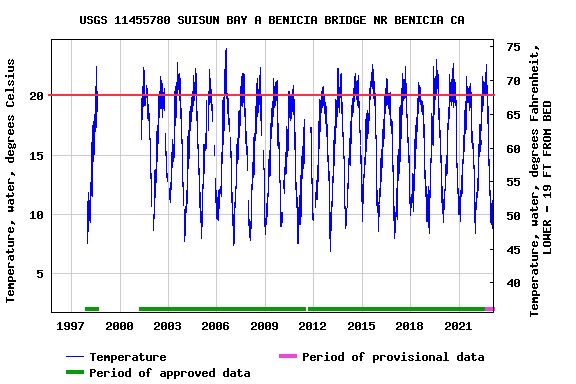
Is there something we can do to keep the Bay cooler in summer (Figure 3)?

There is little doubt that improving these temperatures would improve conditions for fish.  But the scientific community needs to push itself and water managers past built-in biases in order to evaluate the feasibility of such improvements.

Figure 1. 2021 and 2022 water temperatures in the Sacramento River above the mouth of Clear Creek near Redding. Red Line is safe level for salmon eggs.

Figure 2. April-June water temperatures in Sacramento River at Freeport in the north Delta in spring in past decade. Yellow line is critical level 68oF for migrating juvenile and adult salmon.

Figure 3. Water temperatures at the Benicia Bridge at the west end of Suisun Bay, 1998-2023. Red line is critical level for salmon survival during migration.


Smelt Status – Winter 2023 How Low Can You Go?

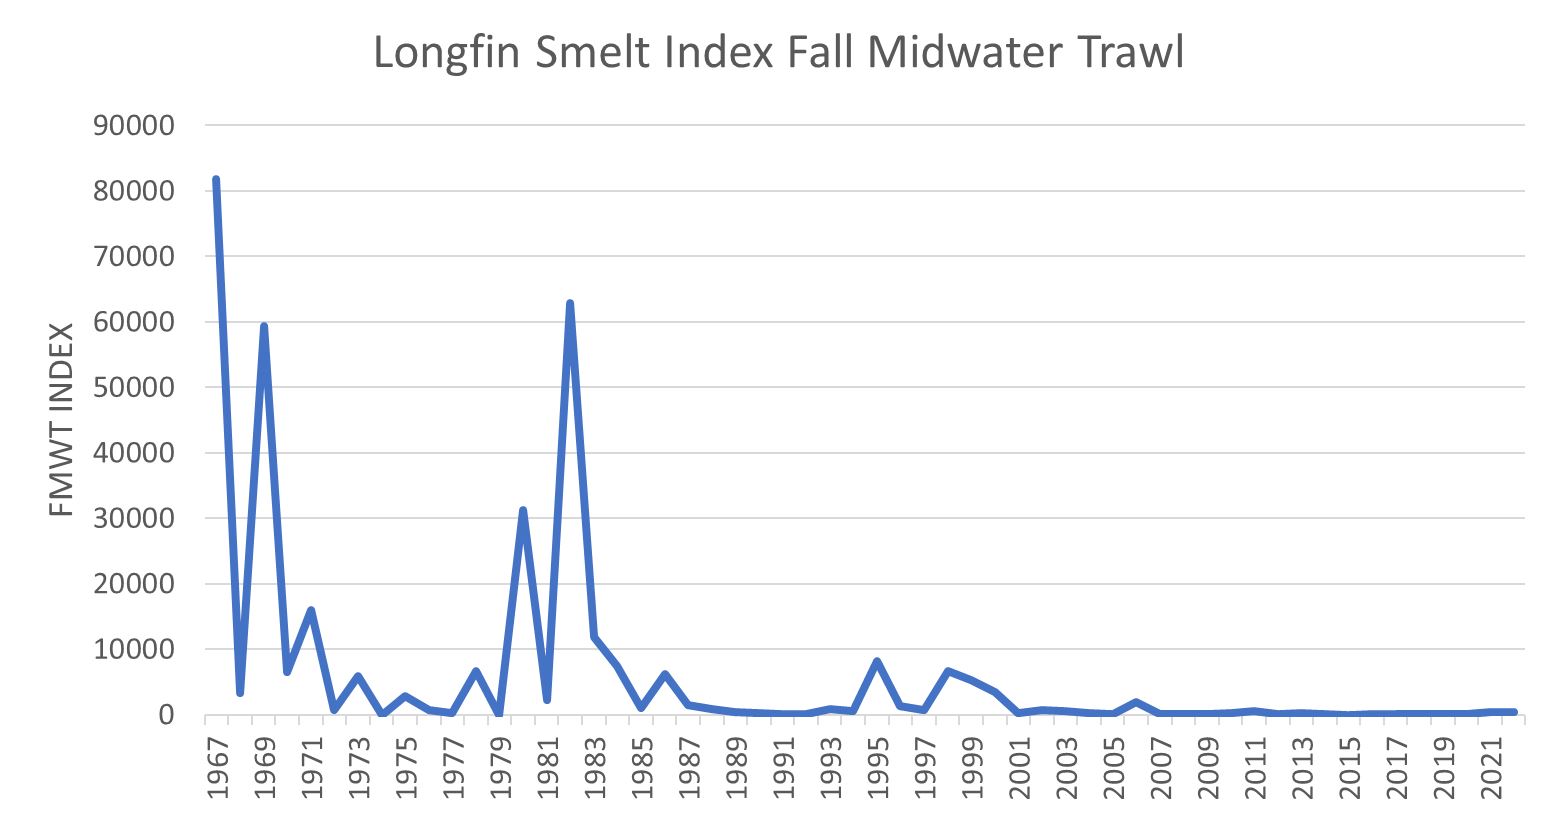
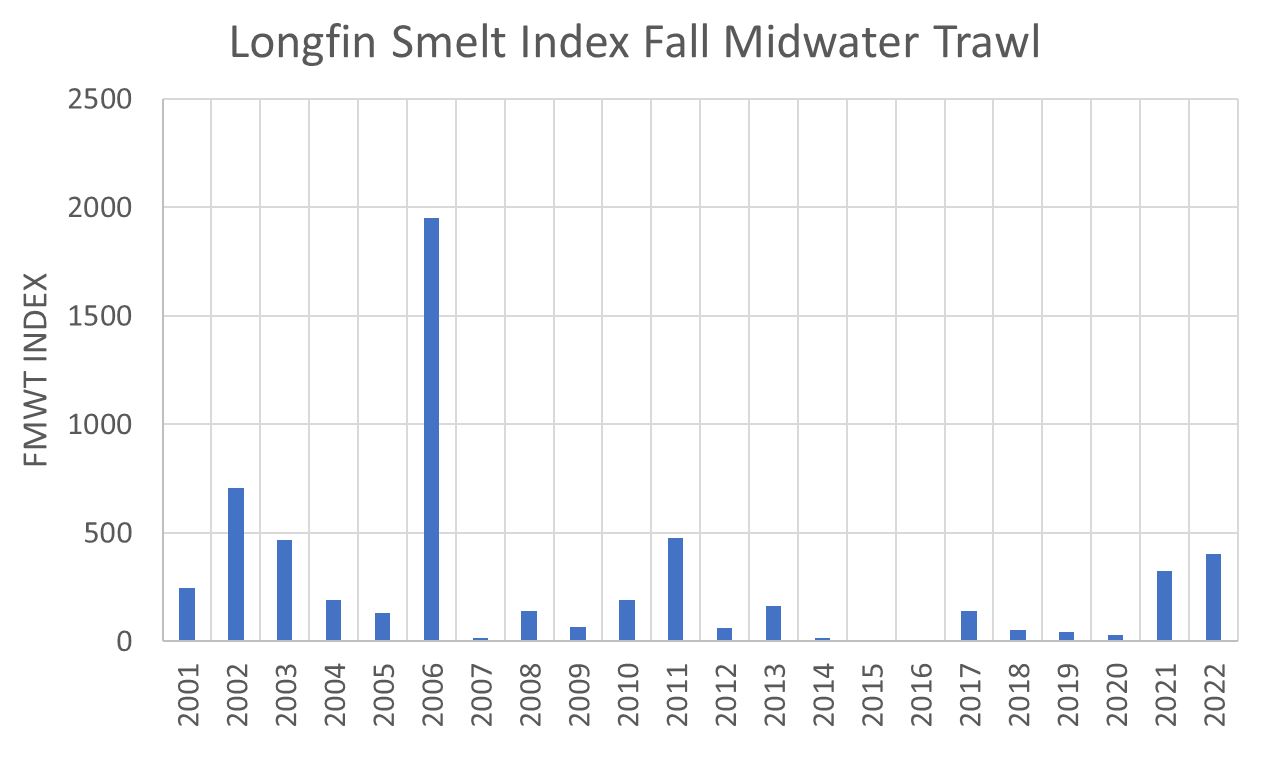
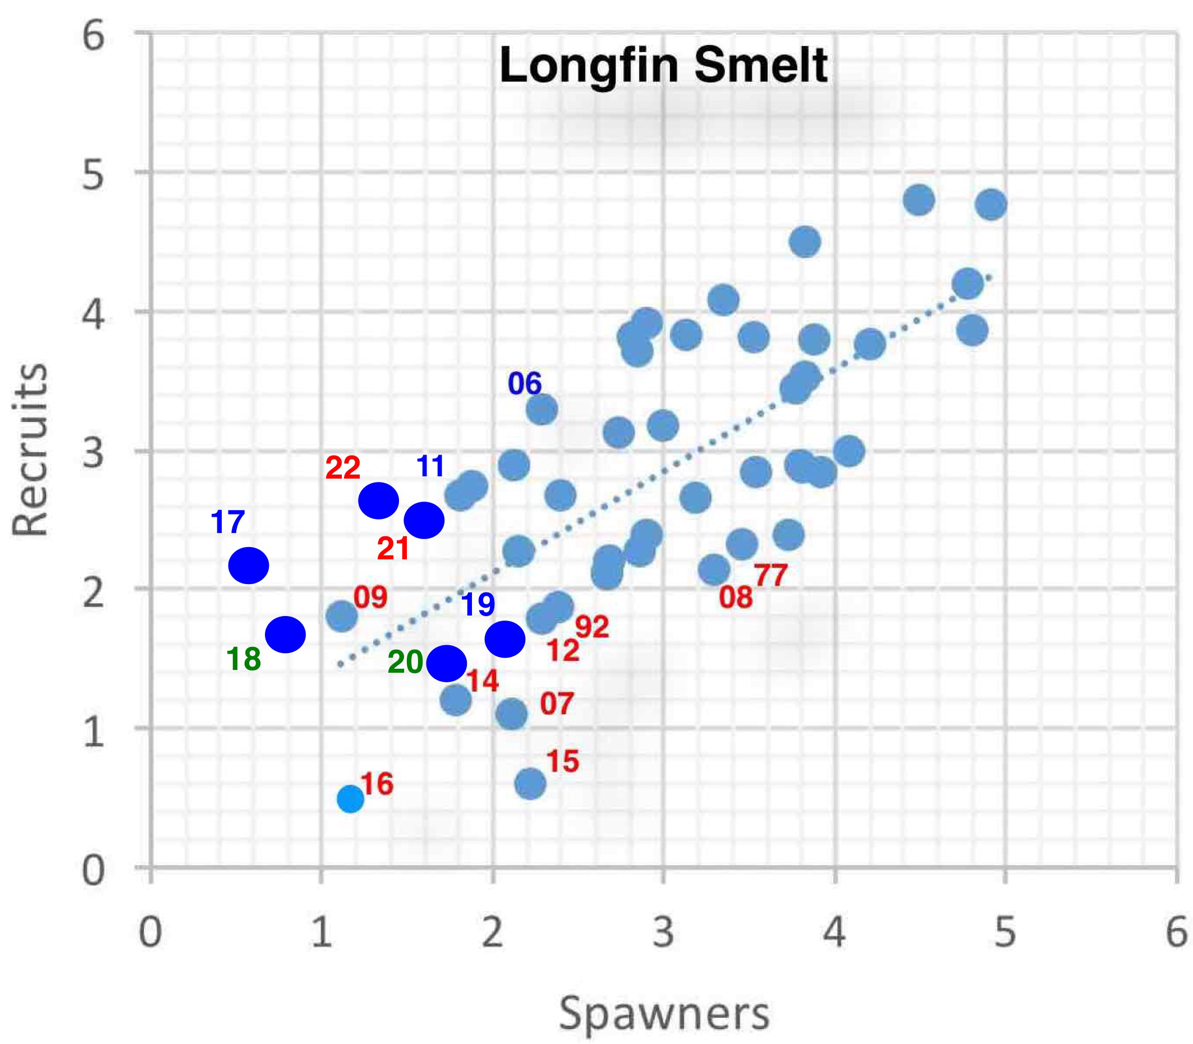
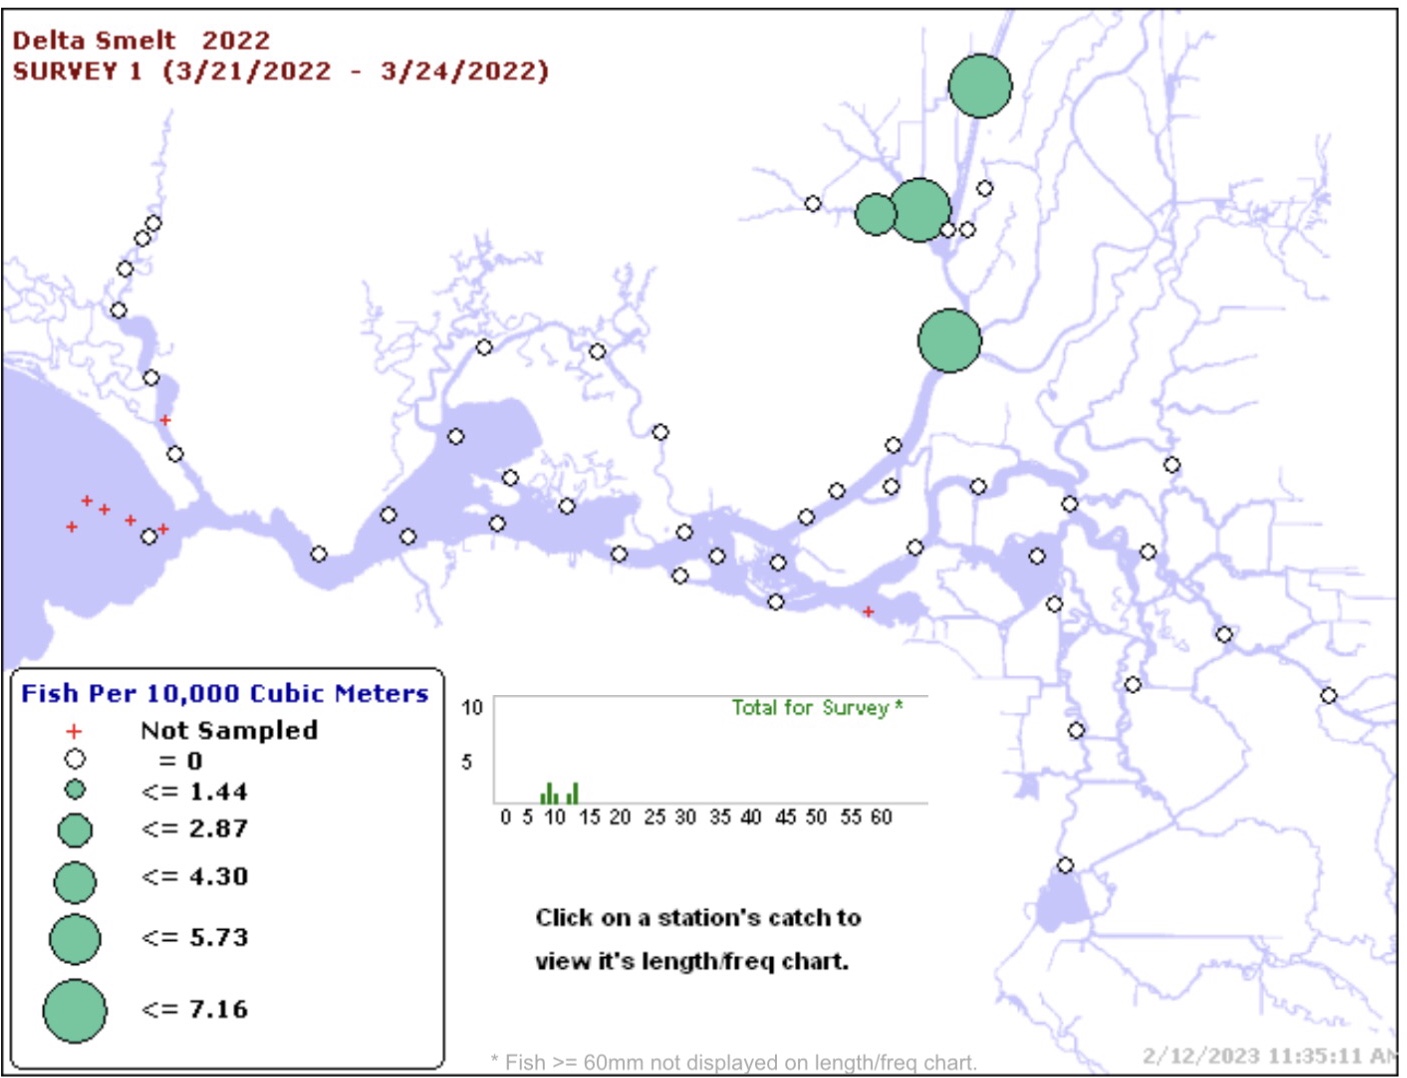
In prior posts in December 2022 and November 2021, I described the status of listed delta smelt and of longfin smelt.  More recent information shows little change in the dire outlook for these two native Bay-Delta fish (Figures 1-4).

Delta smelt and longfin smelt populations have declined severely over the past few decades due to poor water management. In the Bay-Delta, where the smelt spend most of their lives, south Delta water exports and warming of the Bay and Delta from reduced inflow and outflow has limited their production.  Temporary urgency change petitions (TUCPs) during multiyear droughts and  subsequent orders by the State Water Board have allowed reduced Delta outflow, leading to higher water temperatures and increased Delta salinity. The State Board is again considering yet another TUCP in winter 2023 that would reduce Delta outflow to allow higher exports.

In this winter 2023, the Low Salinity Zone has again moved further upstream (eastward) into the Delta because of falling freshwater inflow to the Delta after the January storms.  Delta exports have fallen with lower Delta inflows as State Board conditions kick in.  The TUCPs are an obvious and direct threat to these population remnants living in the Low Salinity Zone.  Further allowing these weakened standards to be violated is a direct disregard for these nearly extinct species.  Water management places them at extraordinary risk by (1) bringing them further into the Central-Delta zone of the two large South-Delta water diversions, (2) degrading smelt habitat with lethal water temperature, (3) further degrading their already depleted food supply, and (4) increasing the concentrations of toxic chemicals being relentlessly discharged into the Delta.

The scientific literature, and water and resource management agencies, all recognize these major problems.  Many management and recovery schemes have been developed and implemented over the decades.  However, nothing has stopped water managers’ relentless excessive use and abuse of the Central Valley hydrology.  The salmon, smelt, sturgeon, and steelhead are not just the victims but serve as “canaries in a coal mine”, all dying while the water is continually mined from the system.  Meanwhile, water managers blamed this mass extinction event on on climate change, cynically gaming worsening conditions to extract even more water.

There is more and more talk of employing “ecosystem-based management” that integrates the environment into all phases of decision-making, effectively giving the environment a seat at the table.  But the reality is more like giving the chickens a say in how the foxes manage the depopulation of the hen-house.  There is also talk about providing more flexibility in how and when water is used – allocating environmental water as “functional flows” or “environmental water storage” to optimize the ecosystem benefits of what little water is allocated for the environment.  Placed in he hands of water managers, such efforts simply give them more flexibility to game the system to their advantage.  When they think they can get more water, they just ask for it and usually get it.  One policy group proposes: “Making this work may require establishing assets for the environment—such as water budgets, reservoir storage space, and funding to restore physical habitat—that can be flexibly used to adapt to changing conditions.”  No, a piece of bread and a cup of water on the survivors’ deathbeds are all they get.  Even the water managers get to choose the physical habitat and how its restored, and how much extra water they can take as a result.

It is time to change this pattern of abuse of public trust resources by standing up to abusers in the State’s TUCPs, the Update of the Bay-Delta Water Quality Control Plan, and the public review of the Delta Tunnel Project.  The Tunnel simply adds another straw in the Delta, but further upstream, closer to the mouths of the Feather and American rivers, the main sources of Bay-Delta freshwater inflow.

Figure 1. Bay-Delta fall-midwater-trawl longfin smelt catch index 1967-2022.

Figure 1. Bay-Delta fall-midwater-trawl longfin smelt catch index 1967-2022.

Figure 2. Longfin Smelt Fall Midwater Trawl Index in recent two decades 2001-2022.

Figure 2. Longfin Smelt Fall Midwater Trawl Index in recent two decades 2001-2022.

Figure 3. Log-Log relationship for longfin smelt index year (number shown are brood year “recruits”) vs index two years prior (spawners). Red numbers represent brood years that were the product of dry water years, green numbers = normal water years, and blue = wet water years. Blue dots are six most recent years, 2017-2022: fewer spawners produce fewer recruits.

Figure 3. Log-Log relationship for longfin smelt index year (number shown are brood year “recruits”) vs index two years prior (spawners). Red numbers represent brood years that were the product of dry water years, green numbers = normal water years, and blue = wet water years. Blue dots are six most recent years, 2017-2022: fewer spawners produce fewer recruits.

Figure 4. Catch of Delta smelt in 20-mm Survey in late March 2022. Seven were captured in the north Delta just upstream of where adult hatchery smelt were released in December 2021.

Figure 4. Catch of Delta smelt in 20-mm Survey in late March 2022. Seven were captured in the north Delta just upstream of where adult hatchery smelt were released in December 2021.


How did Winter-Run Salmon do in Summer 2022? Not Good.

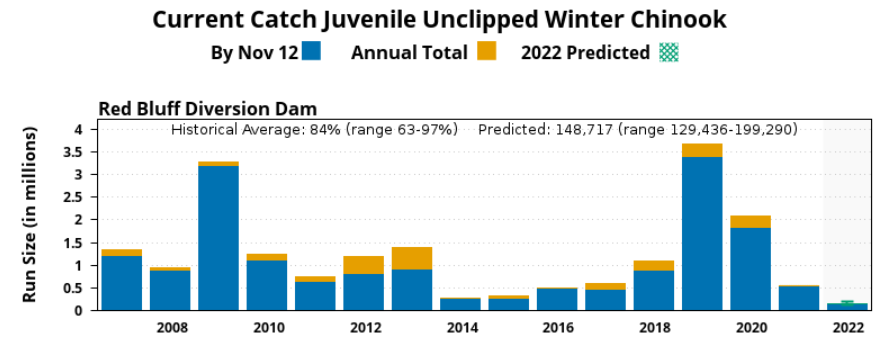
First the bad news. The production in 2022 of winter-run salmon fry in the upper Sacramento River near Redding was at record low levels, similar to the disaster years 2014 and 2015, maybe worse (Figure 1).

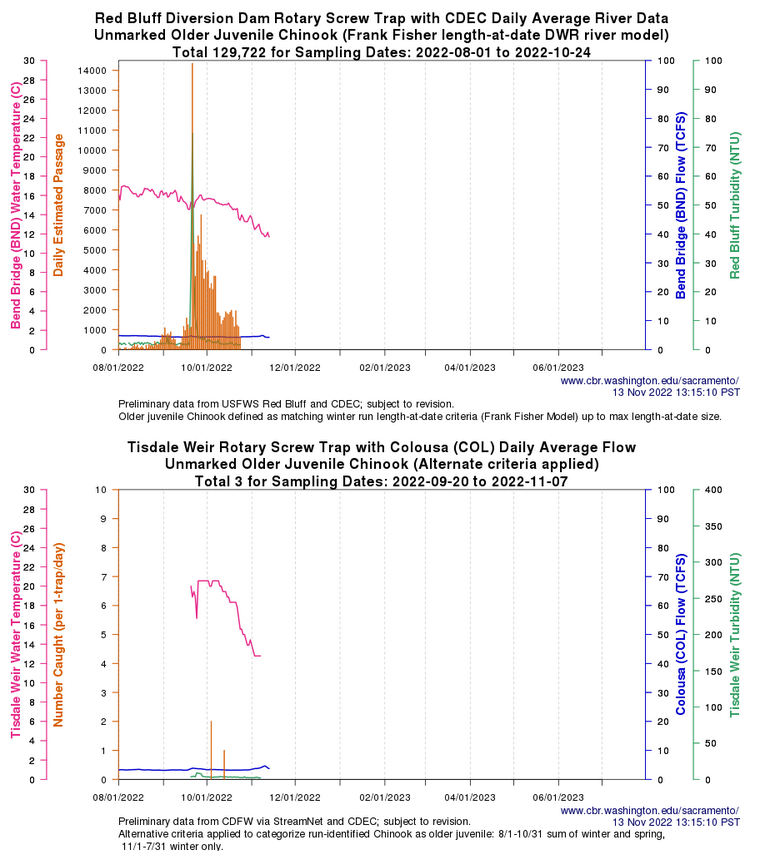
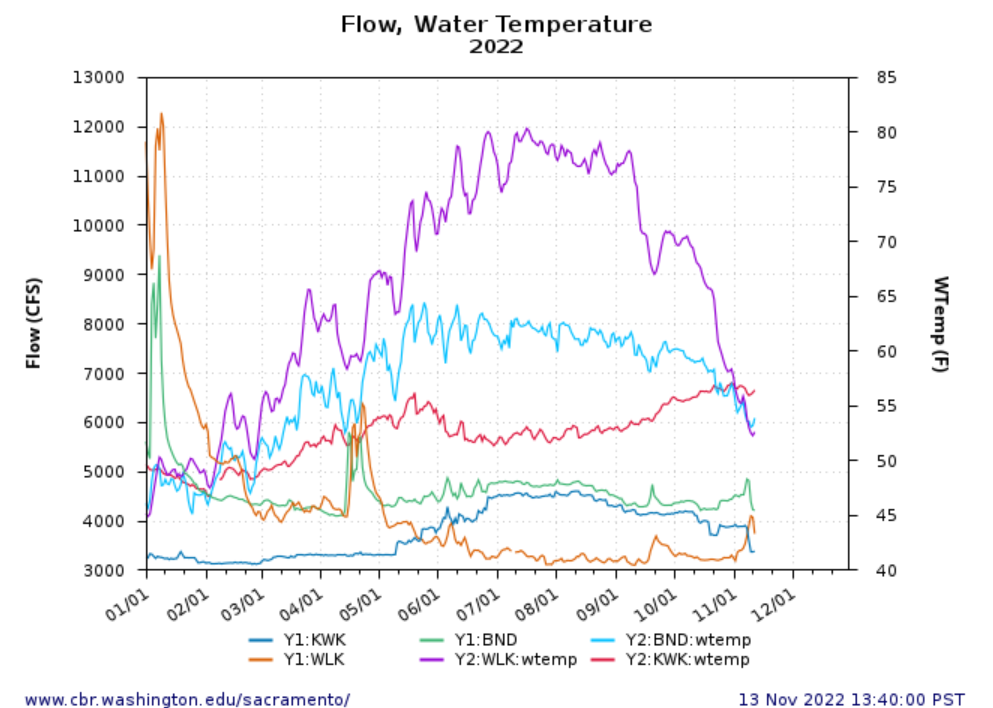
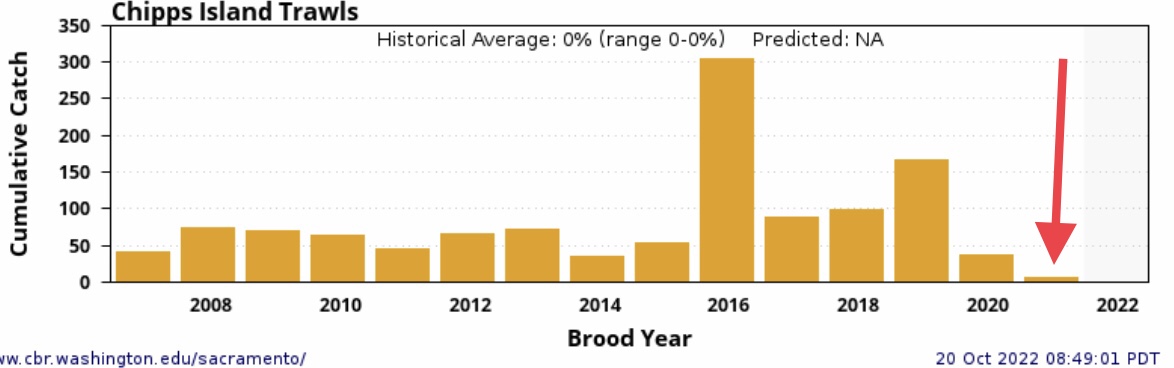
Next, more bad news (there is no good news). Most of the fry are now in the 100-mile reach below Red Bluff, with only a small proportion to date (November 7) reaching Knights Landing below Chico (Figure 2). Flows (Figure 3) remain too low for good fry survival, with little flow increase following late October and early November rains. Clear water conditions make it easy for the tens of thousands of striped bass and smallmouth bass residing in the 100-mile reach to pick off migrating juvenile salmon. Up till late October, water temperatures above 60ºF kept bass active (also Figure 3). With conditions expected to be similar to last year, one can only expect this year’s production to be similar to last year’s poor production (Figure 4).

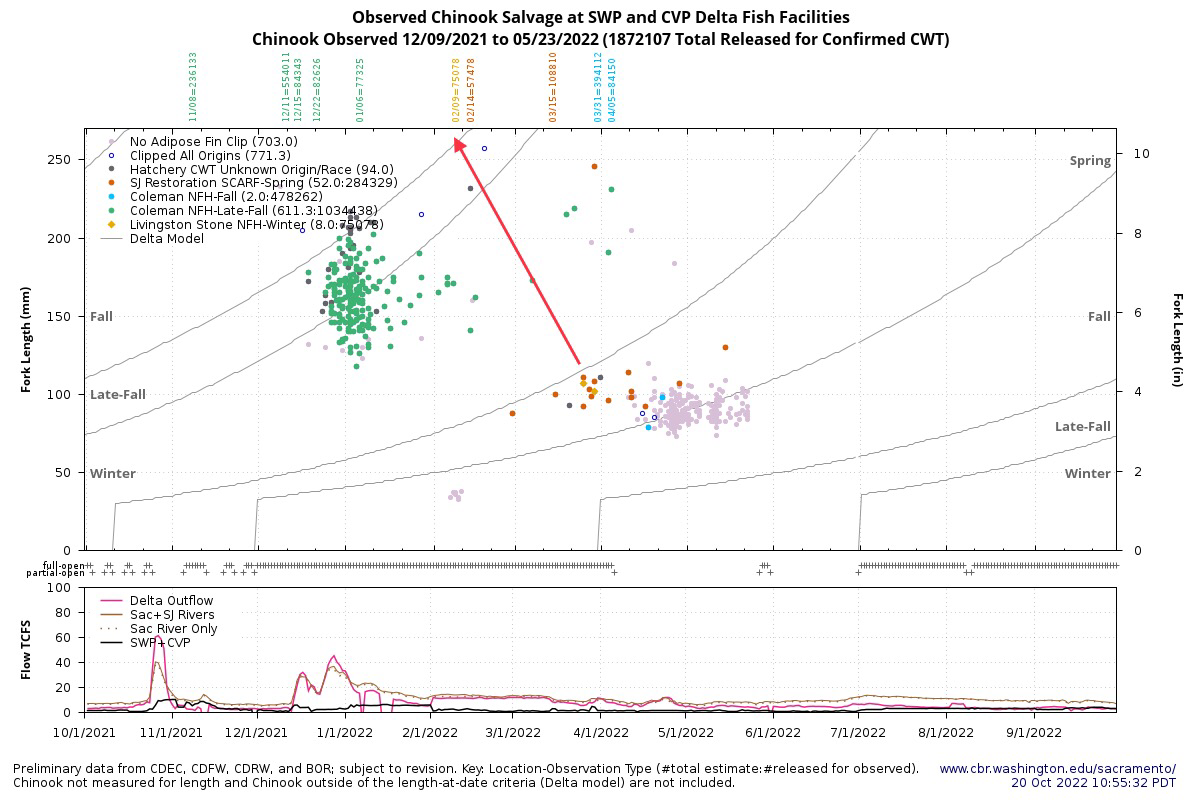
Some might say increased hatchery winter run production in 2022 is good news. Higher than normal numbers of hatchery fry are being raised in the Livingston-Stone Fish Hatchery for release next winter. But last winter’s hatchery releases during critical drought conditions did not fare well, as shown by the very small numbers that reached the Delta (Figure 5). To compensate, Interior began increasing egg-taking1 for the hatchery and transporting adults and hatchery smolts to upper reaches of Battle Creek. While these actions are worthwhile, the problem remains that drought year release returns (harvest plus escapement) average about 0.2%, compared to 2% returns in wet years.2

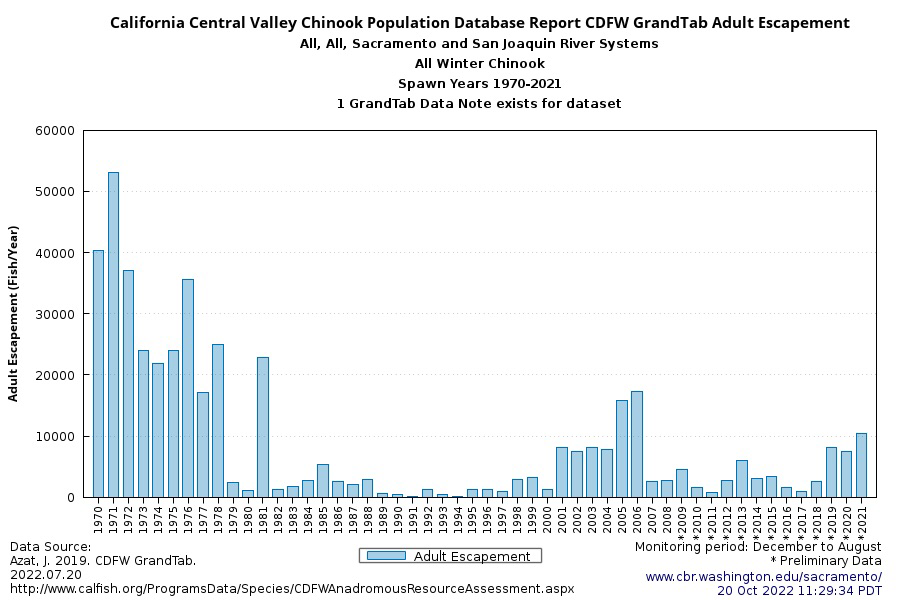
The prognosis for the winter-run salmon from all these sources of recruitment during the 2020-2022 drought to return as adults into fishery catches and the spawning runs is grim.3 The population does recover after wetter year periods (2016-2019, Figure 6), but not without the support of the hatchery. More needs to be done to improve wild and hatchery fry survival and smolt production to safely recover the winter-run salmon population. Flow pulses and enforcement of the state water temperature standards are needed. Vitamin injections, more hatchery egg-taking, and taxi rides alone will not do the job.

Graph showing Run Size from 2007 through 2022

Figure 1. Annual catch of unmarked juvenile winter run salmon in screw traps near Red Bluff as of November 13, 2022. (Source)

Graphs showing Water Temperature and Daily Estimated Passage

Figure 2. Juvenile winter-run salmon catch in Red Bluff and Colusa screw traps in 2022. (Source)

Graph showing flow CFS and Temp

Figure 3. Water temperature and flow rate below Keswick Dam (KWK, RM 300), at Bend near Red Bluff (BND, RM 250), and below Wilkins Slough (WLK, RM 120) in 2022. (Source)

Graph of Cumulative Catch per Brood Year

Figure 4. Annual catch of unmarked juvenile winter run salmon in screw Chipps Island trawls near Pittsburg, CA. Red arrow shows 2021 catch. (Source)

Graph of Observed Chinook Salvage at SWP and CVP Delta Fish Facilities

Figure 5. Salmon salvage at south Delta export facilities in 2021. Salvage of hatchery release groups is color coded. Red arrow shows winter-run hatchery smolt release group and the subsequent capture/salvage of two smolts from the group in late March. (Source)

Graph California Central Valley Population Database Report CDFW GrandTab Adult Escapement

Figure 6. Winter run salmon escapement 1970-2021. (Source)

Review of Decade-Old Misdirection on Delta Smelt

For several decades, scientific literature and state and federal permits have documented the decline in Delta smelt and promoted actions designed to slow the Delta smelt’s demise or even reverse it. However, that soundly based and widely promoted recovery strategy has often been undermined by some scientists and engineers funded by water-related industries and users intent on minimizing constraints on their water operations. The undermining of traditional science and regulatory institutions has been insidious and aggressive, to the point of nearly destroying the Central Valley and Bay-Delta ecosystem and many of its public trust resources. I know this from working nearly 50 years on these conflicts.

A recent interest takes me back to some of these undermining efforts from a decade ago. In this post, I evaluate past theories from such efforts and further characterize the “science” used to support them. I believe such hindsight reviews of these historical efforts helps to daylight and counteract similar present and future attempts to undermine institutional protections. I focus on unsubstantiated conclusions, on misuse of data or analytical tools, and on the authors’ general strategy of promoting misinformation to argue their points.

The “scientific paper” I review in this post on Delta smelt is William J. Miller, Bryan F. J. Manly, Dennis D. Murphy, David Fullerton & Rob Roy Ramey (Miller et al.) (2012): An Investigation of Factors Affecting the Decline of Delta Smelt (Hypomesus transpacificus) in the Sacramento-San Joaquin Estuary, Reviews in Fisheries Science, 20:1, 1-19, DOI: 10.1080/10641262.2011.634930.1

In commenting below, I show quotations from the paper in quotes and italics.

Comments on the Authors’ Major Conclusion in the Abstract

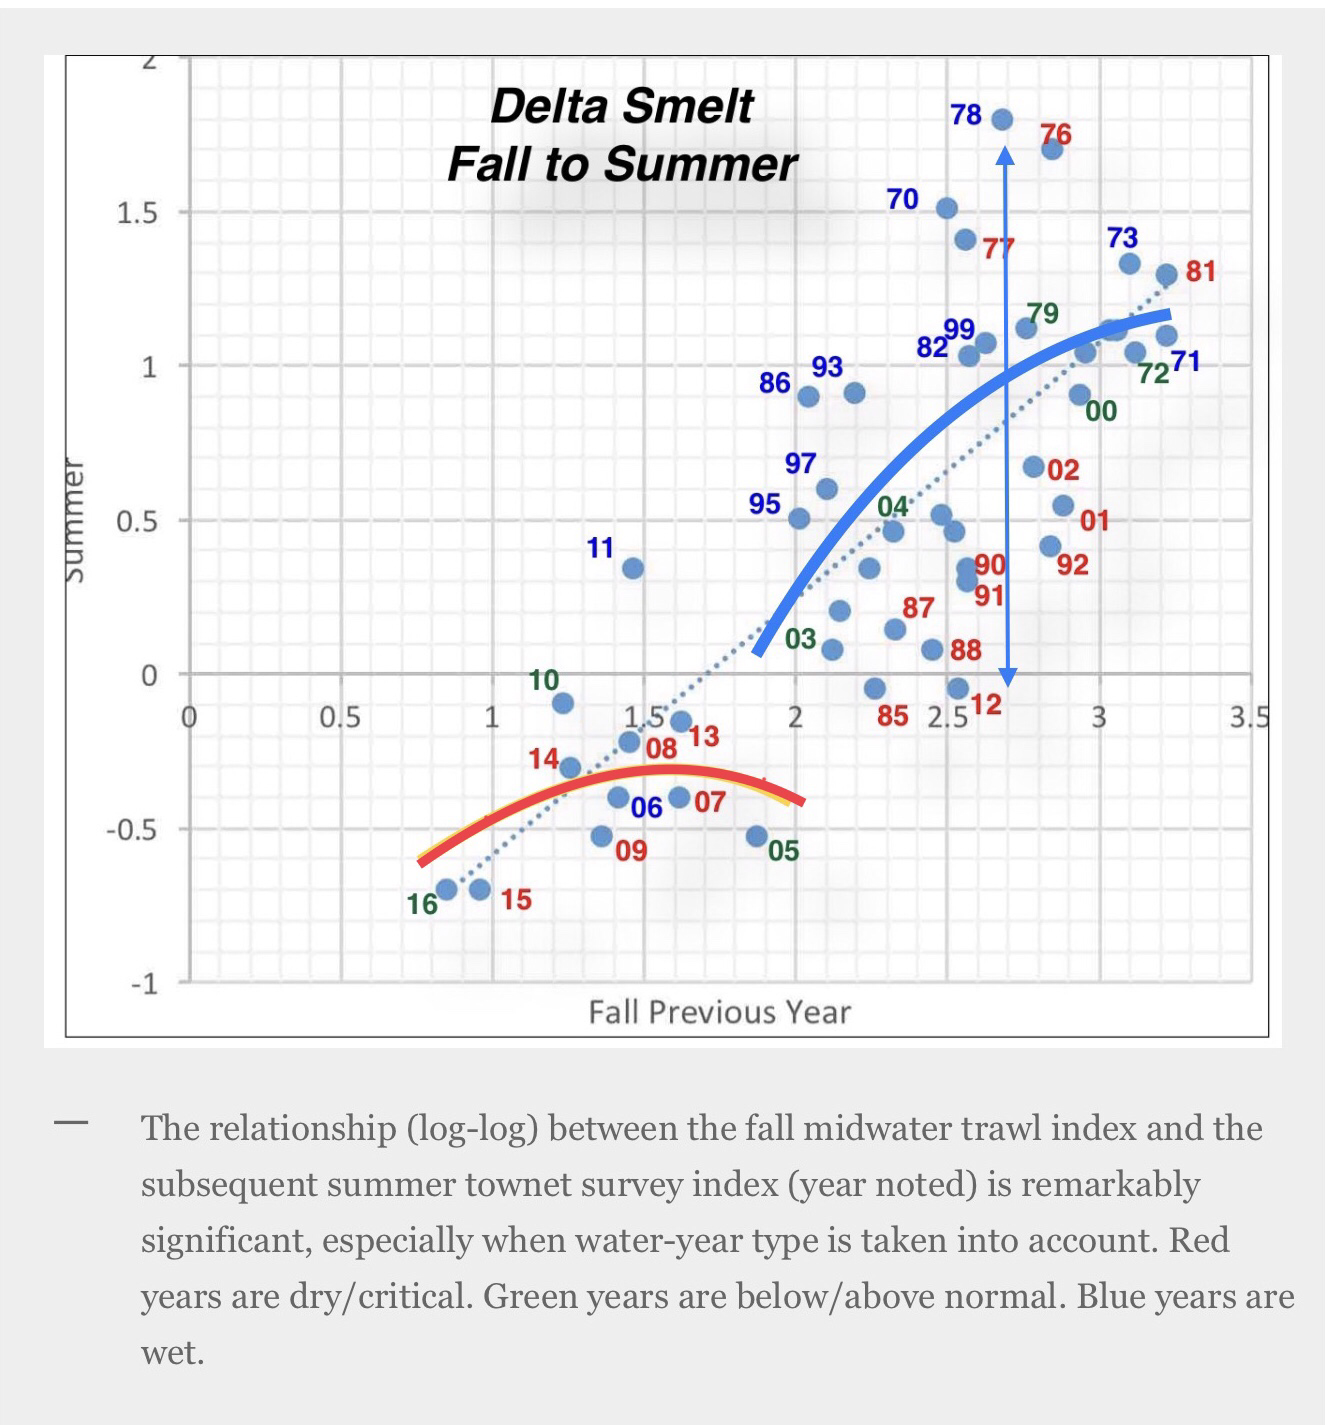
  • “Strong evidence was found of density-dependent population regulation.” The authors made no attempt to describe such “regulation” of the Delta smelt population. First, the meaning of “strong” is unclear. I assume the authors mean that two variables appear closely related. I found a “density-dependent” relationship (see my Figure 1, below), wherein summer abundance is positively related to previous fall abundance. Second, the meaning of “regulation” is unclear. I assume by “regulation” they mean that at very high numbers of adults, recruitment tails off, as implied in the blue curve in Figure 1. But as shown in the figure, the inference is far from a “strong evidence” of “population regulation” due to density.

  • “The density of prey was the most important environmental factor explaining variations in delta smelt abundance from 1972 to 2006 and over the recent period of decline in the abundance of the fish.” Association does not necessarily mean cause and effect. In Figure 1, I show that wet years have, on average, ten times more recruitment than dry years. That could be why prey appears important, because smelt prey densities (and feeding habitat conditions) tend to be better in wet years. However, water temperatures are also higher in dry years, as is entrainment of smelt in the south Delta. Just because prey has the highest correlation does not mean it is the cause or has any direct effect. These variables are not independent from one another.

  • “Predation and water temperature showed possible effects.” The authors also noted other positive relationships. The problem with such statistical analyses is that the “independent variables” being tested against smelt abundance are not independent from each other. Therefore, no judgement can be made as to cause and relationship, only inferences.

  • “Entrainment of delta smelt at south Delta pumping plants showed statistically significant effects on adult-to-juvenile survival but not over the fish’s life cycle.” Here again, cause and effect are inferred. The authors state the fact that recruitment is related to the number of adult spawners, yet they immediately state otherwise. Entrainment of adult smelt is something that has been measured – as salvage at the south Delta pumping plants. It is a variable that can readily be compared to the fall trawl index. But entrainment of larvae and early juveniles (6-25 mm young) is not measured, and thus this part of the “fish’s life cycle” cannot be statistically related to any smelt index.

  • “Neither the volume of water with suitable abiotic attributes nor other factors with indirect effects, including the location of the 2 ppt isohaline in the Delta in the previous fall (“fall X2”), explained delta smelt population trends beyond those accounted for by prey density.” When a variable shows minimal relationship, it cannot be concluded that it has no effect, or compared in strength to another “independent” variable (another potential factor). Fall X2 may only be important in some years, and thus its effect relationship may be non-linear.2 The relationships being studied may also change with time (as indicated in Figure 1). Relationships are also often complicated by factors that act in complex ways. Posts on my own reviews generally support the Fall X2 action for a variety of reasons.3 Thus, the authors’ conclusion or implication that Fall X2 is not important is not reasonable. The prey factor simply takes up more of the variability in the multi-factor statistical analysis, and thus masks the role of Fall X2.

Comments on the Introduction

  • “The need for immediate conservation responses is acute, but that need confronts another unfortunate delta smelt reality—perhaps less is known about the habitat of delta smelt, resources essential to its persistence, and the environmental stressors causing its low population numbers than is known about any other listed species.” This statement has no basis and is simply untrue. Delta smelt are one of the most studied fish on Earth.

  • “The life cycle of the tiny estuarine fish takes place in turbid, open waters, making it impossible to observe its behavior and account for many of its vital ecological relationships.” Over the past five decades, there have been numerous studies and volumes of monitoring data on Delta smelt “ecological relationships”. One only has to look at Figure 1. As for behavior, Delta smelt have been raised and observed in labs and hatcheries for over two decades. Two decades ago, I could literally smell them and their prime habitat. I could also tell where they would be by measuring salinity and water temperature.

  • “Several candidate factors have plausible mechanisms of effect on delta smelt numbers, but previous attempts to relate environmental stressors to the decline of this fish were not able to identify the factors responsible for the recent declines in the abundance index to near-extinction levels.” The evidence from the 1987-1992 drought (see Figure 1 for one of many examples) was quite compelling, enough to get the species listed under the Endangered Species Act, first as threatened (1993), then as endangered (2010). All the “plausible factors” could be related to drought conditions that had become worse with ever-increasing effects of water management (increasing exports year after year). Protections instituted in the aftermath of the drought and listing4 included designation of critical habitat (1994) and a recovery plan (1996), as well as multiple federal biological opinions and habitat conservation plans, and state incidental take permits over the next two decades. Recovery programs, including the Central Valley Project Improvement Program (CVPIA) and CALFED Bay-Delta Ecosystem Restoration Program (ERP), focused on Delta smelt recovery. Those efforts led directly to significant progress in 2010-2011; however, weakened protections during the 2012-2015 drought ended the potential for further progress.

  • “No field data have been derived from experimnts that directly relate delta smelt population responses to variation in physical and biotic conditions.” This statement is a gross untruth. The data that support Figure 1 are “field data.” Many of the various monitoring surveys (e.g., Larval Survey, 20-mm survey, Townet Survey) yield indices that show such relationships.

Comments on the Discussion

I could go on in the same -vein through the paper’s introduction, methods, results, and discussion, but I will skip to the paper’s primary conclusions as presented in the discussion section.

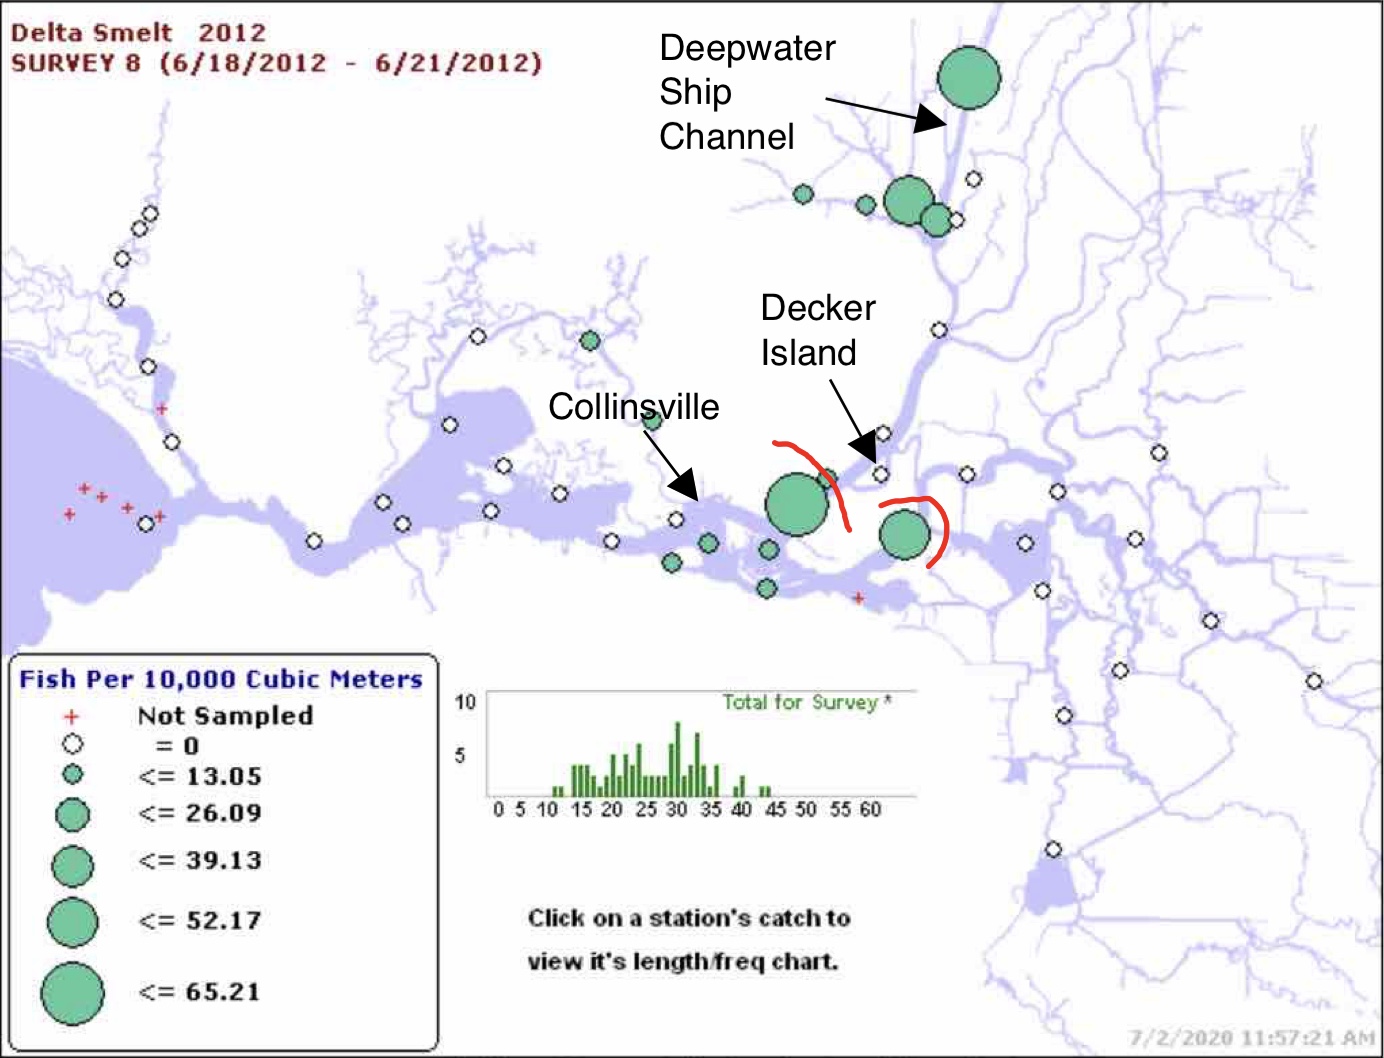
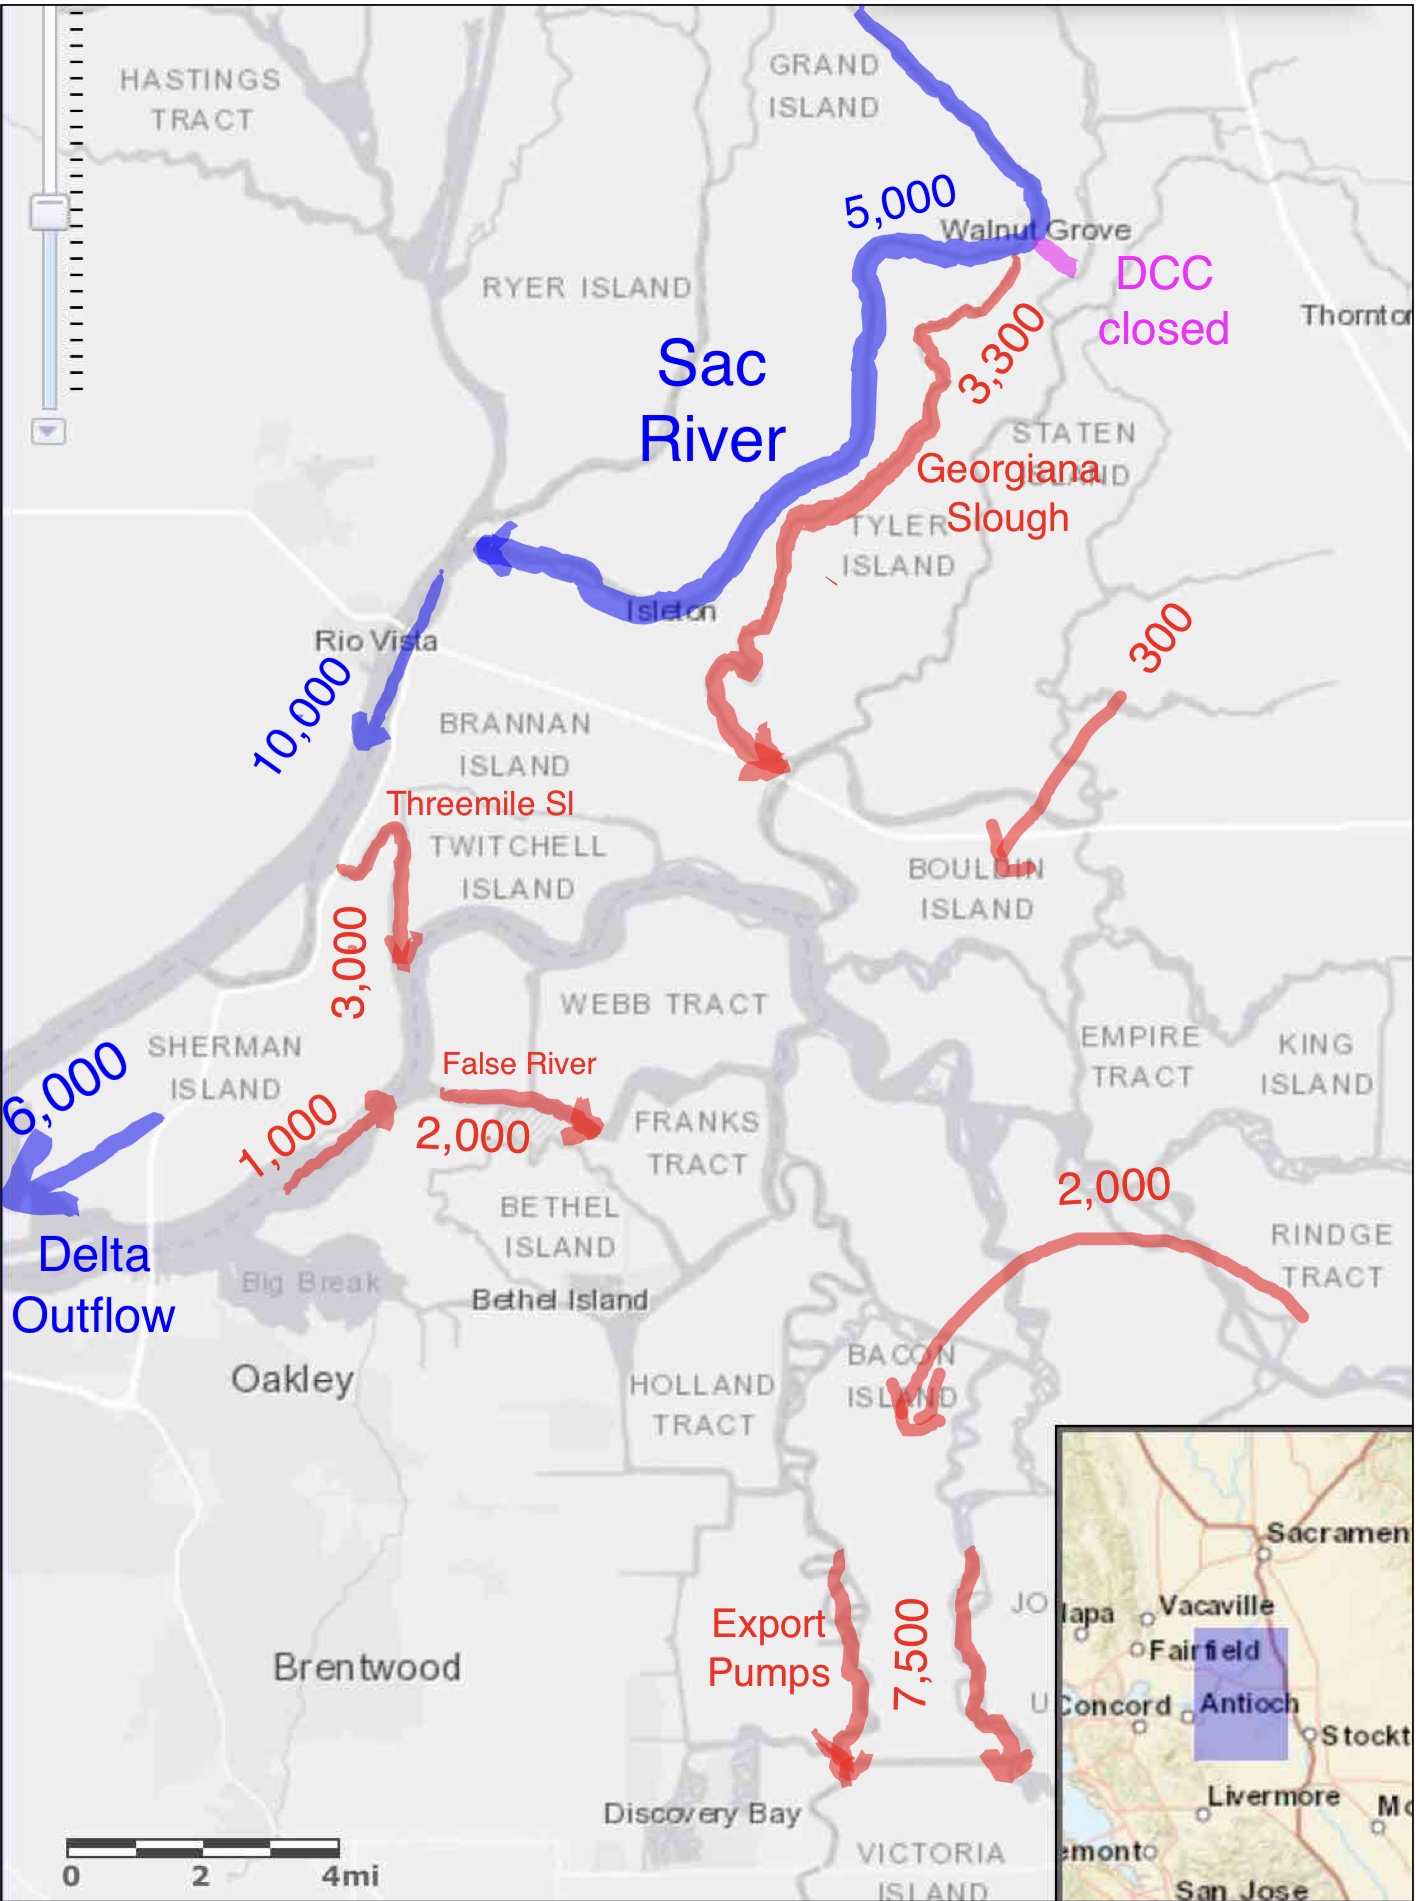
  • [E]ntrainment was not a statistically significant factor in survival from fall to fall”. First, entrainment of early smelt life stages into the federal and state south-Delta export facilities is not monitored. Second, monitoring that does help assess entrainment risk shows the inherent risk (Figures 2 and 3). Third, the fall midwater trawl survey includes the fall period of high adult salvage losses that contributed to the population decline, a data feature that compromises the fall-to-fall survival-factor analysis.

  • “Changes in prey density appear to best explain the sharp drop in delta smelt abundance in this century”. First, Delta-smelt prey density is also directly and indirectly related to south Delta exports. Second, an annual index of smelt prey is a very crude way to analyze the effects of prey through the various life stages of smelt or its annual abundance indices.

  • “Density dependence was an important factor affecting survival from fall to summer, summer to fall, and fall to fall.” First, there is little or no evidence that high densities reduce recruitment or survival, at least in the period of record. Historically, available habitat had to limit the population size and recruitment near their highest abundance levels. Second, there is also no evidence that very low population levels lead to higher survival, growth, or abundance (from less crowding and competition). These are the two features that generally contribute to density-dependent population regulation. What the authors term density-dependence is simply the fact that more adults lead to more young, and more young lead to more adults. Water management and use lead to fewer adults and young – density independent population regulation controls population abundance.

  • “This finding indicates that density dependence must be accounted for in analyses directed at identifying factors that are important to the abundance of delta smelt.” This only means that any factors that lead to fewer adults or young damages the population, and that those losses are compounded across life stages. There are no remaining compensatory density-dependent capacity reserves in the population to absorb or counter such added mortality.

  • “There was some indication that average water temperature and calanoid copepod biomass (a general measure of prey density) in April–June were important contributors to survival of delta smelt from fall to summer.” Again, these are factors affected by water management. Delta exports pull warm water and invertebrates into the south Delta. These are density-independent factors.

  • “Furthermore, predation in April–June, representing the combined effects of water clarity and abundance of the predators, inland silversides, largemouth bass, crappie, and sunfish, was important to delta smelt survival from fall to fall.” Again, the effects of predation are increased by the warmer, clearer water pulled into the interior Delta by south Delta exports.

  • “Furthermore, in the case of delta smelt, not only does an effects hierarchy suggest the use of simple linear regression models, but the low sampling errors in abundance relative to process errors indicates that this simple and transparent method of analysis is an appropriate method for identifying environmental factors with direct effects. Therefore, at least for delta smelt and perhaps for other fish for which sampling errors in abundance are relatively low, simple linear regression, as an alternative to more complex life-cycle models, can produce informative results.” Such analyses have been inappropriately used to confuse interpretations of long-term environmental and fish population dynamics data, and to misinform and misdirect environmental resource management and regulatory processes, institutional and public awareness, and the public’s confidence in these societal and cultural institutions.

Summary and Conclusions

Miller et al. (2012), the “scientific” paper referenced in this post, is an example of efforts on the part of state and federal water contractors to point the blame for resource declines on factors other than water operations that overuse and abuse public trust resources. It is important not only in itself, but also because it combines with similar efforts to become part of a body of alternative “science” that is cited by water suppliers and managers in repetition of the narrative that water operations have minimal effect on the Delta smelt’s decline.

I recognize that such efforts may appear in “peer reviewed” journals, and can be sincere efforts to contribute to the understanding of the science underlying resource management. I am simply registering the need for caution and consideration of the source and the content of all analytical and interpretive efforts related to information used by those responsible for protecting our public trust resources.

Figure 1. Delta smelt spawner-recruit relationship. Figure generated by Tom Cannon.

Figure 2. Delta smelt survey catch pattern from mid-June 2012, one of the last surveys with an abundance of larval smelt produced from the strong 2011 brood spawning population. The red lines show the approximate location of the upstream location of X2 (low salinity zone).

Figure 3. Typical dry year spring-summer tidally-filtered (net) or daily-average hydrology for the Delta, showing net flow rates toward south Delta export pumps.