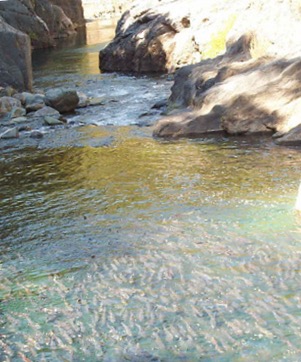
Photo of adult spring run salmon in upper Butte Creek canyon in summer awaiting fall spawning. Source: California Department of Fish and Wildlife (CDFW).
Butte Creek supports the largest population of spring-run Chinook salmon in California’s Central Valley.1 The recovery of Butte Creek spring-run salmon is one of the few modern success stories in the Sacramento River watershed. Efforts to restore fish passage and river habitats over the past several decades have paid off quite remarkably, but those efforts are now in jeopardy due to the recent drought and impending changes in water management in the Central Valley and Butte Creek.2
Butte Creek drains a portion of the mountains southwest of Mt. Lassen, on the east side of the Sacramento Valley (Figure 1). The creek’s steep canyon and falls prevent spring-run salmon from passing upstream of Quartz Bowl Pool. Spring-run spawn in about 13 miles of creek downstream of Quartz Bowl from mid-September through October. The adults arrive in the spawning area from about March through May or June. They hold in the deep pools in Butte Creek over the summer until they spawn in the fall. Fall-run salmon ascend the creek on high flow events at any time from September through December. However, CDFW intentionally blocks fall-run from migrating upstream of Parrot-Phelan Dam (location T6 in Figure 1), in order to prevent fall-run from interbreeding with spring-run and from spawning on top of redds that spring-run have already created.
The Butte Creek spring run has increased over the past 30 (Figure 2) in response to extensive active management. The Central Valley Project’s Anadromous Fish Restoration Program and the CalFed Program funded and implemented many fish passage projects and habitat improvements, in cooperation with DFW and local landowners. These programs purchased key properties, screened water diversions, constructed fish ladders, and restored floodplain habitats. PG&E improved management of its DeSabla – Centerville Hydroelectric Project at the upstream end of salmon habitat, increasing flows in the upper seven miles of Butte Creek’s salmon habitat and implementing focused management of the cold water that the hydro project moves through canals from the West Branch of the Feather River into Butte Creek. management improvements. DFW jump-started the recovery of Butte Creek spring-run by stocking spring-run smolts from the Feather River Hatchery in Butte Creek in the mid-1980s. Over that past ten-plus years, PG&E has funded CDFW to closely monitor salmon in Butte Creek.3
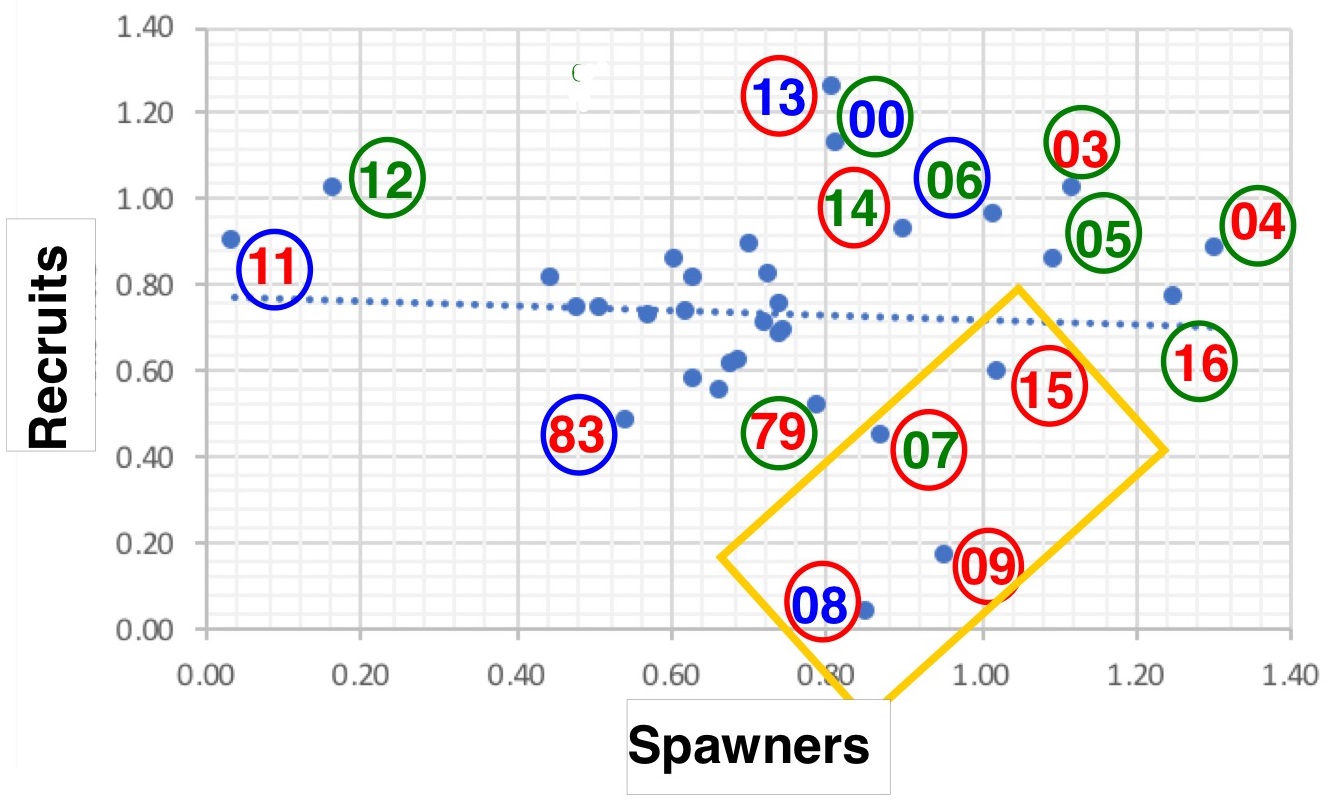
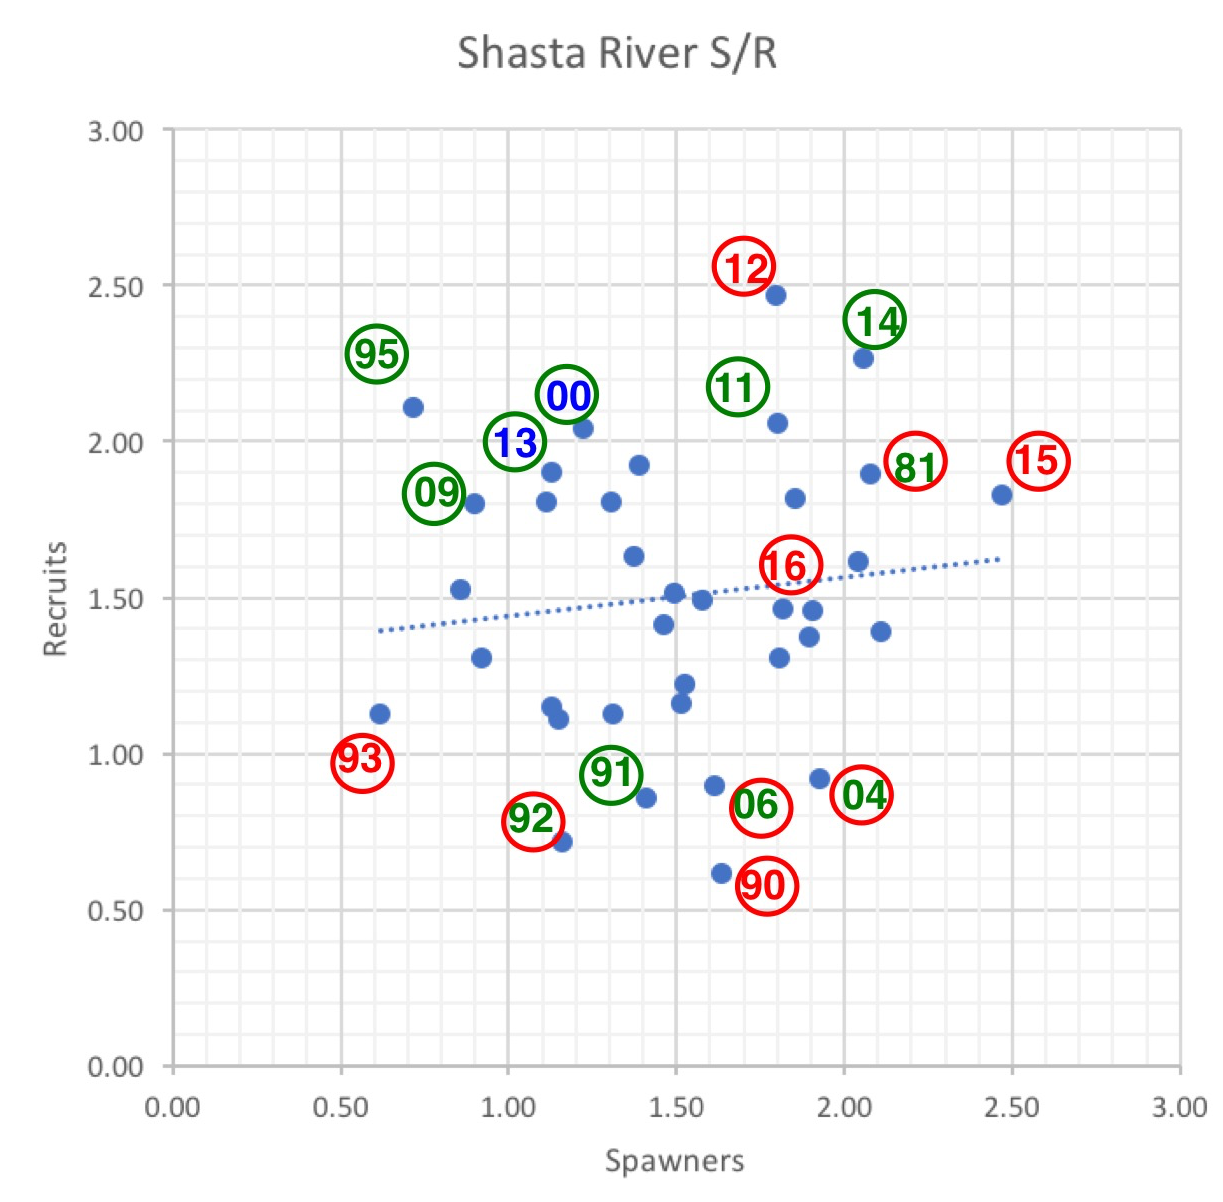
I took a close look at the recruit-per-spawner relationship (Figure 3) to portray long-term trends and factors related to success. The key findings are as follows:
- There is a strong positive recruit-per-spawner relationship with strong time (year) component – recruitment has increased steadily over the years with the buildup of the population.
- Recruitment per spawner was stronger for brood years with good conditions during critical time periods: fall spawning for their parents, winter-spring rearing and emigration, and subsequent over-summering holding conditions prior to their spawning.
- The initial stronger runs in the mid- to late-1980s (1986, 1988, and 1989) were jump-started with the initial stocking of Feather River hatchery smolts from 1983-1985 and optimal migration, summer holding, spawning and rearing conditions in the very wet years in the 1982-1986 period.
- The runs were again depressed during the extreme drought years of 1990-1992, only to recover and expand in the 1993-1999 period of wet years.
- Recruitment in 1984, 1985, 1999, and 2008 likely suffered from redd scouring in late fall (Nov-Dec) floods of 1981-1983, 1996, and 2005 (Figure 4).
- Recruitment per spawner in 2015 was poor due to drought rearing and migration conditions in winter-spring 2013, poor ocean conditions in 2014-15, and poor adult migration and over-summering conditions in 2015. In contrast, the 2016 recruitment per spawner was much higher, likely because of better adult migration and over-summer holding conditions (the drought had broken in 2016).
Present management focuses on protecting over-summering adults, primarily by ensuring they have adequate cool water to sustain them until fall spawning. This is not possible without the cool water from the West Branch of the Feather River provided by the PG&E hydro project near Paradise, CA. The future of that project and the Butte Creek spring run salmon are now in limbo.
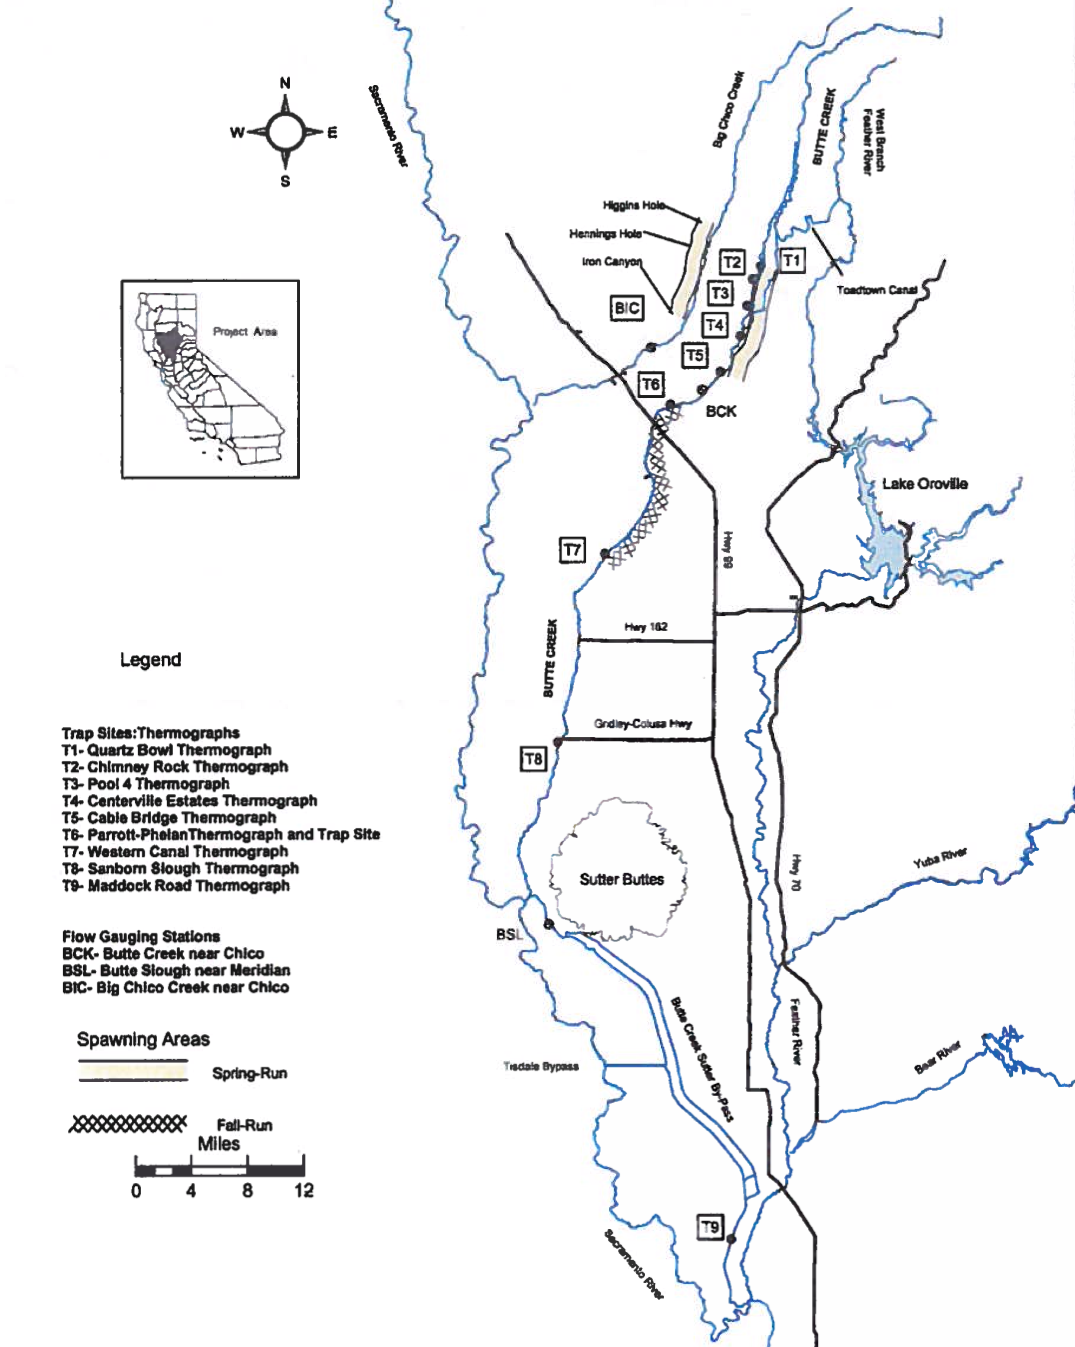
Figure 1. Butte Creek spawning and monitoring locations for spring-run and fall- run salmon. Spring salmon can reach as far upstream as Quartz Bowl (T1). CDFW intentionally blocks fall-run at the Parrot-Phelan Dam (T6). Juveniles emigrate from spawning grounds in Butte Creek to the Sacramento River (below T9) via Butte Slough, the Sutter Bypass canals, and various other natural and man-made channels in the Butte Sink, west of the Sutter Buttes Source: CDFW.
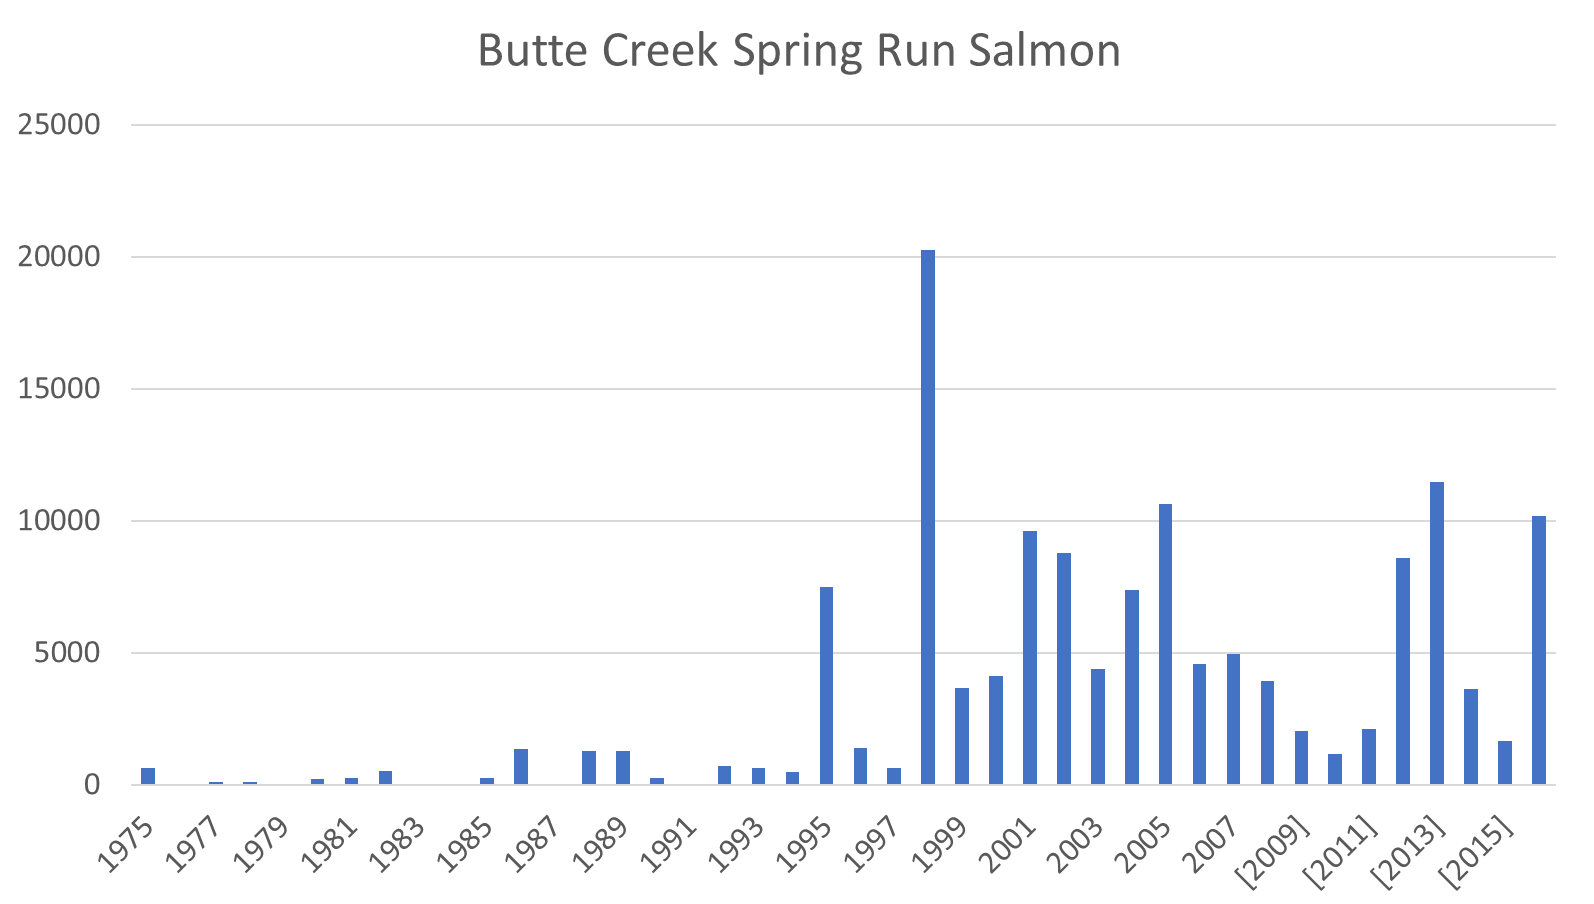
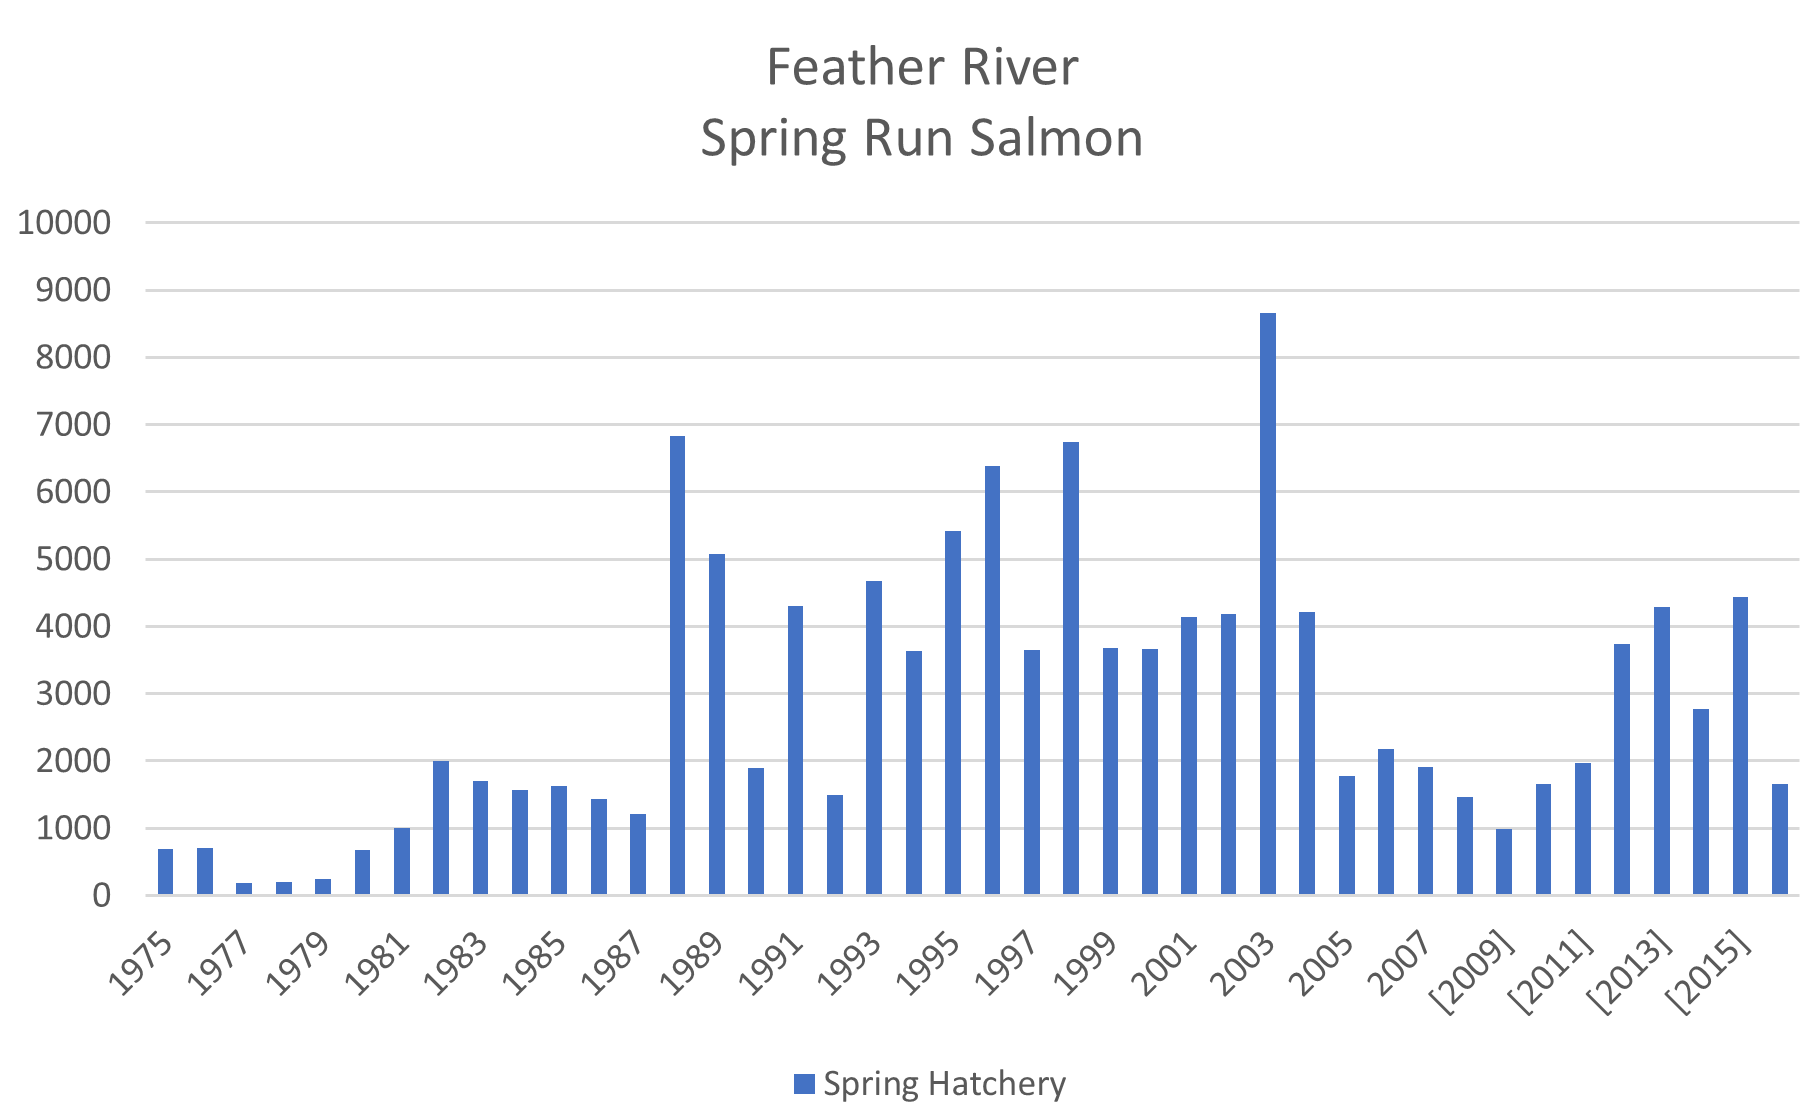
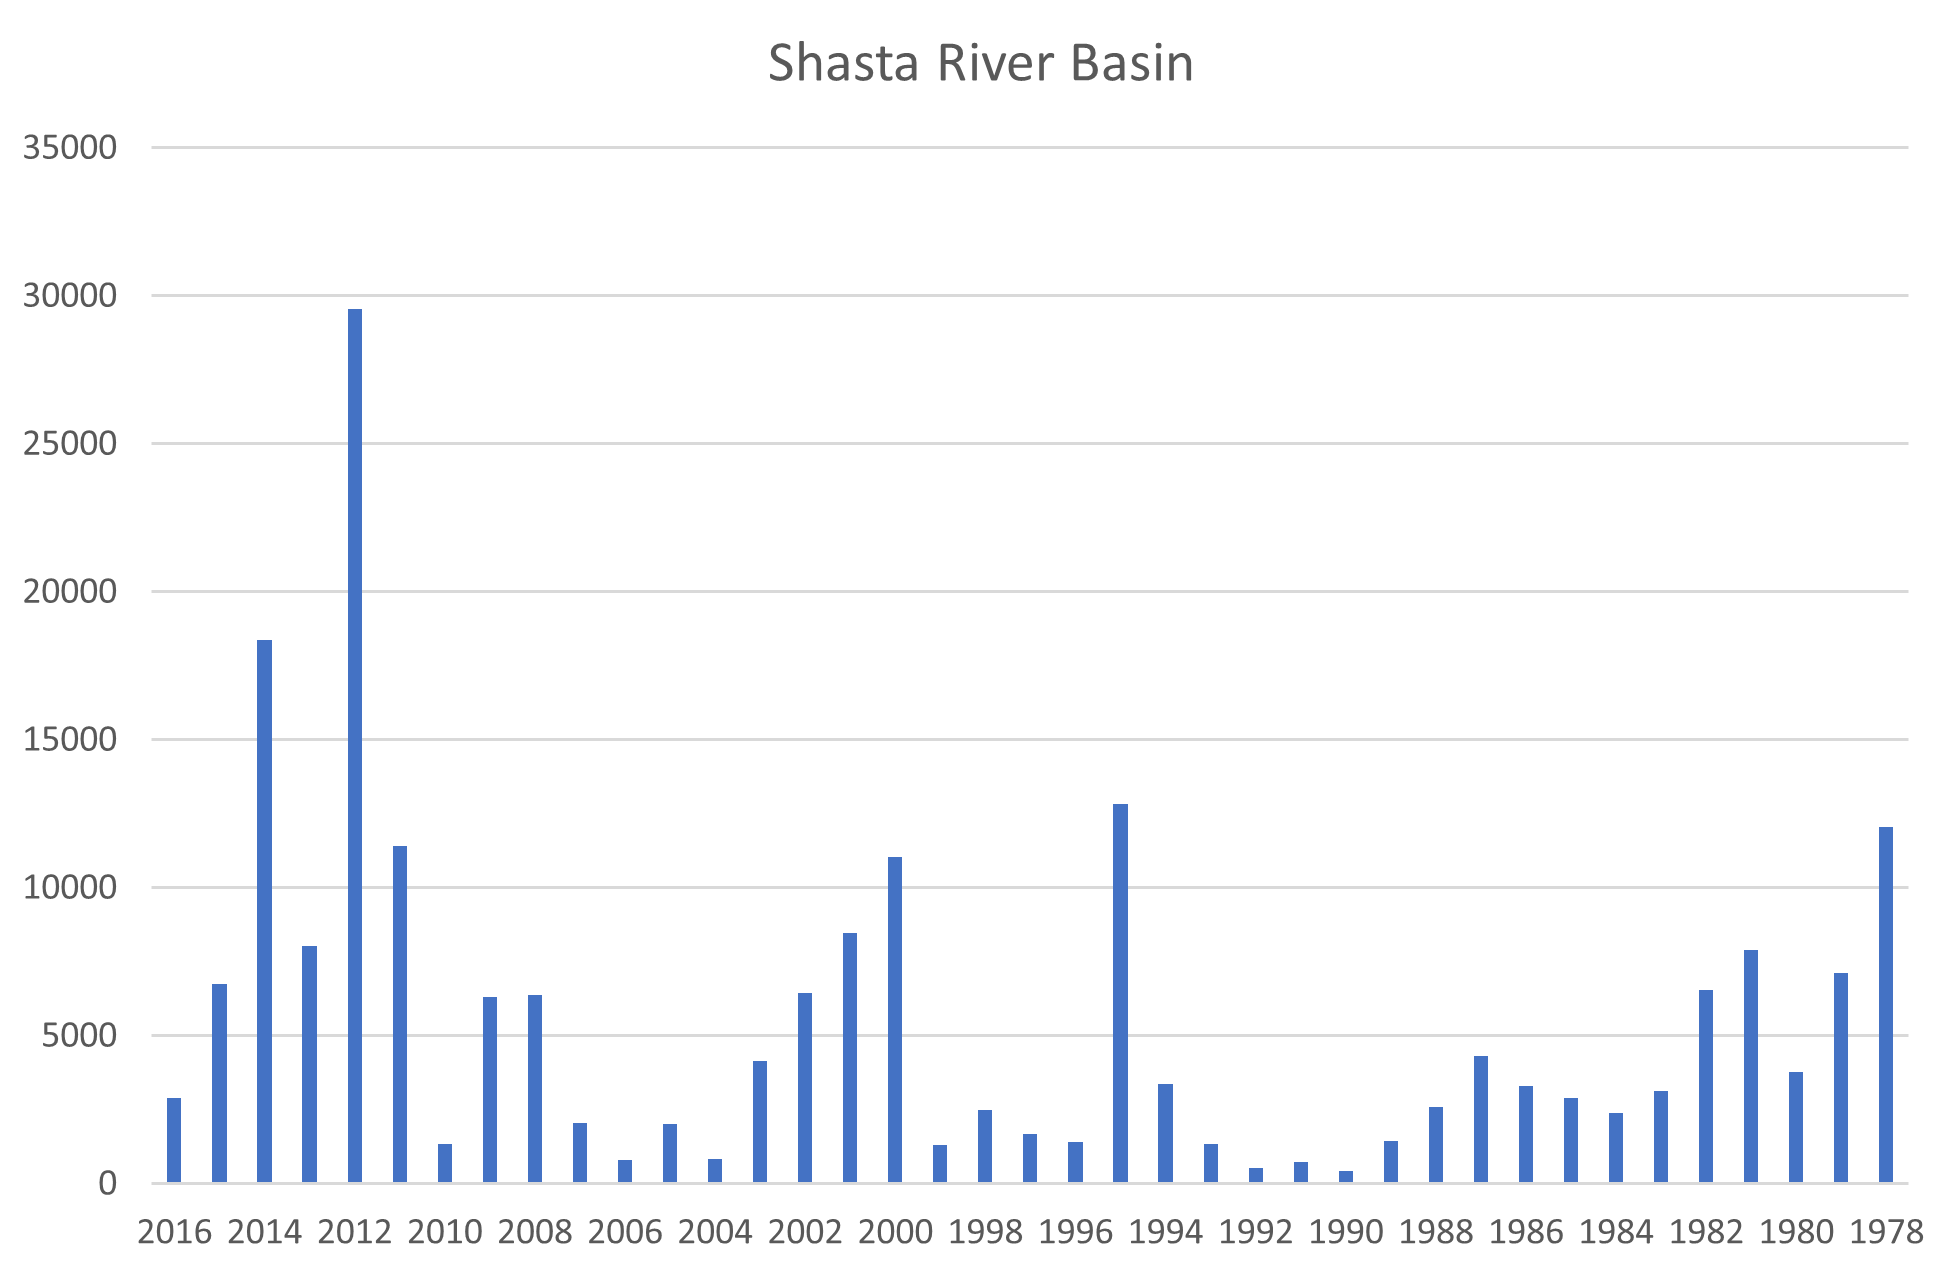
Figure 2. Escapement estimates (spawners) observed in the spawning reach of Butte Creek from 1975-2016. Source: CDFW GrandTab.
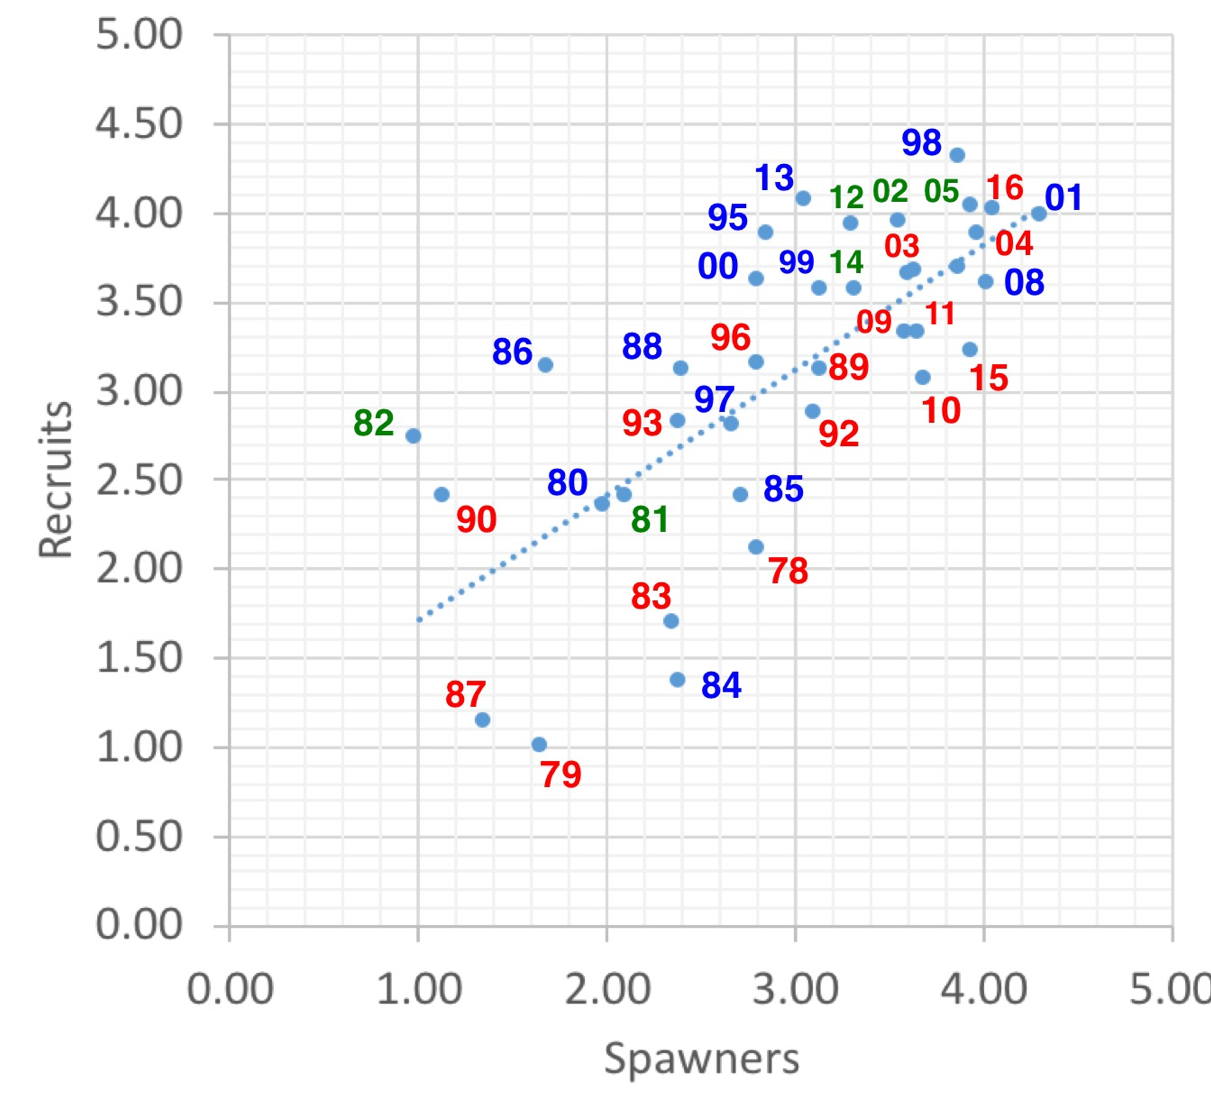
Figure 3. Recruit-spawner relationship for Butte Creek spring-run Chinook salmon (log10 transformed). Year noted is recruit year. Color red denotes dry year rearing (year two years before). Blue denotes wet year. Green is average or normal year. Conditions encountered during spawning can also affect recruit survival. For example high pre-spawn mortality can occur that detracts from escapement estimate. Examples include 1987, 1992, 2003, 2008, and 2015.
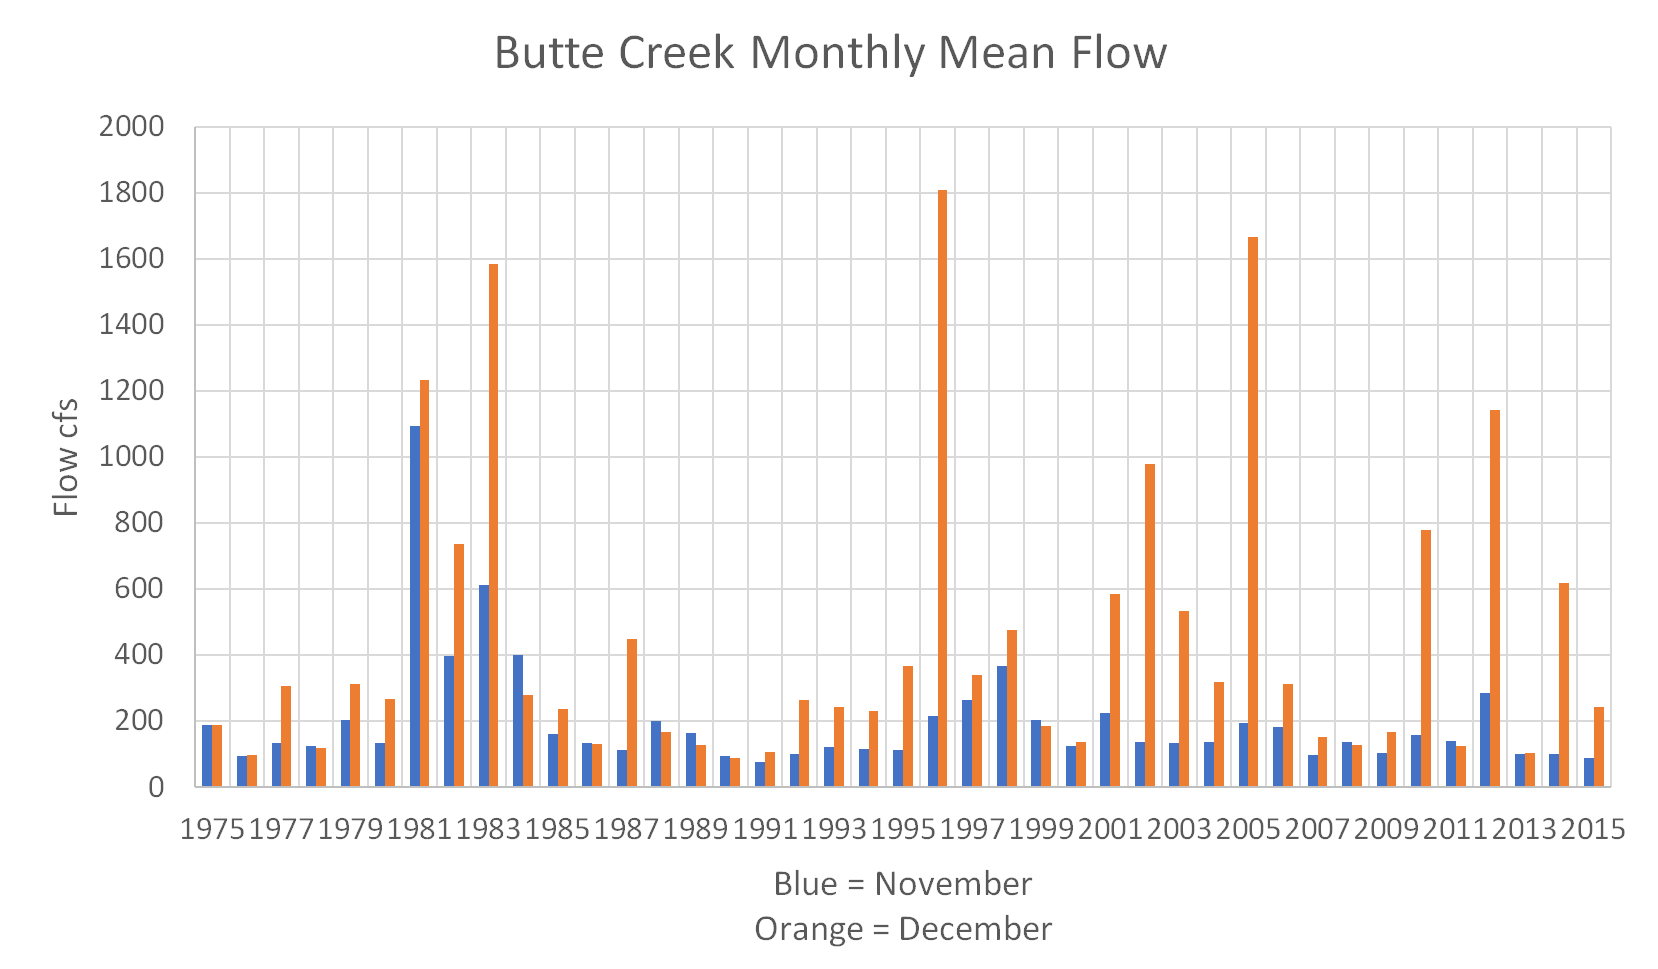
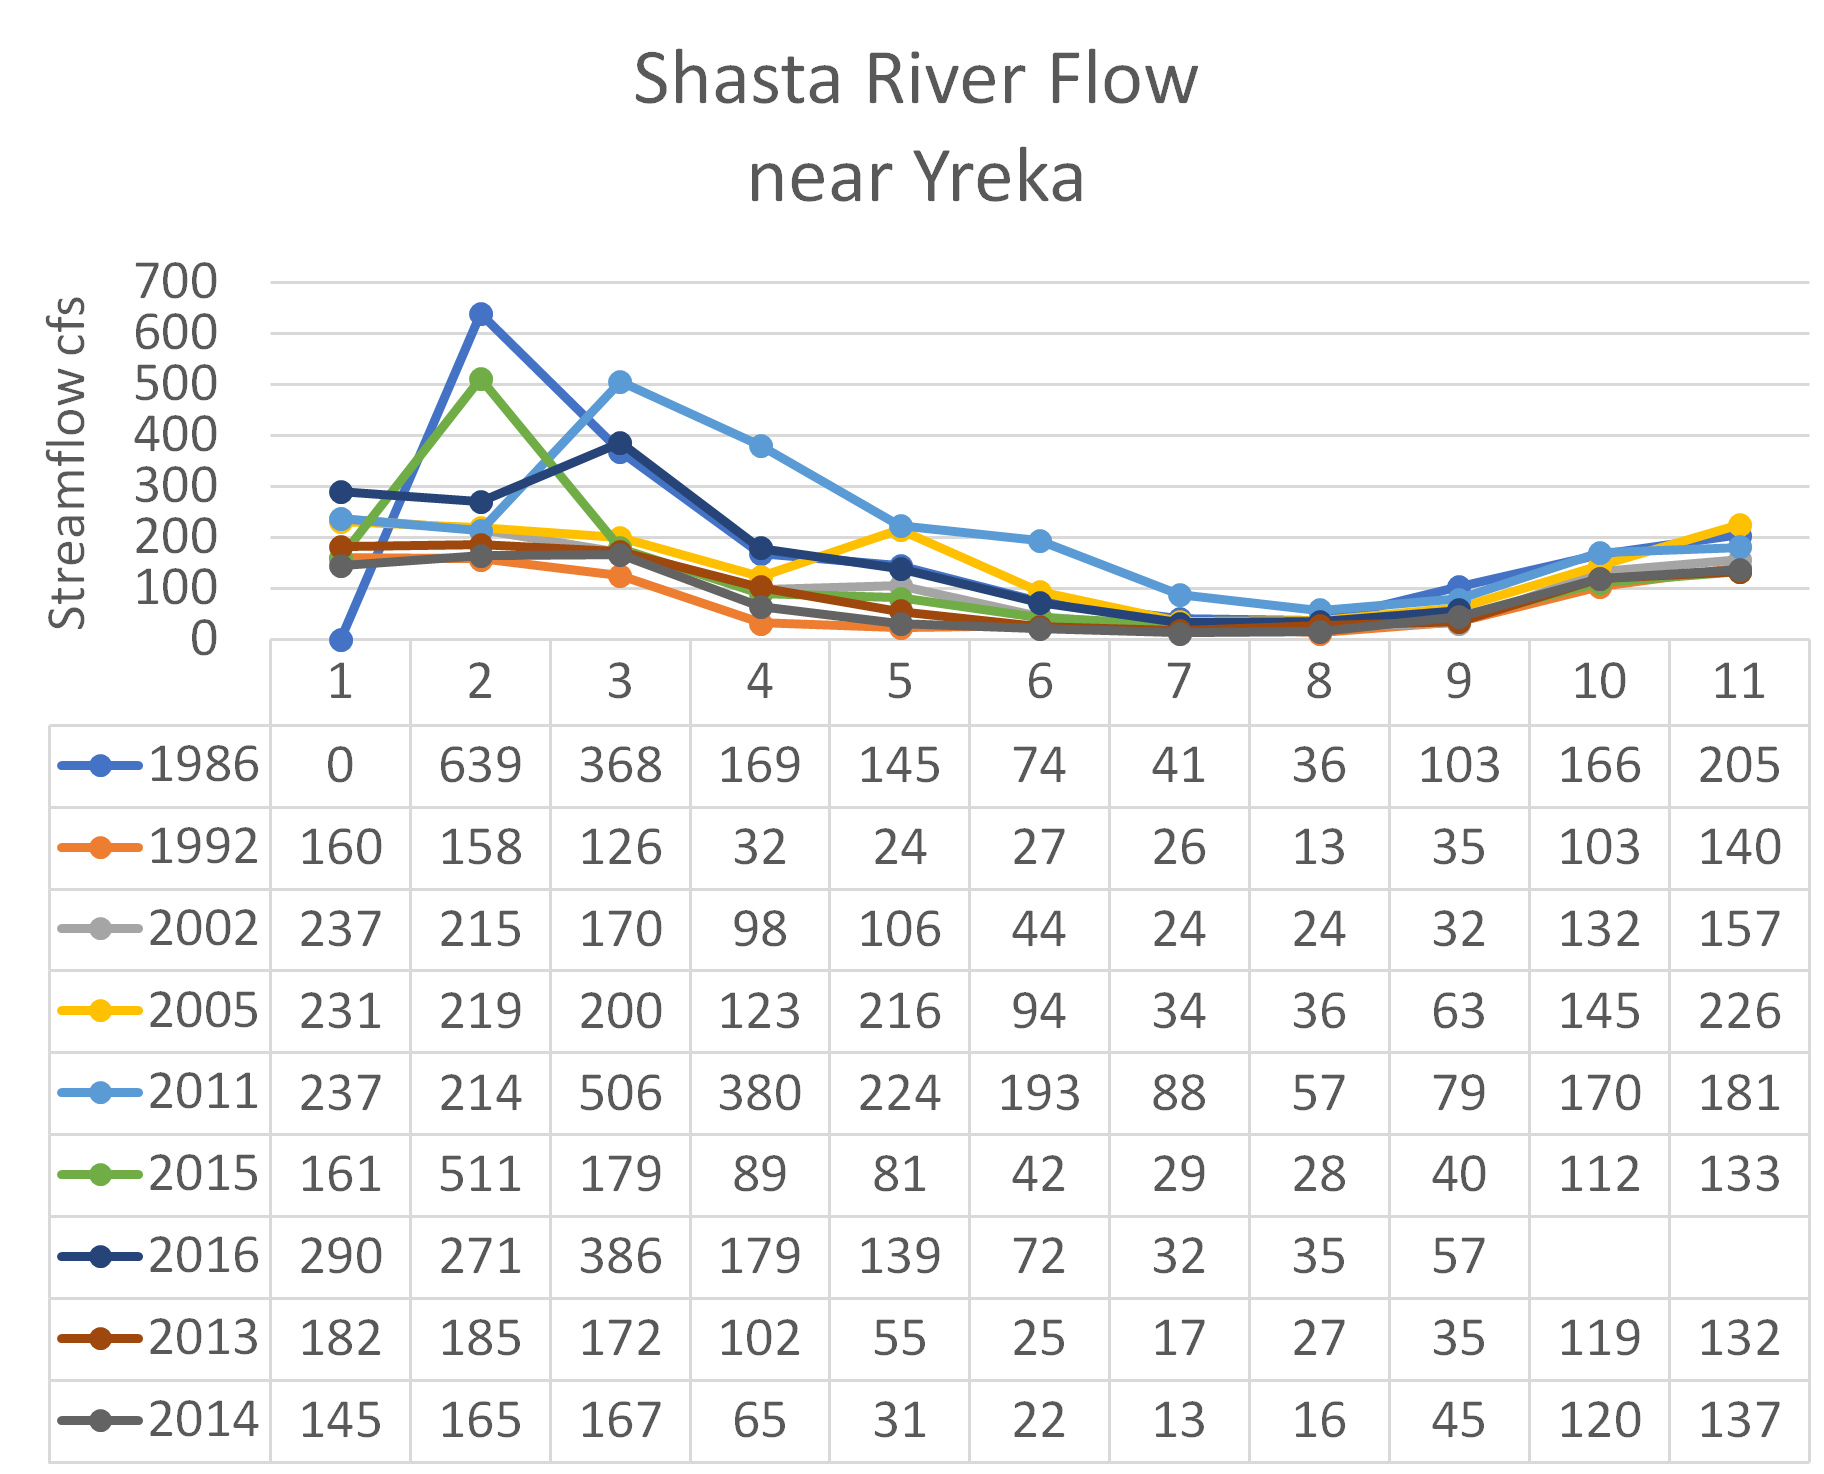
Figure 4. Mean monthly flows in Butte Creek as measured at Chico, CA. Daily flows were high – up to 4600 cfs in Nov-81 and 5000 cfs in Dec-81, and 11,000 cfs in Dec-05.