 At its November 2016 Bay-Delta Science Conference, the Delta Science Program addressed salmon survival in the Delta..
The focus of this post is:
PART 1: EFFECTS OF WATER PROJECT OPERATIONS ON JUVENILE SALMON SURVIVAL IN THE DELTA: LITERATURE AND DATA REVIEW. Presenter: Dr. Rebecca Buchanan, Research Scientist with the University of Washington.
The presentation was summarized in Mavens Notebook. Some of the findings are provided with comment below.
“While water export operations contribute to salmonid mortality by way of direct mortality at facilities, this does not account for the majority of the mortality of salmon in the Delta; and the contribution of various stressors to the high mortality is unknown.”
Comment: the contribution of low flows and associated predation and high water temperatures are known, as are effects of hindering migrations of salmon both upstream and downstream. The finding does not take into account salvage inefficiency, especially from Clifton Court Forebay pre-salvage loss, and loss in the south Delta from diverting these fish from their migration routes.
“There’s been some moderate evidence of a positive association between exports and survival through the Delta, based on Delta and ocean recoveries of wire tag data.”
Comment: There is no such evidence. The association is simply between high natural production and/or high hatchery releases on the one hand, and high salvage rates on the other.
“The E:I ratio is found to be useful in a stage-structured life cycle model by Cunningham; they did not find it to be useful for other runs of fish, however,” she said. “Newman and Rice found a small effect, but it was not statistically significant for fall run using code wire tag data.”
Comment: the E:I ratio does not reflect the role of the individual factors in the presence of the other. For example, the low-export/low-inflow scenario is a far different than a high-export/higher-inflow scenario with the same E:I ratio.
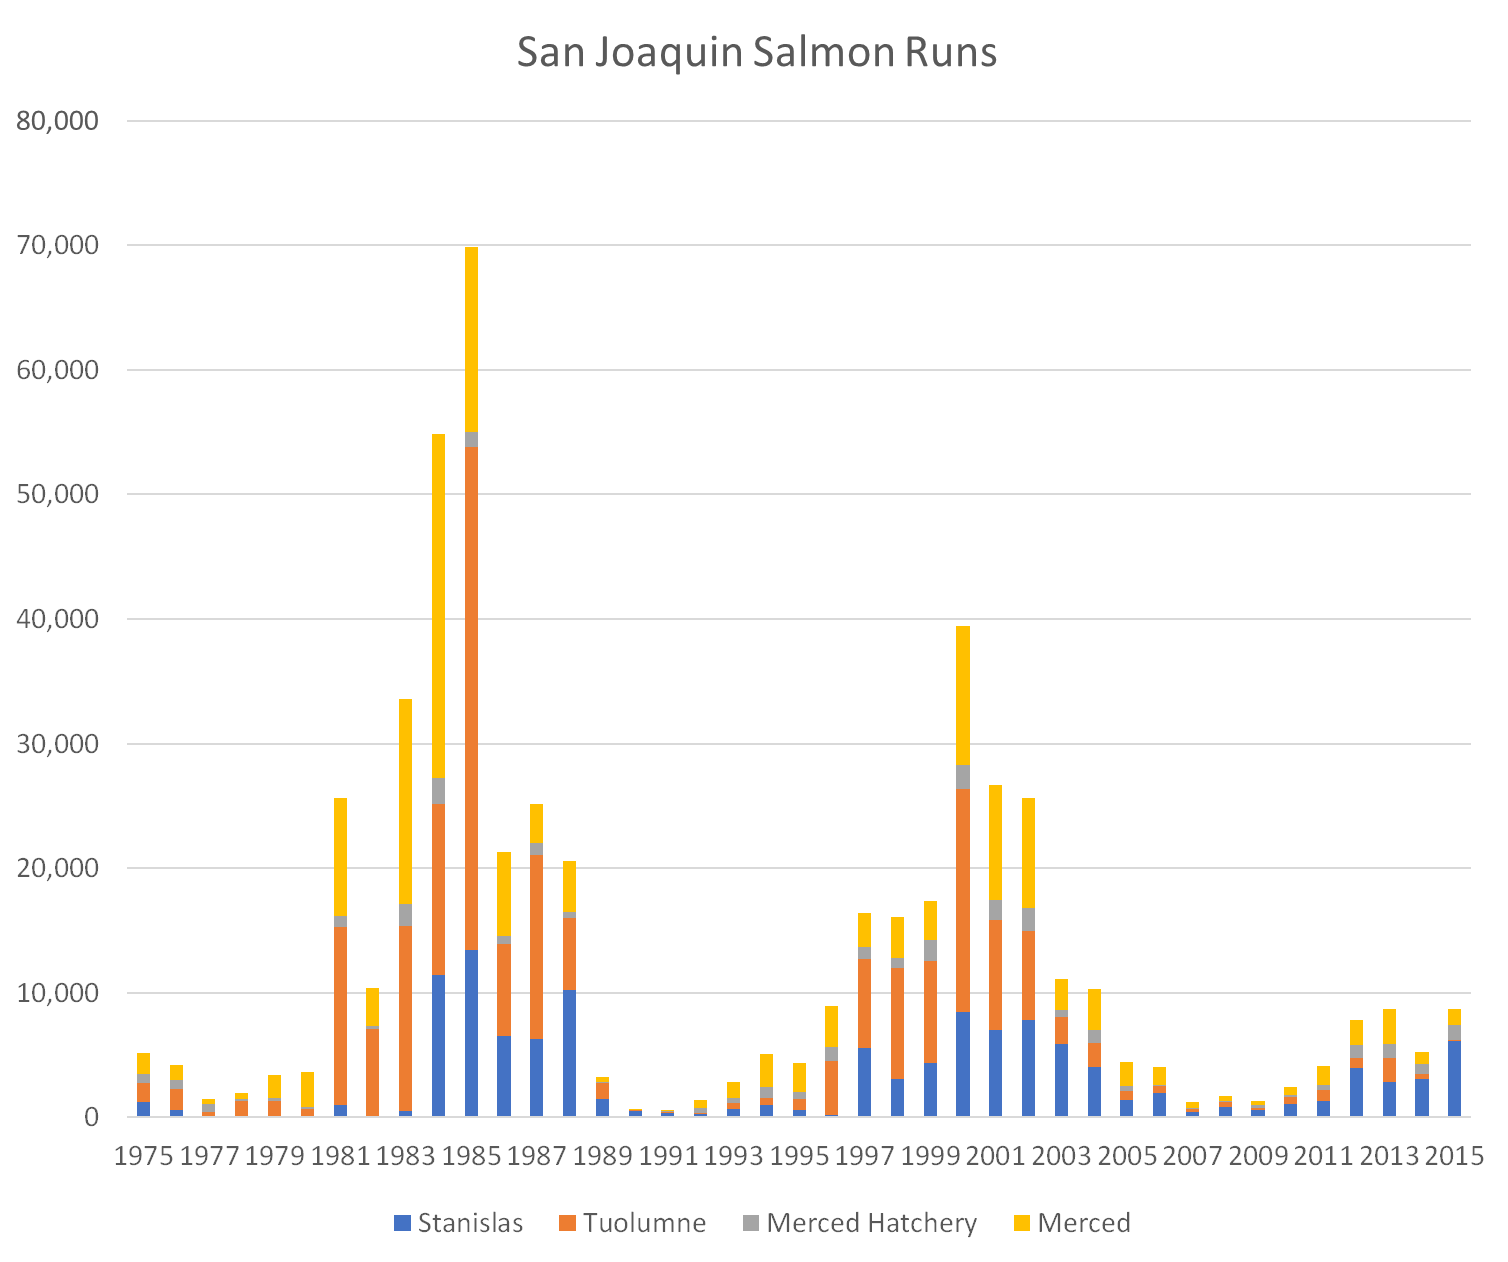
“Our primary finding was that salmon survival in the South Delta is low, which is not a big surprise; we knew it was low, but what was somewhat surprising is just how low it is and how consistently low it has been, especially for the San Joaquin fall run chinook”.
Comment: The low survival through the Delta has long been known from tag studies and low run size resulting from dry years, especially in the San Joaquin watershed. Low flows have long been associated with poor habitat conditions and high salvage losses in the Delta.
“Insufficient data on survival in Delta for steelhead, Sacramento River Chinook (all runs).”
Comment: There is a tremendous amount of data on the role of the Delta in the overall production of salmon in the Central Valley. Much of the analyzed effects points to droughts, low reservoir releases, low river flows, low Delta inflows and outflows, and direct and indirect effects of Delta exports. There is sufficient information to support and warrant OMR (exports restrictions) from fall through spring in NMFS’s biological opinion. There is also sufficient information to show that the restrictions do work, an analysis that was not conducted in the study.
“The tag studies that we have available to us represent only part of the life histories in populations that use the Delta, smelt-sized hatchery fish, so we’re missing the smaller fish and we’re missing the wild fish”.
Comment: This is true. Tagging/release of springtime fall run smolts represents a limited fall run life history group forced to navigate the Delta later than they would in the wild. At minimum, a majority of emigrants would naturally leave earlier.
“I haven’t been talking about mechanisms that might explain indirect effects of water project operations on mortality in the Delta, but we did identify some possible mechanisms, and we didn’t find much research on that, so there’s a need for some work there.”
Comment: Indirect effects include water temperature effects, flow effects, habitat effects (e.g., location of X2), predators, etc. There has been much research on these effects, including substantial research on salmon.
“Formal analysis of relationships between inflow, exports, I:E and survival is incomplete for existing data, especially on the San Joaquin.”
Comment: Formal analyses have been conducted over the past half century. All these analyses have led to the same conclusion: salmon survival is low when through-Delta flows are low, when exports are high, and when salmon salvage is high.
“Even when we have those analyses done, there will still be some constraints on our understanding. One, all of the observations that we have are in the presence of the management operations, which is understandable, but it does make it difficult to assess their effectiveness because we’re lacking control and we’re lacking variability in the conditions; without that variability, it’s very difficult to identify a relationship. We also don’t have very many observations at higher levels of exports or inflow. The low overall survival makes it difficult to detect changes in survival because of low effect of sample sizes and the high uncertainty in the results.”
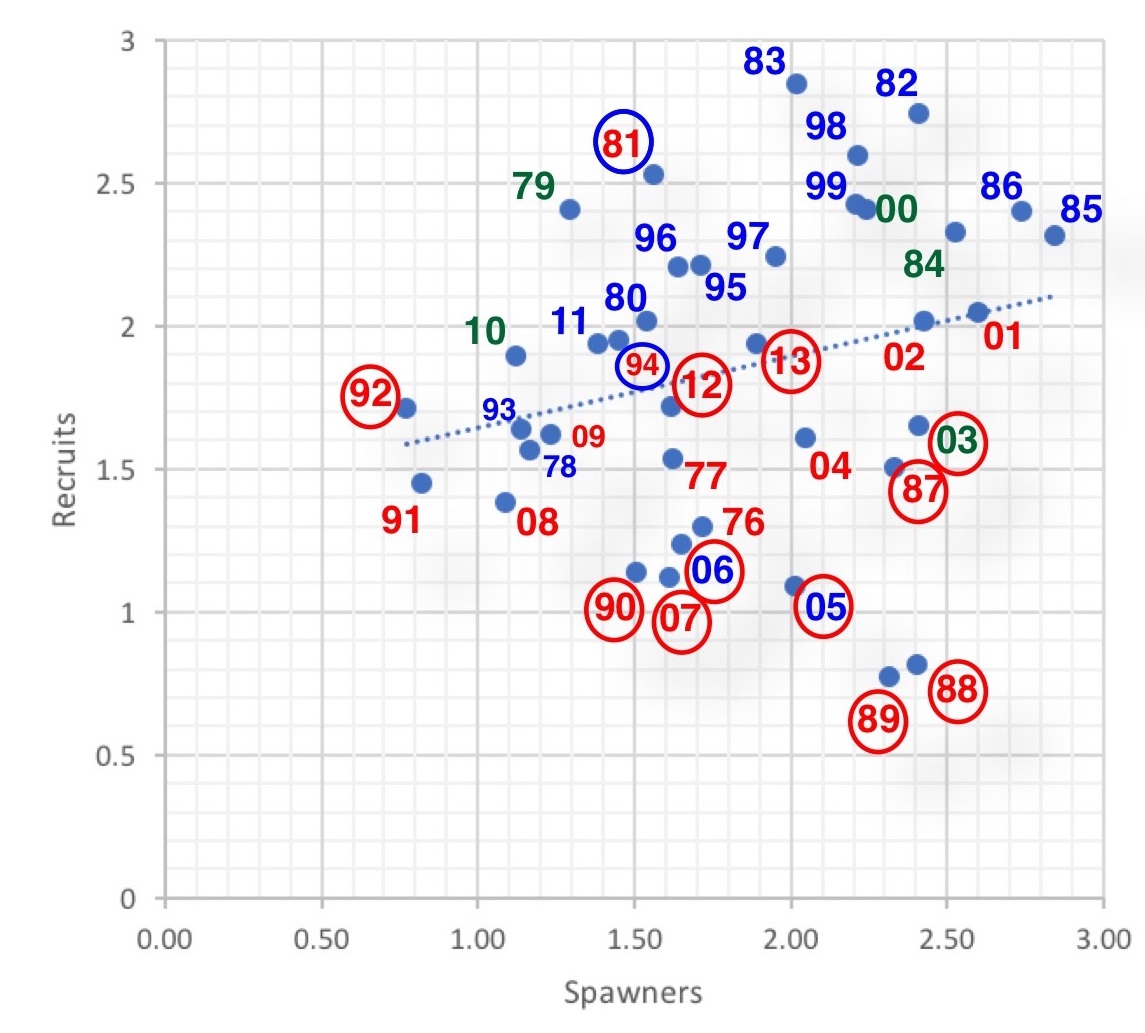
Comment: Again, the available information and analyses are extensive. The range of observed conditions is wide. The range of survival and recruitment into the populations is also wide. These statements are little more than excuses offered to sustain additional decades of the present review process that is reluctant to state conclusions and even more reluctant to take appropriate management action. There has been minimal analysis that highlights the beneficial effects of actions required in the 2009/11 Biological Opinion. The requirements of the Biological Opinion led to significant reductions in winter exports. These reductions have had a marked positive effect on the survival of salmon through the Delta.