
Last winter I warned about DWR jumping the gun on December Delta exports before storm runoff hit the Delta (Whoa on the Delta Exports DWR). Well they have done it again. Knowing full well that this year’s few remaining smelt and winter -run salmon smolts are in or soon to be in the Delta, DWR has ratcheted up Delta exports several days before the anticipated storm runoff hits the Delta (Figure 1 and 2).
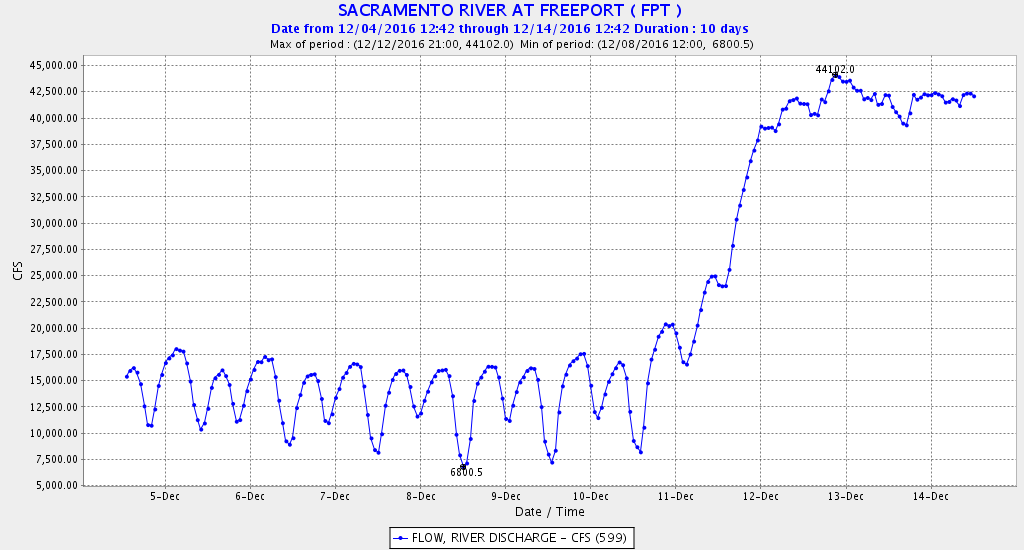
Figure 1. Delta inflow at Freeport 12/5-12/14, 2016. Source: CDEC.
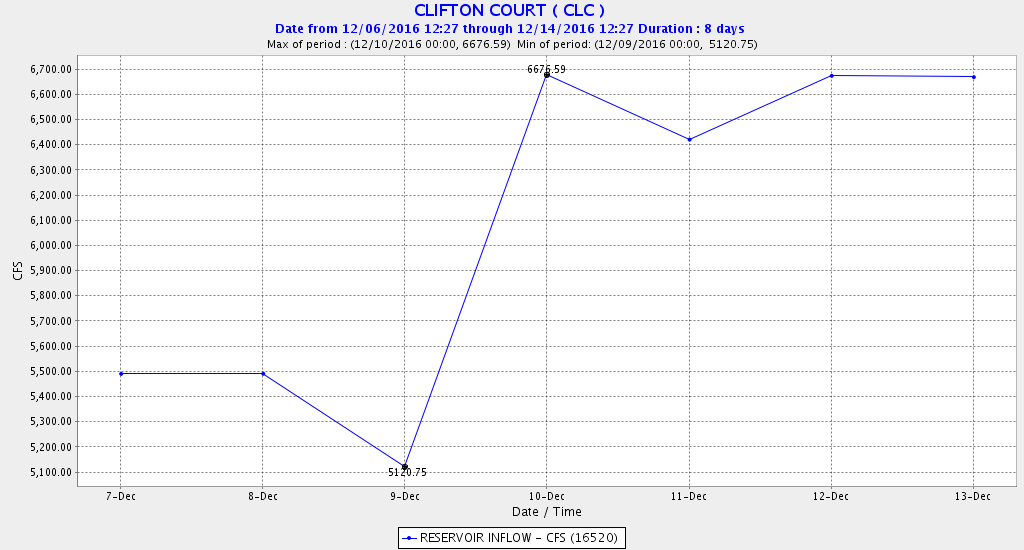
Figure 2. State Water Project daily average exports from Delta at Clifton Court Forebay 12/7-12/13, 2016. Maximum export rate for the State Water Project is 6676 cfs.
Their action has resulted in the movement of the Low Salinity Zone, X2, and brackish water upstream into the Delta. Old and Middle River (OMR) flows toward the south Delta export pumps have increased to their near maximum of -10,000 cfs (Figure 3), which draws brackish water from the Bay up into the Delta (Figure 4). The influx of brackish water is detrimental to water supply and fish habitat. Furthermore, high exports and negative OMR flows can draw juvenile salmon and adult smelt to the south Delta export pumps.
Constraints on OMR negative flows for winter-run salmon do not kick in until January. December limits on exports do not apply until salvage numbers of salmon rise. Salvage has not increased this year because the number of wild smolts produced is very low and hatchery smolts have yet to be released.
OMR constraints for Delta smelt should kick-in in December under present circumstances according to the Smelt Biological Opinion:
Low-entrainment risk period: delta smelt salvage has historically been low between December 1 and December 19, even during periods when first flush conditions (i.e., elevated river inflow and turbidity) occurred. During the low-entrainment risk period, the SWG shall determine if the information generated by physical (i.e. turbidity and river inflow) and biological (e.g., salvage, DFG trawls) monitoring indicates that delta smelt are vulnerable to entrainment or are likely to migrate into a region where future entrainment events may occur. If this occurs, the Service shall require initiation of Action 1 as described in Attachment B. Action 1 shall require the Projects to maintain OMR flows no more negative than -2,000 cfs (14-day average) with a simultaneous 5-day running average flow no more negative than -2,500 cfs to protect adult delta smelt for 14 days.
The Smelt Working Group met on December 5 and determined:
The Working Group reviewed present Delta conditions and observed a lack of recent data regarding species distribution. The Working Group did not make a recommendation for OMR flows The SWG will monitor hydrology conditions and ongoing surveys this week and will reconvene to for the protection of Delta Smelt adults. However, members are concerned regarding today’s OMR flow (daily average of approximately -10,000 cfs) and how it could influence the future distribution of the species. .. The SWG expressed concerns regarding the current OMR flow (~-10,000 cfs), but with the expected reduction later in the week to -7,000 to -8,000 cfs, influence of the pumps would be expected to decrease.
Note in Figure 3 that OMR went more negative than -8,000 cfs by December 13.
Since there are few if any Delta smelt remaining in the Bay-Delta, it will be difficult to assess risk. Given that the OMR had fallen below -9,000 cfs after the December 12 meeting because of near maximum south Delta exports, we can only assume those present at that meeting determined the assessed risk to be low. We can also assume that Interior and the state are no longer concerned with the fate of Delta smelt, as they obviously have not been able to find any in their early surveys.
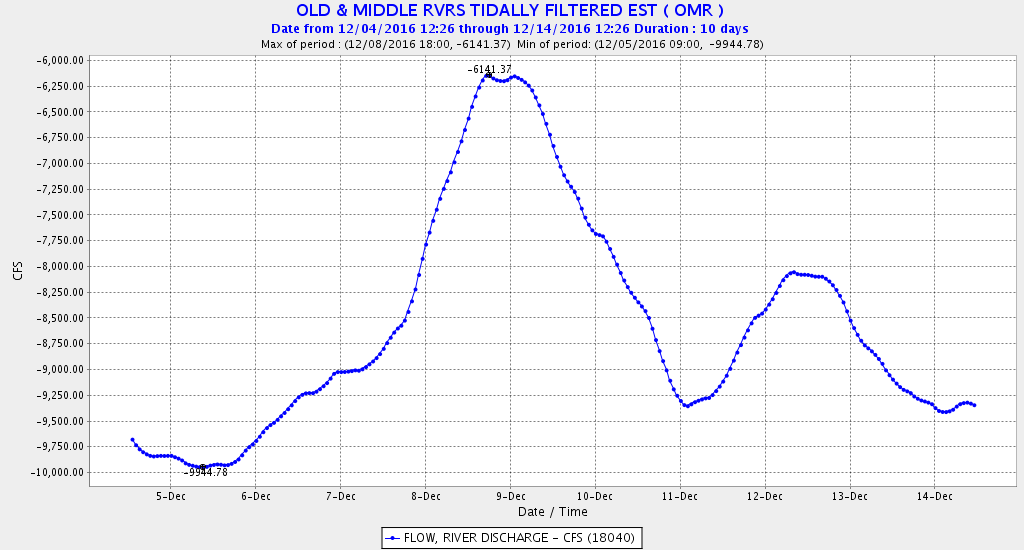
Figure 3. Tidally filtered flows in Old and Middle Rivers in the south Delta. Increasingly negative flows are caused by increasing south Delta exports. South Delta exports were 10,800 cfs on Dec. 5.
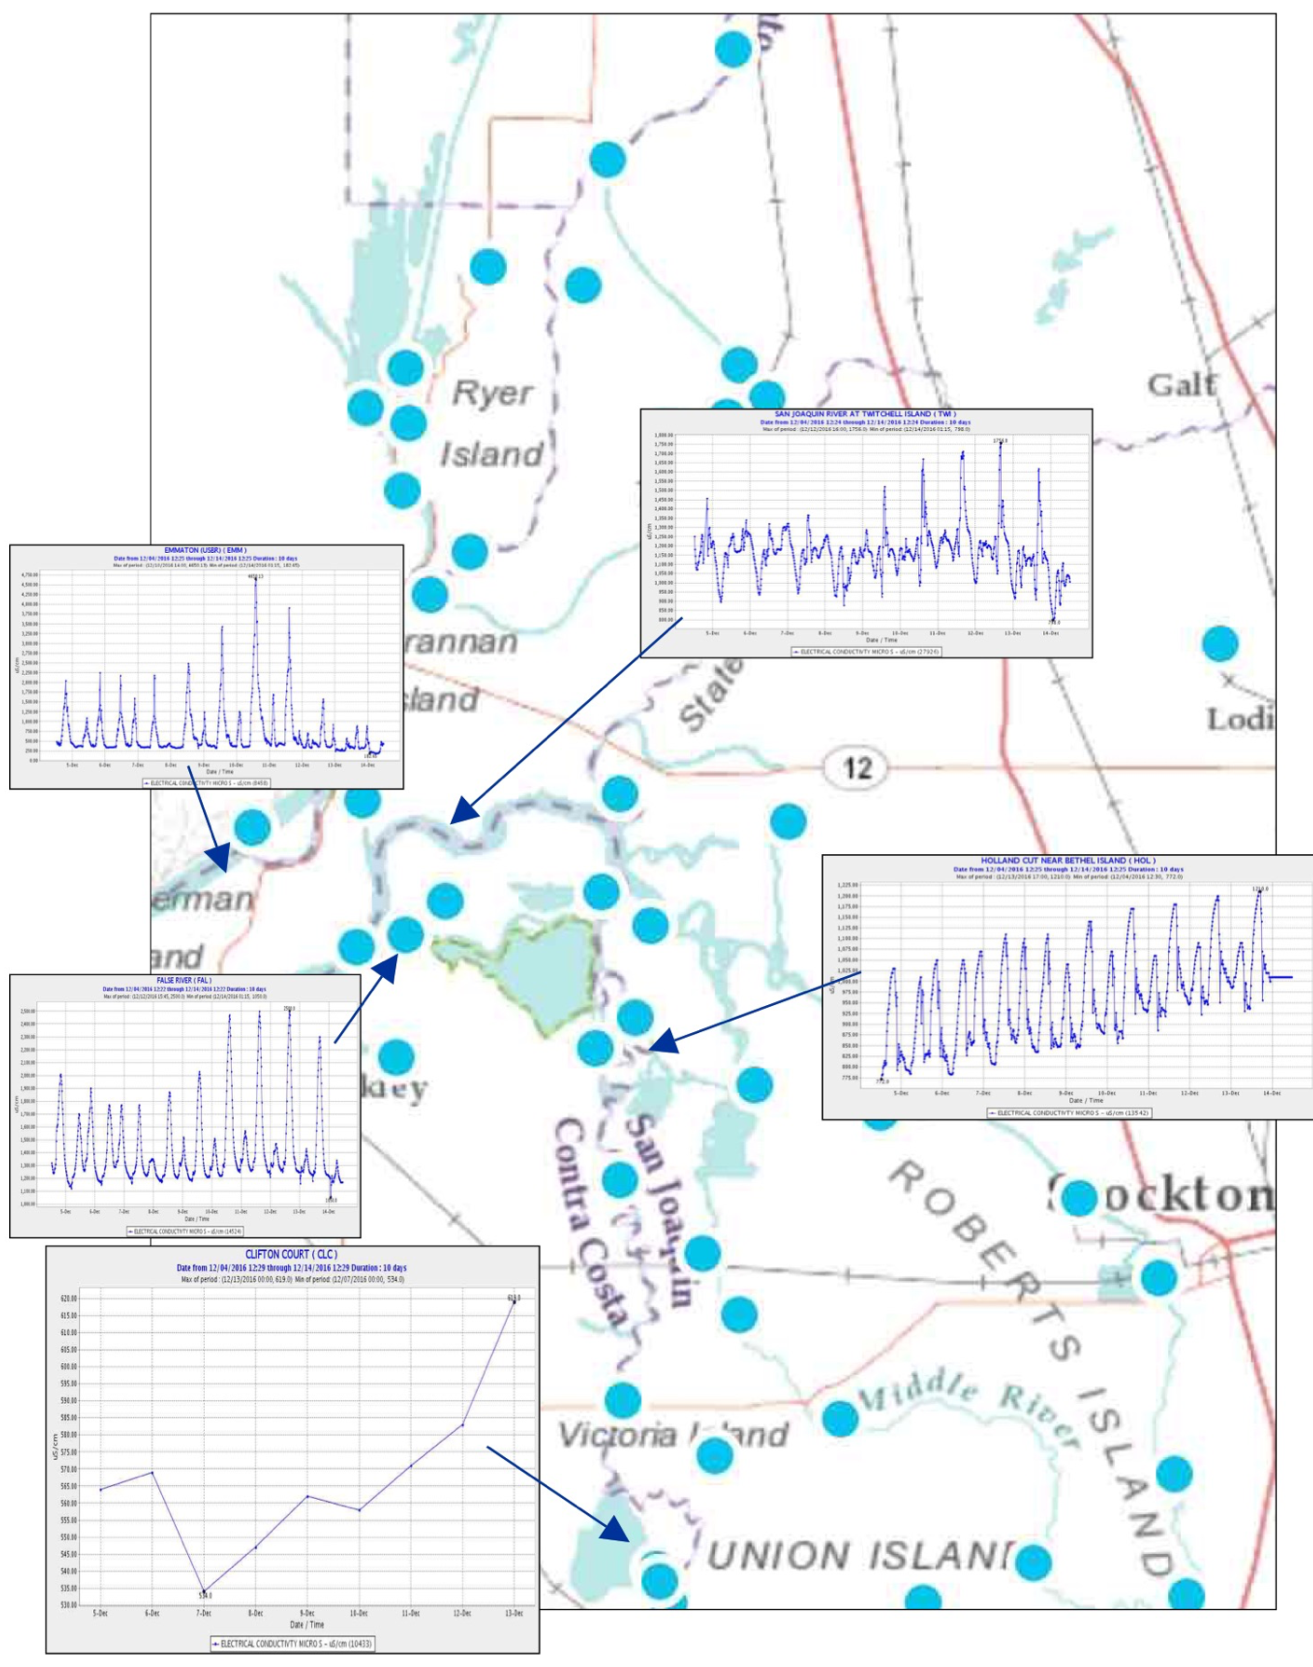
Figure 4. Rising salinity in December 2016 at selected Delta locations. Blue dots are CDEC gage locations. Note freshwater reaching the two northern locations on or about Dec. 13.