The prognosis for stripers was not good in 20151 after four years of drought. The normal water year in 2016 brought only minor improvement in recruitment of juveniles into the population, but recruitment remains near record lows (Figures 1-3). The wetter 2016 started with higher juvenile production, but that stalled by late spring. Striped bass salvage at south Delta export facilities showed typical patterns, with about 10% of the numbers salvaged in year 2000 and two primary peaks in salvage – late spring/early summer and late fall (Figure 4).
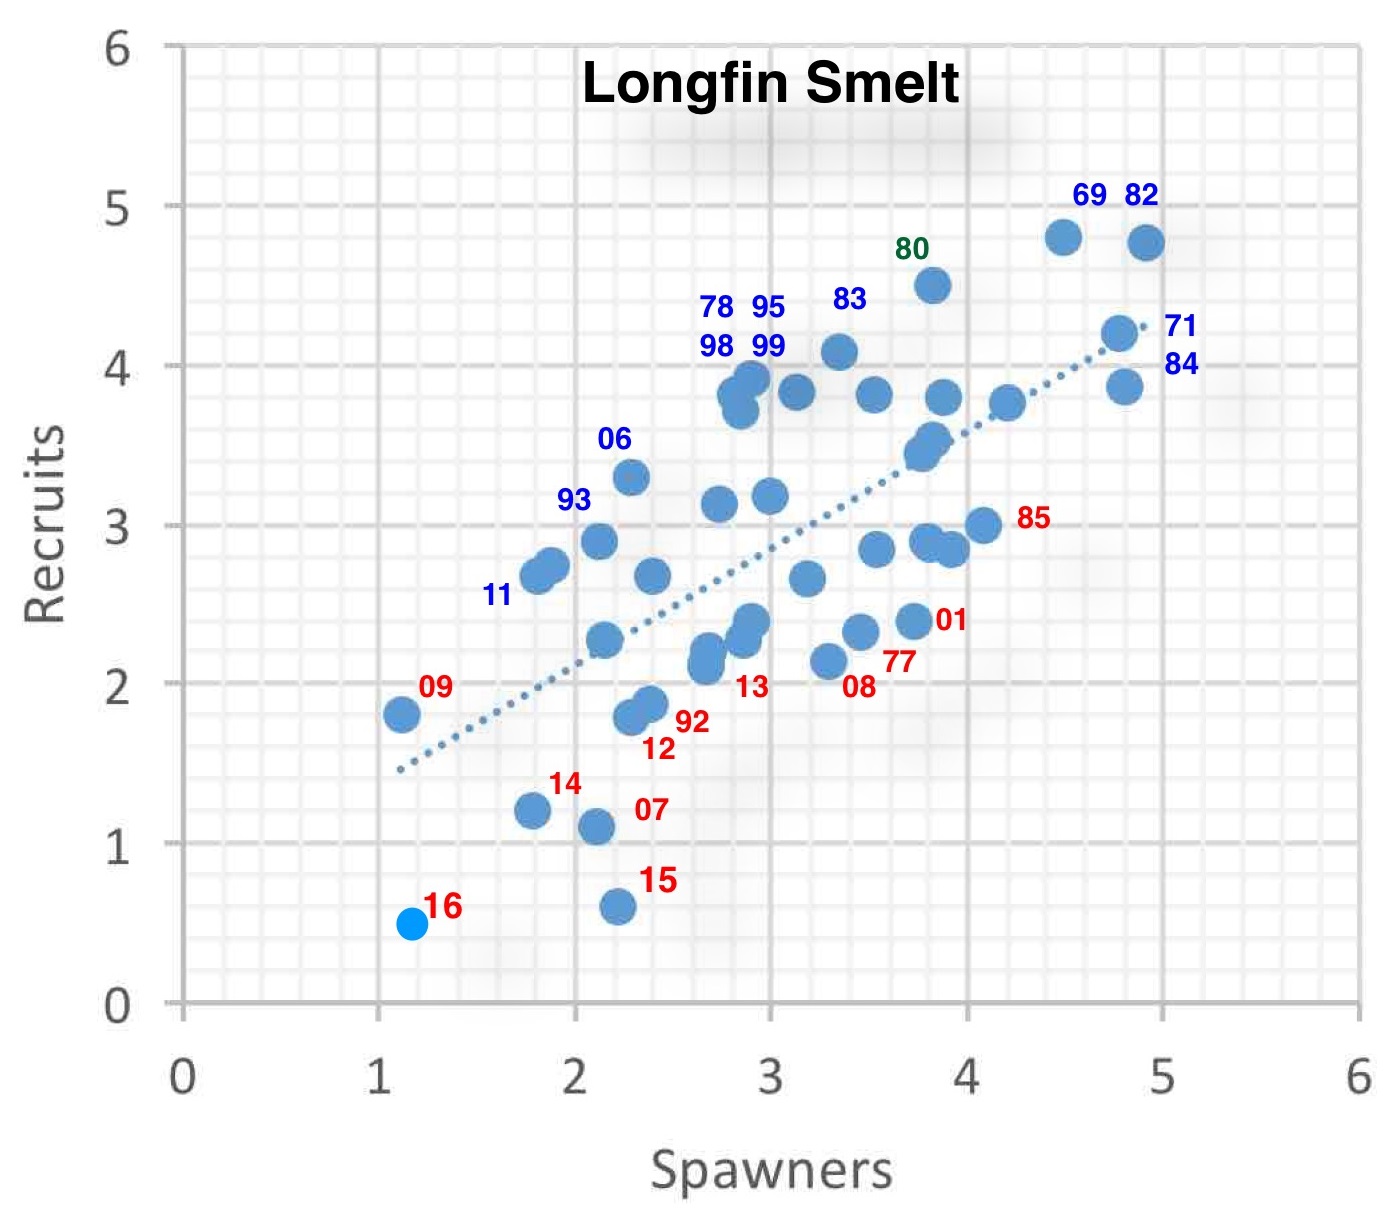
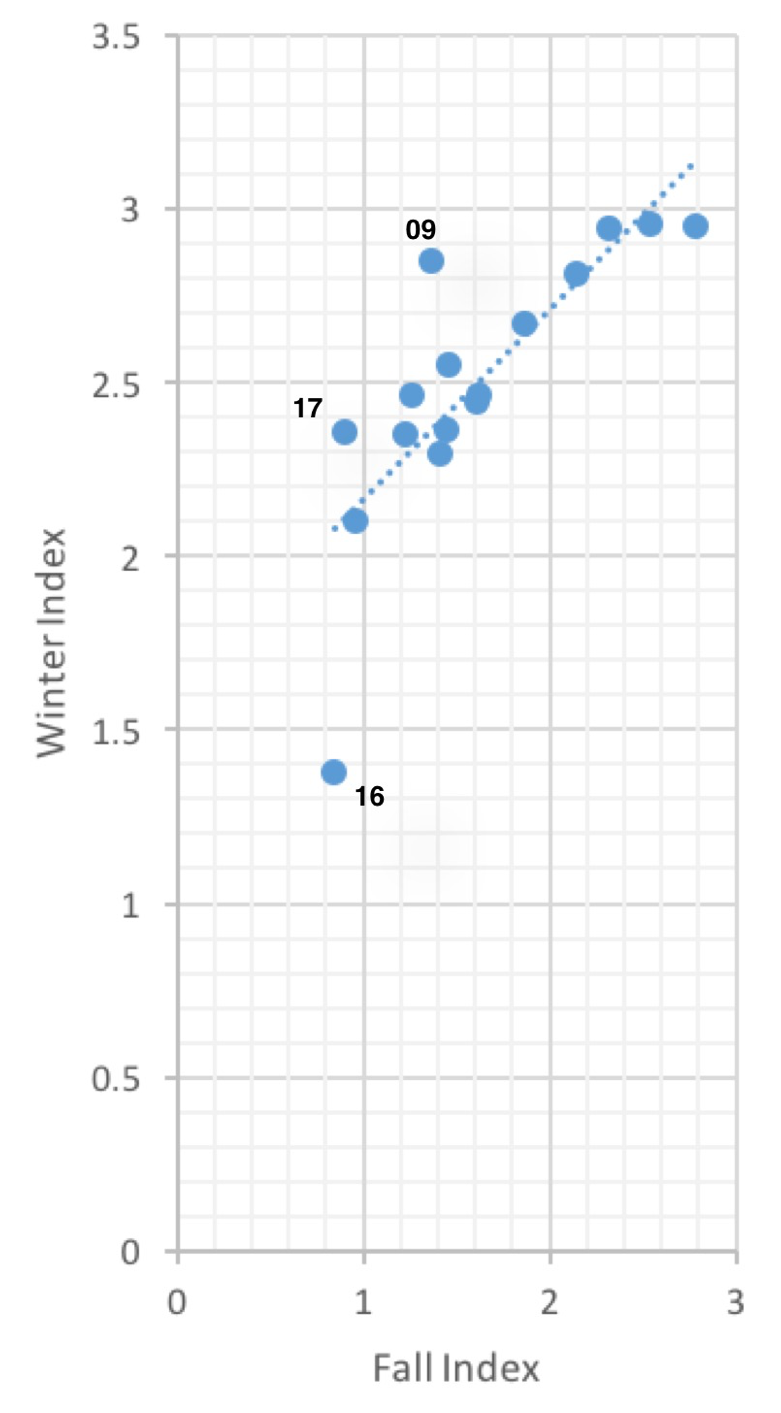
The Fall Recruitment Index of juveniles into the population as derived from the Fall Midwater Trawl Survey (Figure 2) compared with the prior Summer Townet Survey (Figure 1) indicates a strong positive relationship (Figure 5). The year class strength is very much dependent on the number of young starting the summer, which in turn is likely related to the number of eggs laid in spring and subsequent survival of larvae hatched to the early summer juvenile stage as measured in the Summer Townet Survey. Subsequent survival to the fall appears related to summer habitat conditions, for which a good indicator is Delta outflow. High relative survival to fall in 1998 and 2006 (labeled blue in Figure 5) is likely due to these summers’ higher Delta outflow (Figure 6) and related Delta conditions including export levels (Figure 4). The 2010 and 2016 fall indices were likely suppressed by low outflow, high exports, and resulting poor in-Delta survival, indicated by high salvage numbers. Likewise summer and fall indices in drought years 2007, 2014, and 2015 were likely depressed (Figure 5) by these same factors.
The above patterns and observations are very important because the striped bass remain an important indicator of Bay-Delta Estuary ecological health.

Figure 1. Striped bass Summer Townet Survey Index 1959-2016. (Data Source2)
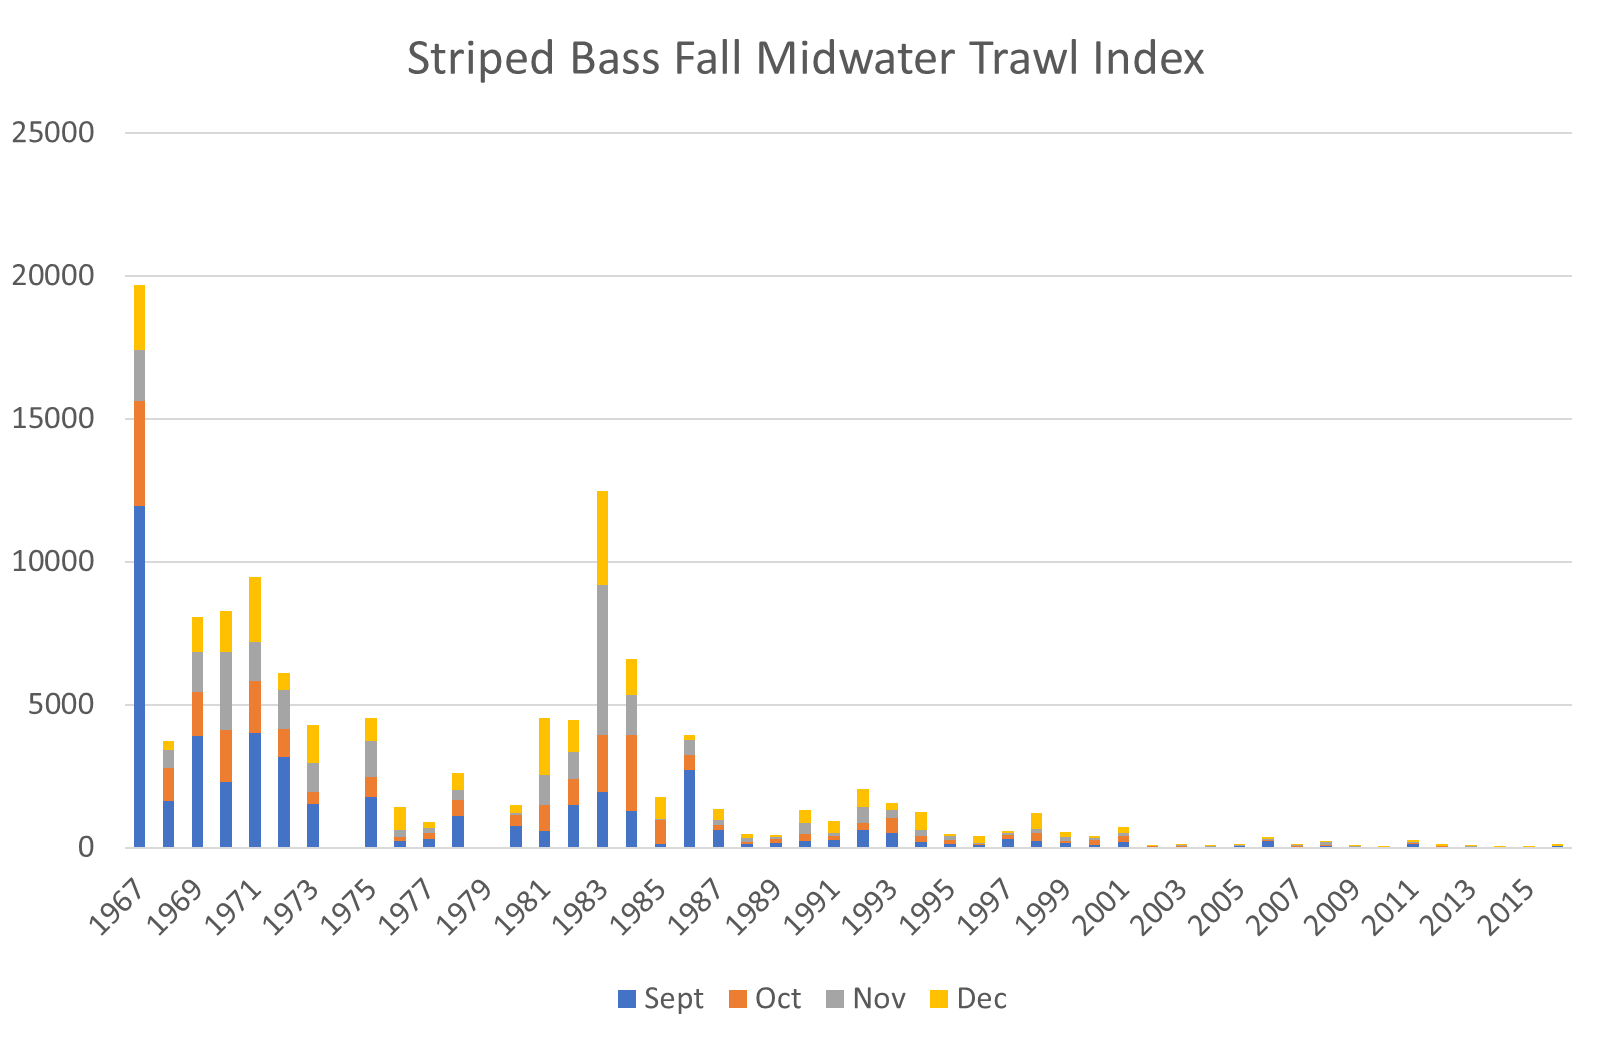
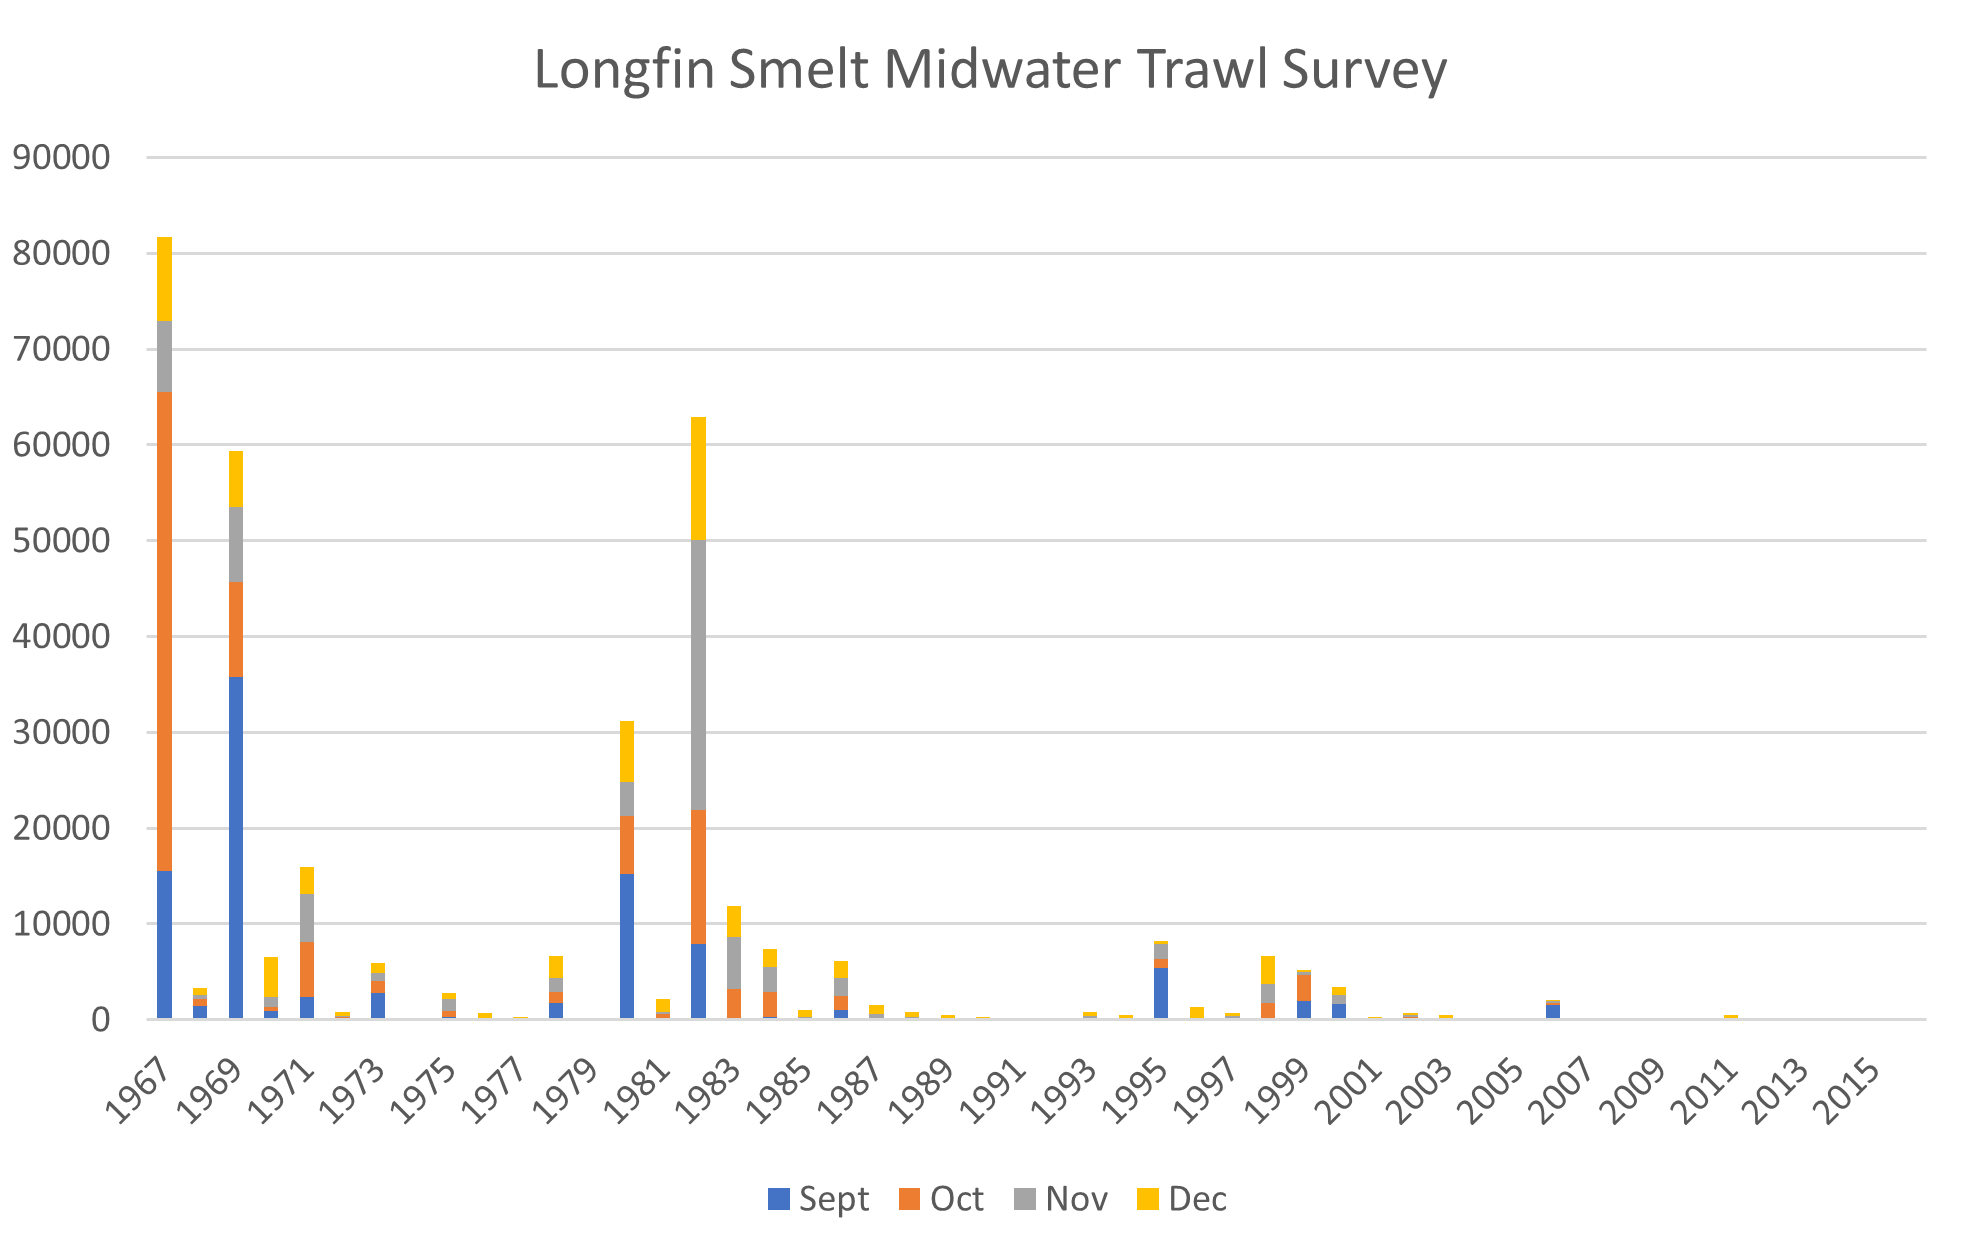
Figure 2. Striped bass Fall Midwater Trawl Survey Index 1967-2016. (Data Source3)
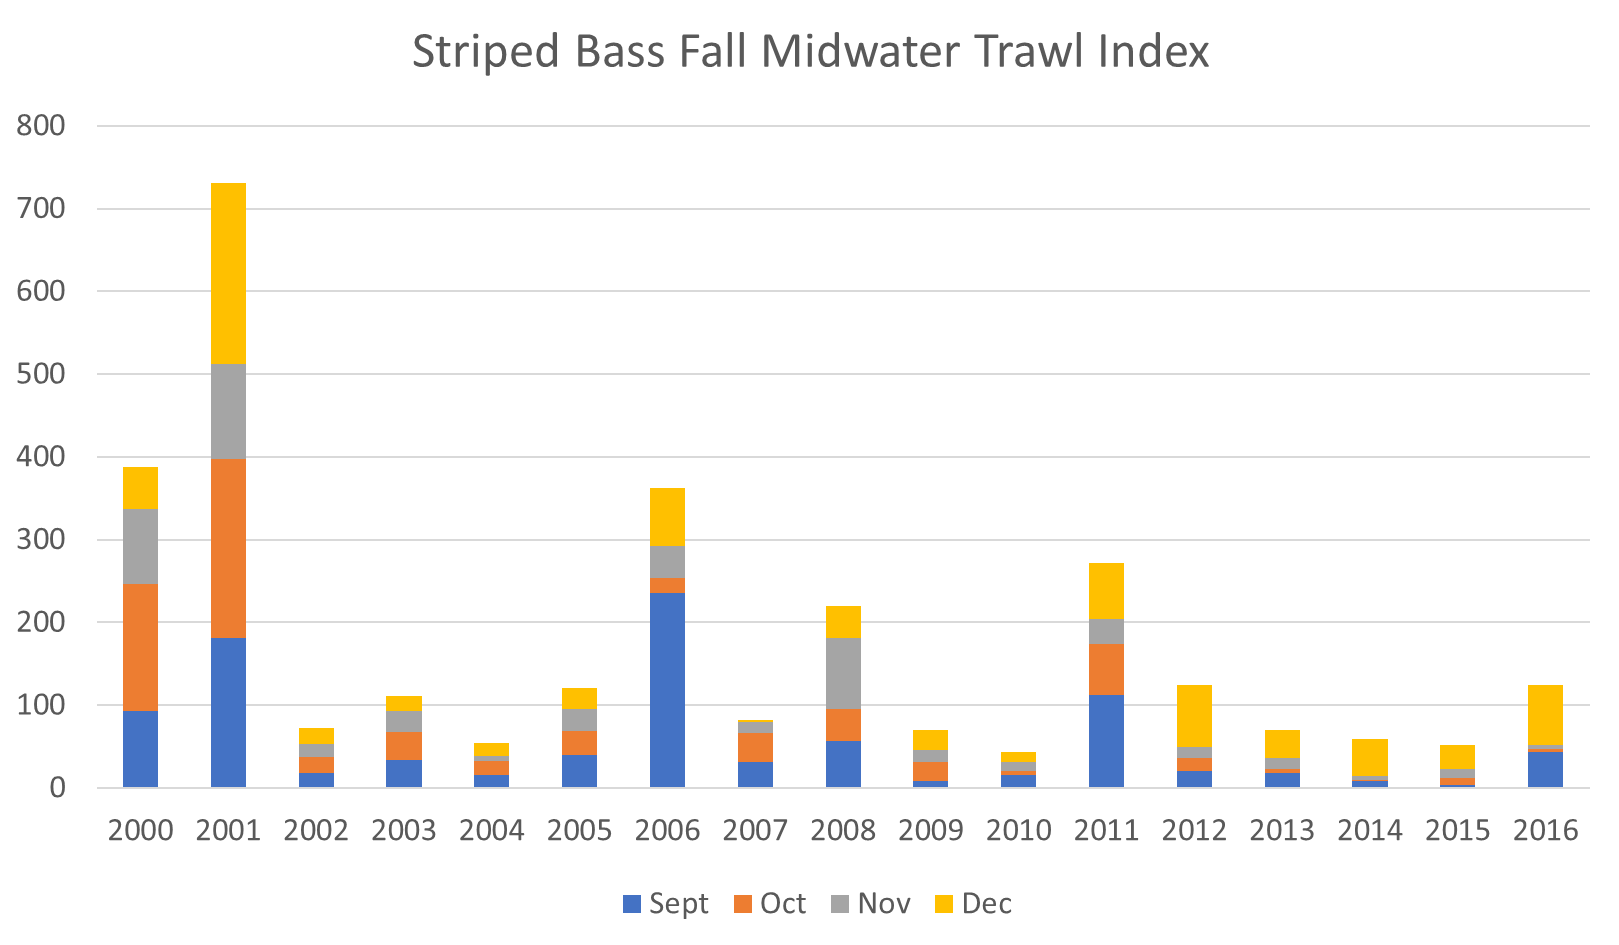
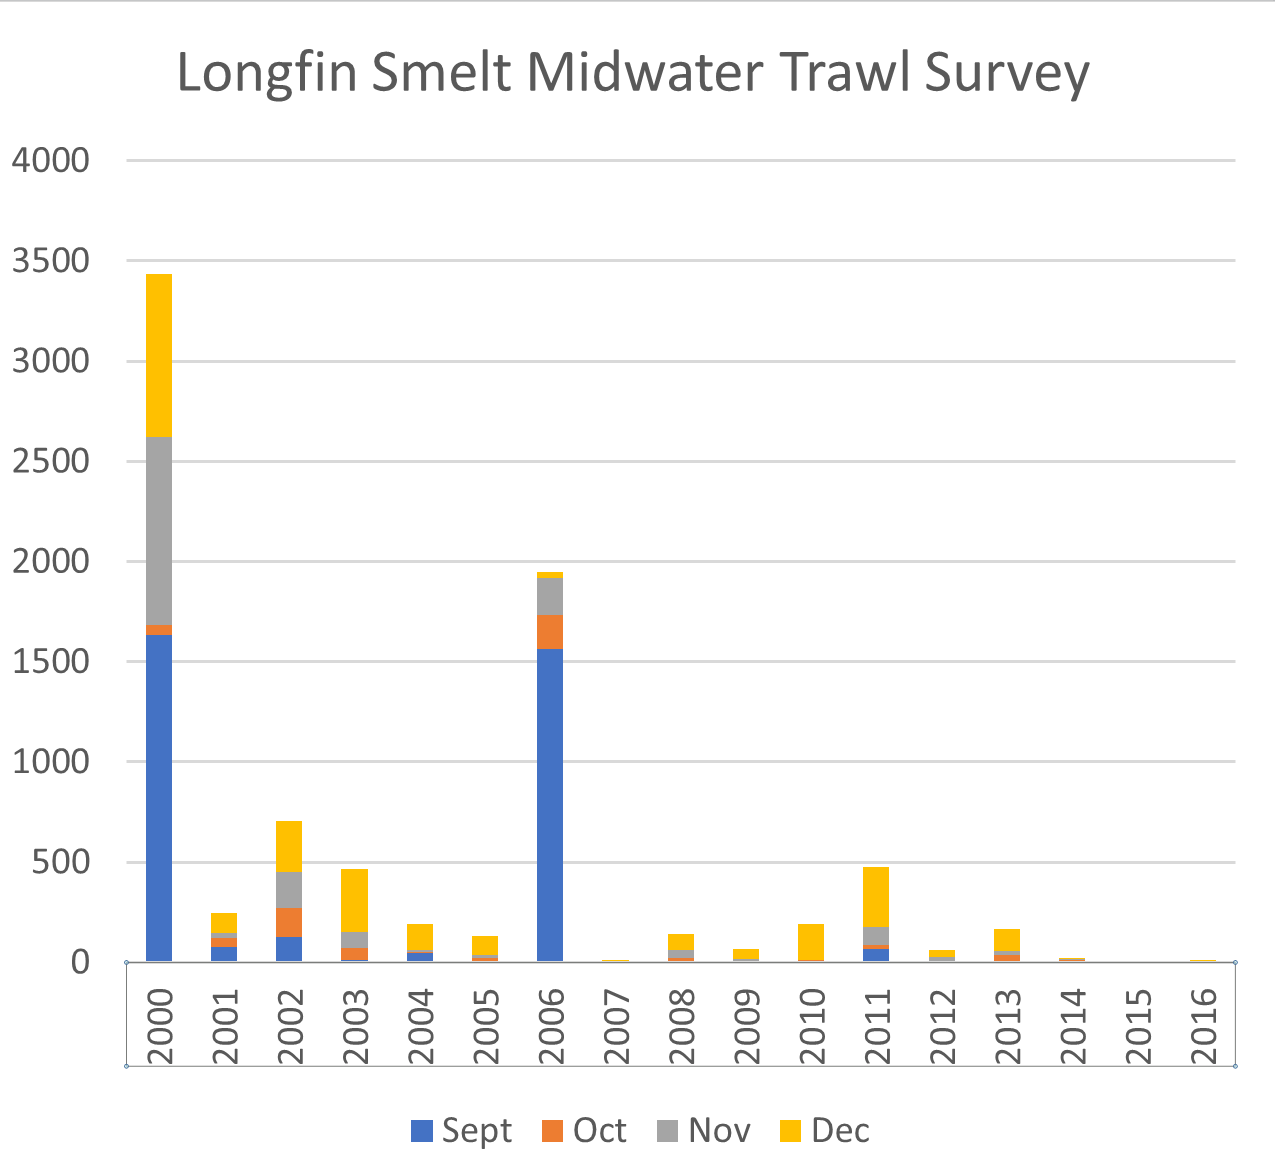
Figure 3. Striped bass Fall Midwater Trawl Survey Index 2000-2016. (Same source as Figure 2)

Figure 4. Striped bass salvage at south Delta fish facilities in 2016. Export rate is shown as acre-feet (~2 times rate in cfs). (Data Source4)
![Figure 5. Striped bass Fall Midwater Trawl Survey Index (log10[index+1]) versus prior Summer Townet Index (log10). Select years labeled, with color of number showing year type: blue=wet, green=normal, and red=critically dry.](http://calsport.org/fisheriesblog/wp-content/uploads/2017/01/figure-5.png)
Figure 5. Striped bass Fall Midwater Trawl Survey Index (log10[index+1]) versus prior Summer Townet Index (log10). Select years labeled, with color of number showing year type: blue=wet, green=normal, and red=critically dry.
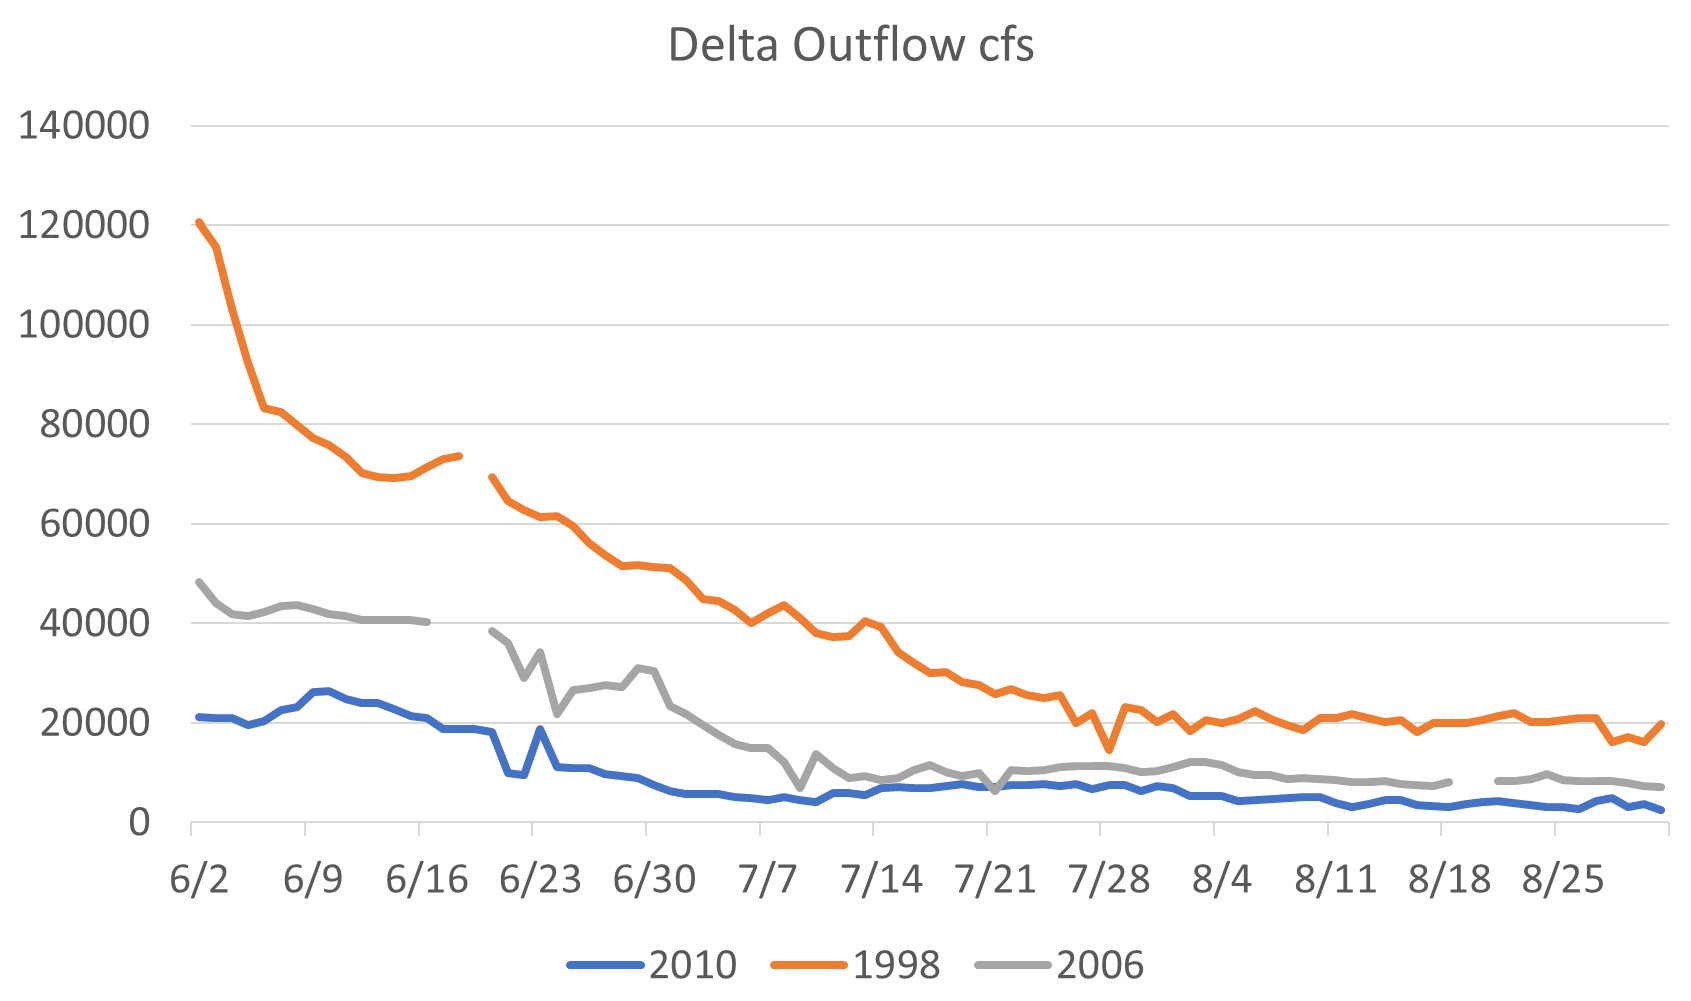
Figure 6. June through August Delta outflow in 1998, 2006, and 2010.