This post addresses more from the November 2016 Bay-Delta Science Conference. In this latest review I focus on:
“Part 2: Collaborative Adaptive Management Team (CAMT) Investigations: Using New Modeling Approaches to Understand Delta Smelt State Salvage Patterns at the State Water Project and Central Valley Project”.1
First, some context:
“The Collaborative Adaptive Management Team, comprised of high level managers and senior scientists, is the group that works underneath the CSAMP2 policy group. The CAMT was established [in 2013] to work with a sense of urgency to develop a robust science and adaptive management program to inform both the implementation of the current BiOps and the development of revised BiOps.”
Delta Smelt Salvage
“CAMT examined historical (1993-2015) salvage data to determine what factors affected Delta Smelt salvage at the State Water Project (SWP) and Central Valley Project (CVP) fish facilities. The objective was to determine if new approaches could be applied to the data to yield new insights about the factors that explain Delta Smelt salvage patterns within and across years.”
Comment: First, it is surprising that CAMT would apply “new” approaches and “insights” given that so much has been studied and learned about Delta smelt salvage at the south Delta pumping plants. The salvage problem had been addressed by limiting exports in winter and spring with OMR limits3 and active management by the Smelt Working Group (SWG), an effort that is both highly sophisticated and effective. The working group’s measures have markedly reduced salvage losses but have failed to curb the population decline. The measures came far too late, and managers often did not take the SWG’s advice.
More study of salvage is not going to help in learning more about the population decline. Less than ten Delta smelt were salvaged so far this winter (compared to thousands per day historically). The study of the population decline should be focusing now on freshwater inflow, Delta outflow, and spring-to-fall habitat conditions (i.e., Low Salinity Zone and water temperatures), and on the indirect effects of Delta exports. It would be far more effective to showcase the SWG’s actions and other actions required by the biological opinion and by water quality standards, It would also be more consequential for the CAMT to evaluate the consequences of weakening these standards in drought years.
“Mr. Grimaldo said that one of the initial sparring matches within the CAMT team was over conceptual models.”
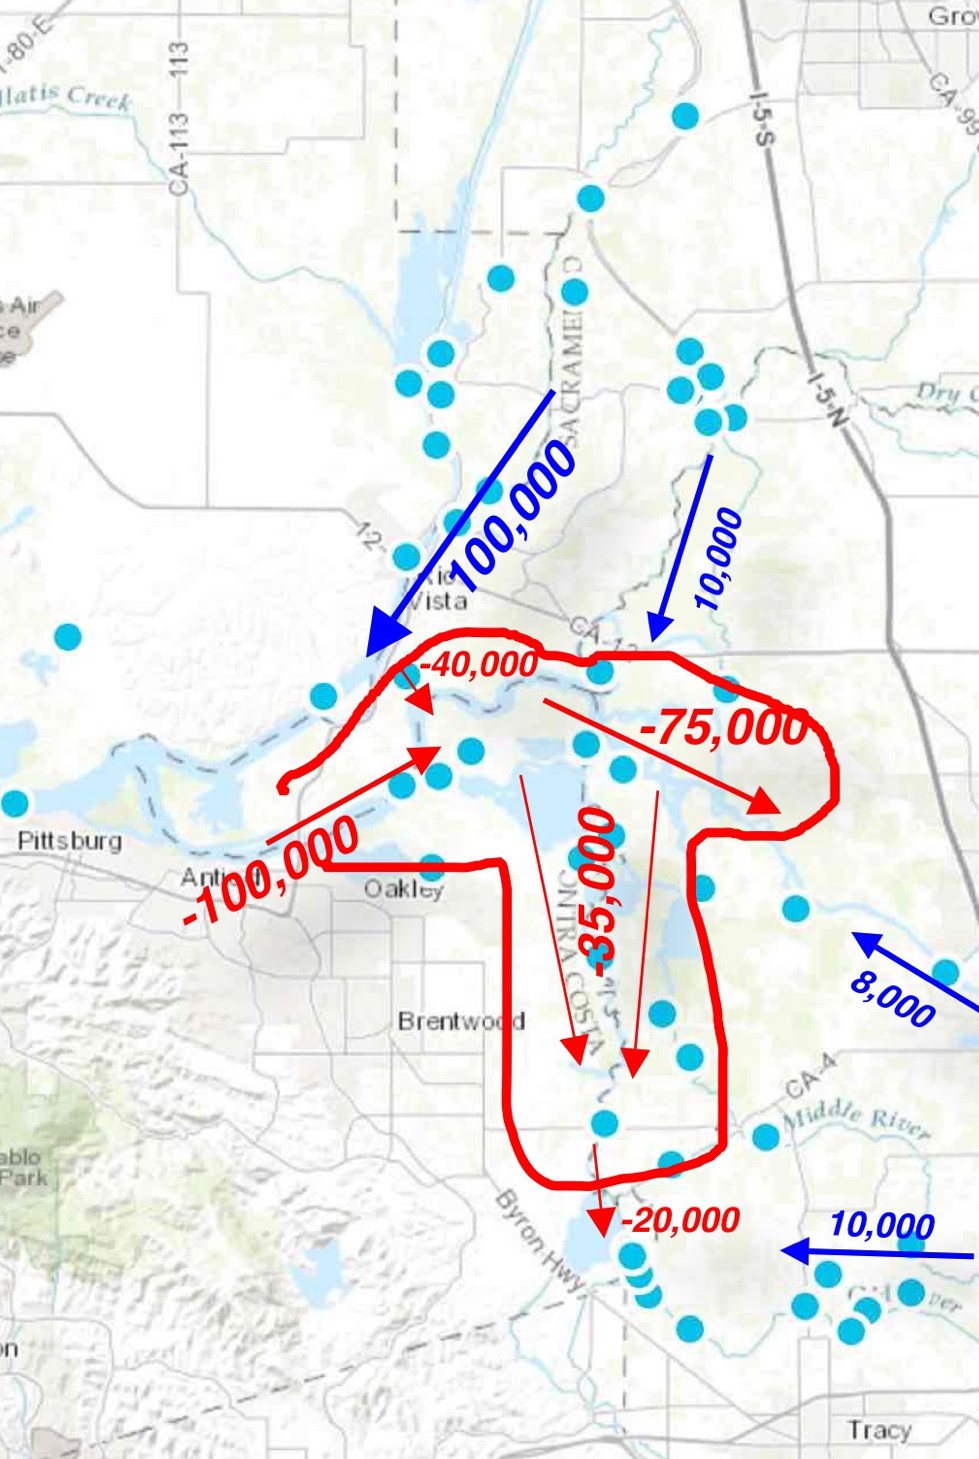
Comment: The CAMT analysis and conference focused on adult Delta smelt winter salvage and the modeling effort employed to understand it. Why? Because the CAMT water contractor members do not like cutting back on exports during the infrequent winter storms in dry years, when the smelt make their spawning runs. Much of a dry year’s water supply comes in infrequent winter storms. Under the conceptual model, higher exports at such times simply draw the smelt spawners into the south Delta4 to be salvaged (killed at fish screens or lost in forebay). When the spawn is in the south Delta, it also makes the annual production of larvae more vulnerable to unmonitored/unmeasured entrainment into the export pumps later in spring. The US Fish and Wildlife’s Delta Smelt Biological Opinion addresses these risks by limiting winter-spring exports. There is no doubt that until these risks are further reduced, there will be no recovery of the Delta smelt population (or other listed Delta fish). Furthermore, until protective actions are extended to Delta outflow, salinity, and water temperatures, there will be no recovery, and the conflict with water supply will remain unresolved and a perpetual problem.
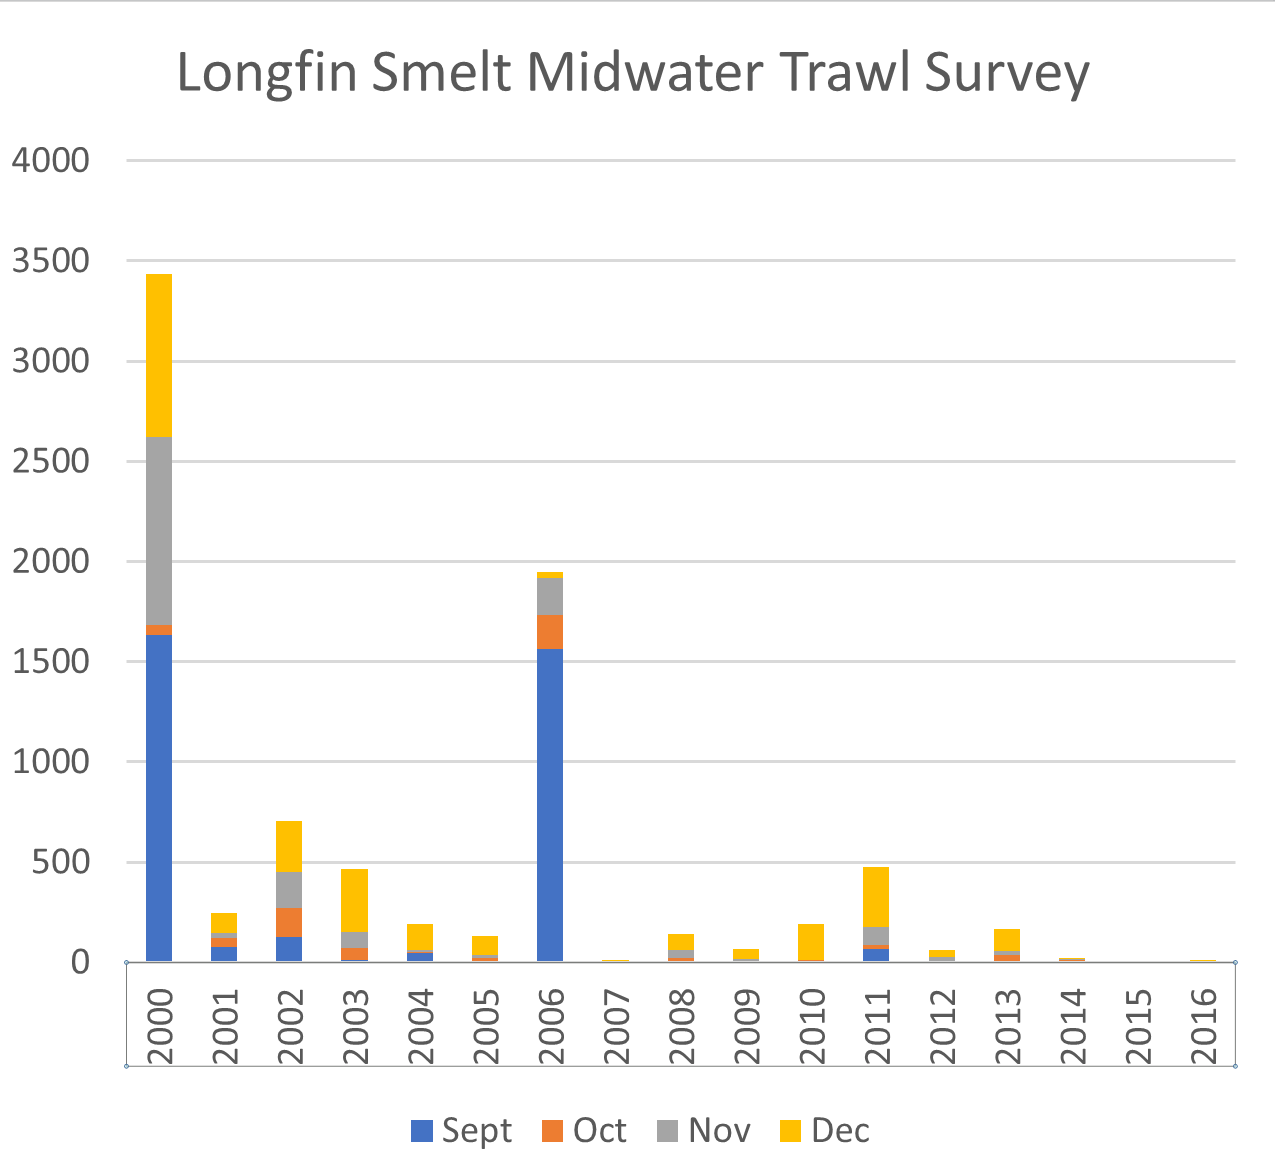
“Grimaldo acknowledged that the Fall Midwater Trawl nowadays is pretty lousy for sampling Delta smelt. “We get very few,” he said. “So this problem is even worse as now we don’t even have a gear, so we don’t even have an idea what the size is coming into December.”
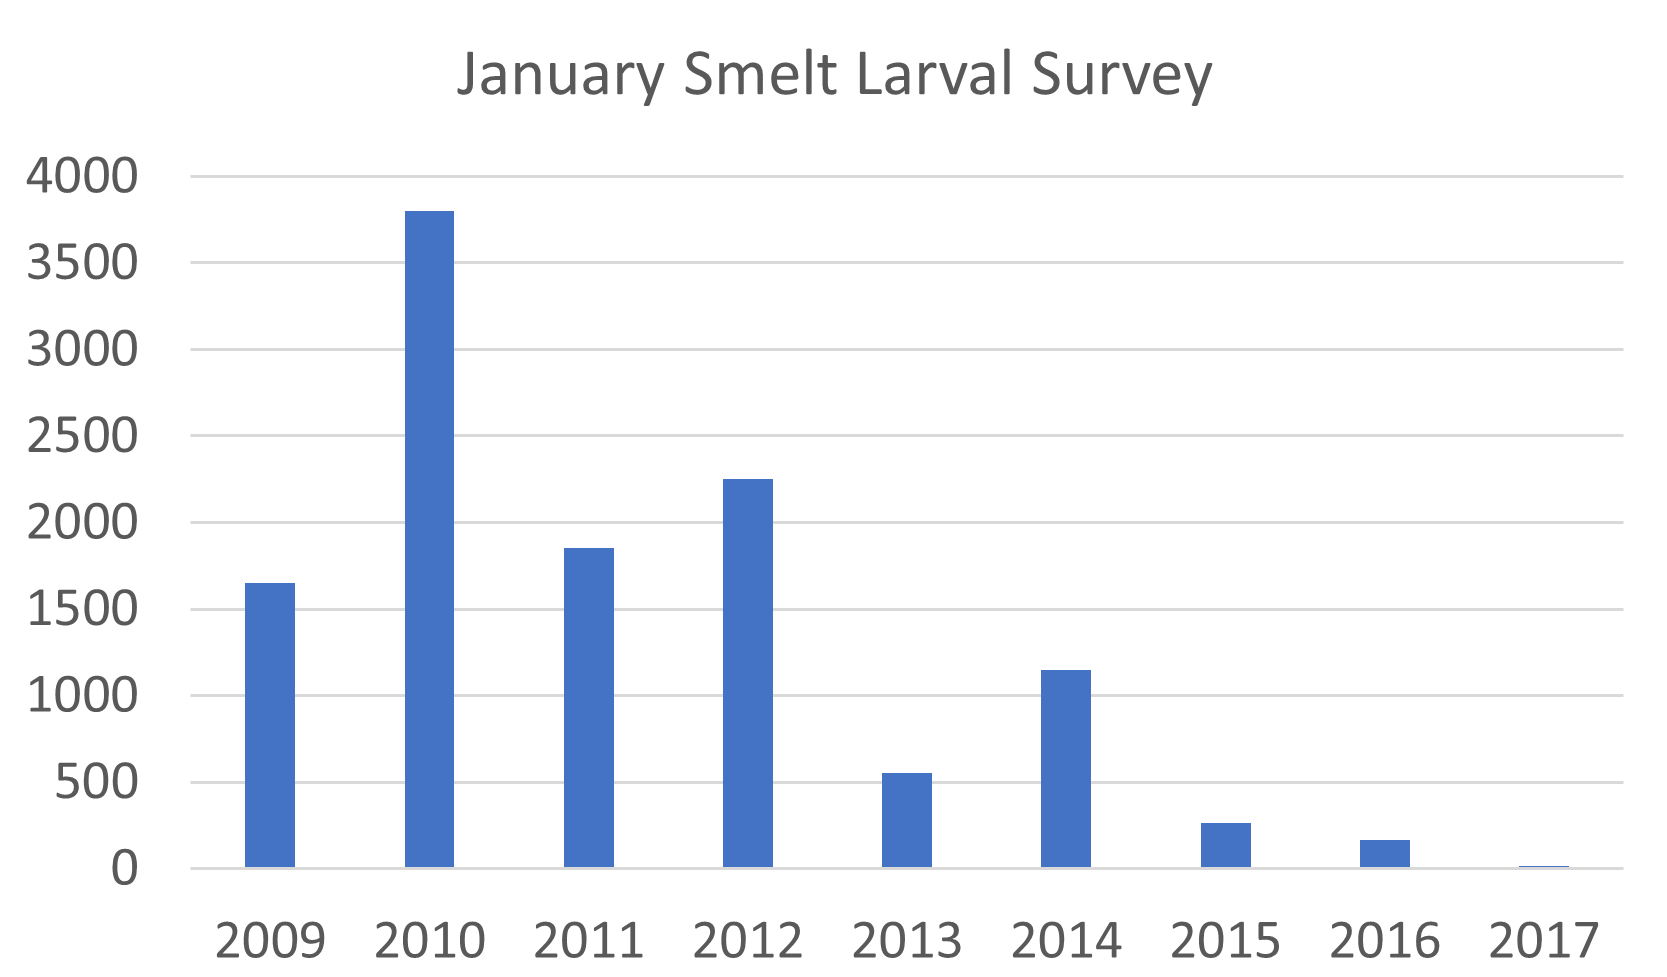
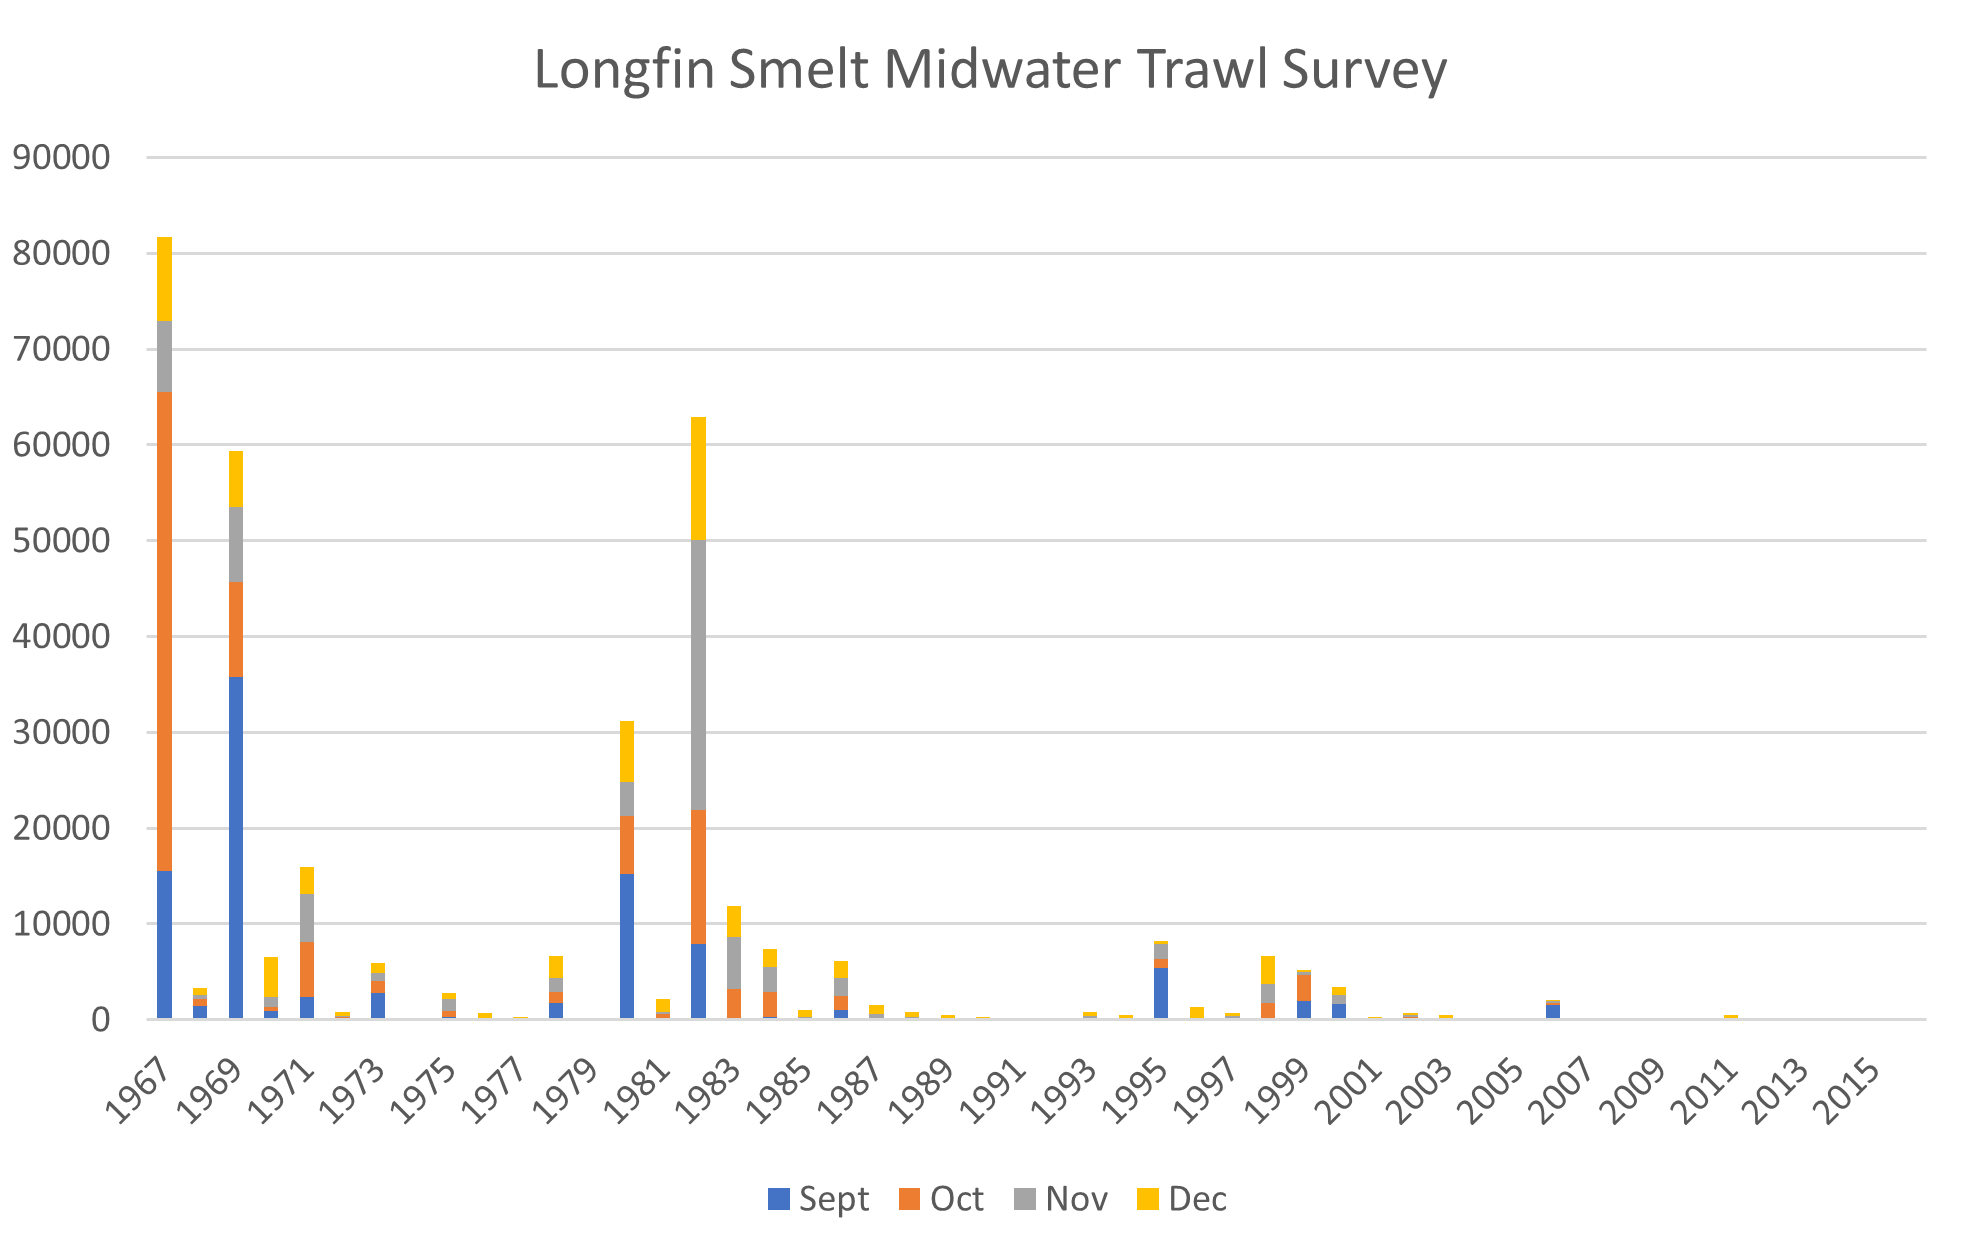
Comment: There is nothing wrong with the Fall Midwater Trawl Survey. It captures few smelt because there are few left. All the surveys support this conclusion (see chart below). We are doing just fine in data gathering with the Smelt Larval Survey, the 20-mm Survey, the Summer Townet Survey, the Fall Midwater Survey, and the Fish Salvage Survey.
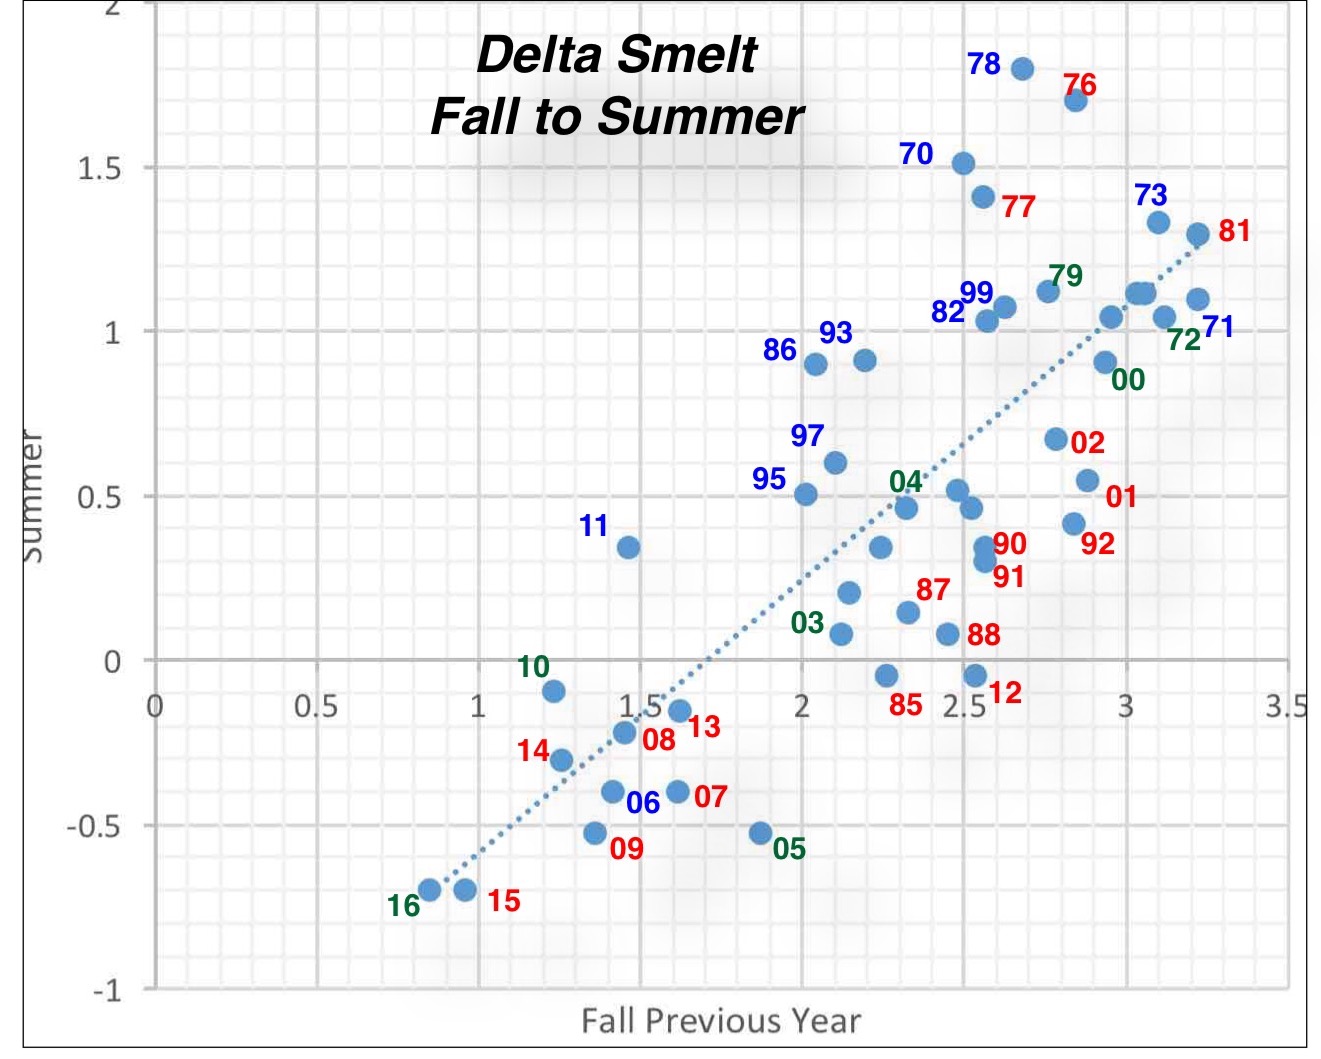
The relationship (log-log) between the fall midwater trawl index and the subsequent summer townet survey index (year noted) is remarkably significant, especially when water-year type is taken into account. Red years are dry/critical. Green years are below/above normal. Blue years are wet.
“Grimaldo suggested that a Kodiak trawl should start in September. “We know that it catches fish better than the fall midwater trawl. I think folks just have to make the leap. I think folks are used to the Fall Midwater Trawl being this 40 year plus monitoring device, but maybe we need to switch things up, because we know from other work that Ken Newman and Randy Baxter are doing that this Kodiak is a better gear for sampling Delta smelt, so why not go for it. This could potentially allow for salvage losses to be evaluated in the context of a recruit responder model,” he said. “At least you could have an idea going into the salvage season what your salvage actually means.”
Comment: The context that matters is that the indices and salvage are near zero and have been for several years. Yes, the highly effective Kodiak trawl would be more effective at near zero population. Do we really want to manage the population down at zero, or do we want to smelt to recover?
Final point: It is sad that we have to resort to court-directed science in the form of CSAMP/CAMT to resolve the perpetual conflict between water management and the Delta ecosystem. All the effort will be focused on how the ten smelt salvaged this year could have been reduced to five.
- https://mavensnotebook.com/2017/01/25/managing-the-state-and-federal-water-projects-the-collaborative-science-and-adaptive-management-program/ ↩
- http://www.water.ca.gov/environmentalservices/csamp.cfm ↩
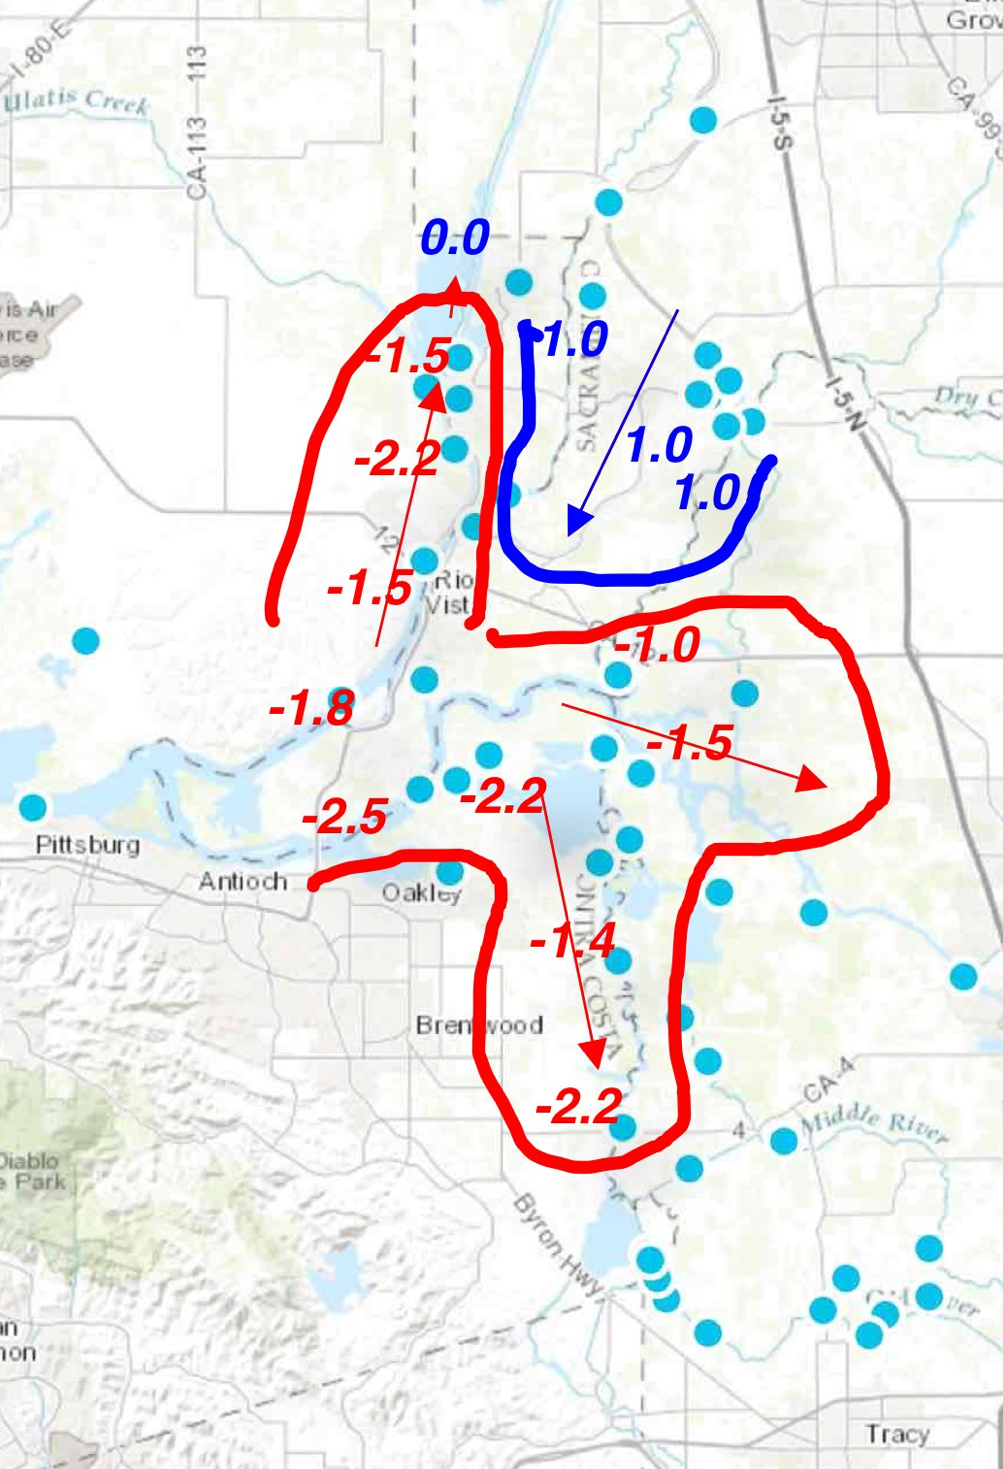
- limiting negative average tidal flows in Old River and Middle River channels in the south Delta. ↩
- http://calsport.org/fisheriesblog/?p=1432 ↩