Feinstein Gets Some Water, but Smelt Get Some Back

In my March 12 post, I related that Senator Feinstein’s request for higher Delta exports would put the Delta Smelt population in the Delta at further risk of extinction. Well, she received her wish, and exports increased from 6000 cfs to 8000 cfs (11,400 cfs is maximum pumping capacity) in the week after her request when storms brought more inflow to Delta from the San Joaquin River.

However, the higher exports were short–lived, because the 3/14-3/17 Smelt Larvae Survey picked up larval smelt for the first time this year (Figure 1 – green dots). Exports dropped below 5000 cfs again. Though only two newly hatched larvae were collected in the central Delta, their presence is a concern. The presence of larval smelt shows that smelt are spawning in the lower San Joaquin River in the central Delta. According to the Smelt Working Group the net negative flows shown in red in Figure 1 for late March indicate a “medium” risk to smelt and a likelihood that larval smelt will be drawn toward the south Delta export pumps.1 The -5000 cfs Old and Middle River (OMR) reverse flows are the maximum allowed under the Smelt Biological Opinion.

In its review of the results of particle tracking model runs, the Smelt Working Group concluded: “Members stressed the importance of weighing more heavily the results from inserting (particles) at Prisoner’s Point, given the consistent catch of adults there this year and the hydrologic proximity of that location to the south Delta (as compared to Jersey Point). For OMR flow of -5000 cfs, approximately 20% of the particles inserted at Prisoners Point were entrained into the South Delta. For an OMR flow of -2500 cfs, approximately 10% of particles inserted at Prisoners Point were entrained into the South Delta. For an OMR flow of – 1250 cfs, less than 10% of particles inserted at Prisoners Point were entrained into the South Delta.” Prisoners Point is the green dot from the right on the Figure 1 map. In all likelihood, larval smelt are now being drawn or will soon be drawn into the south Delta. It is too early to determine what portion of the population is subject to this risk. But given the unprecedented depressed condition of the smelt population after four years of drought, the risk is significant.

On March 24, after review of “Smelt Working Group’s March 21 recommendations,2 the U.S. Fish and Wildlife Service “determined”3 that the OMR should be no more negative than -2500 cfs on a 14-day average, and no more negative than -3150 cfs on a five-day average. Reclamation took a slightly more liberal interpretation in the subsequent week’s operations (Figure 2), staying nearer -3500 cfs most of the week with no apparent interest in reaching a -2500 cfs 14-day average. It could be that the Service meant to recommend a -3500 cfs OMR limit. Or maybe the Service got a call from Senator Feinstein’s office. We shall see what this week’s meetings and determinations offer.

In any event, the risk to Delta Smelt remains “medium” at combined exports of about 3500-4000 cfs. With an export capacity of 11,400 cfs, Delta outflow still exceeding 50,000 cfs, reservoirs continuing to release snowmelt, and San Luis Reservoir in the San Joaquin Valley only half full, there will be continued cry for more exports and for approval of the Tunnels. In the meantime, it appears from Figure 1 that some smelt larvae and a good amount of snowmelt are escaping west to Suisun Bay, while some larval smelt remain at risk in the central Delta.

Figure 1.  Net daily flow in Delta in late-March 2016. (Gage data source:  USGS). Green dots are location of seven Delta Smelt larvae collected in Survey 6 of Smelt Larvae Survey (http://www.dfg.ca.gov/delta/data/sls/CPUE_Map.asp ).

Figure 1. Net daily flow in Delta in late-March 2016. (Gage data source: USGS). Green dots are location of seven Delta Smelt larvae collected in Survey 6 of Smelt Larvae Survey (http://www.dfg.ca.gov/delta/data/sls/CPUE_Map.asp ).

Figure 2. OMR March 23 to March 28.  (Source: CDEC)

Figure 2. OMR March 23 to March 28. (Source: CDEC)

FISHBIO Strikes Again – Predation Is the Problem, Not Water Diversions – Right or Wrong?

On Wednesday, February 10, 2016, the Water, Power and Oceans Subcommittee held a one-panel oversight hearing on “The Costly Impacts of Predation and Conflicting Federal Statutes on Native and Endangered Fish Species.” FISHBIO President Doug Demko was invited to provide testimony on the issue in reference to California’s Central Valley.

FishBio photo

FishBio photo

FishBio’s testimony begins: “California resource agencies sink tens of millions of dollars every year into a failing effort to protect native and endangered fish species, while also bolstering introduced top-level predators that are decimating the very fish they are required to maintain.”

  1. Failure to protect native and endangered fish species in the Central Valley has far more to do with water management within the federal Central Valley Project and State Water Project and lack of protections from water quality standards and biological opinions, especially during four multi-year droughts beginning in the late-1970’s. Over a billion dollars have been spent by federal and state agencies on fish recovery, with strongly positive results between droughts.
  2. In no way have the recovery efforts bolstered introduced top-level predators such as the striped bass. As noted in the testimony, stocking of striped bass ceased nearly two decades ago. Striped bass production had declined dramatically over the past three decades along with the native fish. Summer water quality standards that once protected striped bass were removed twenty years ago.
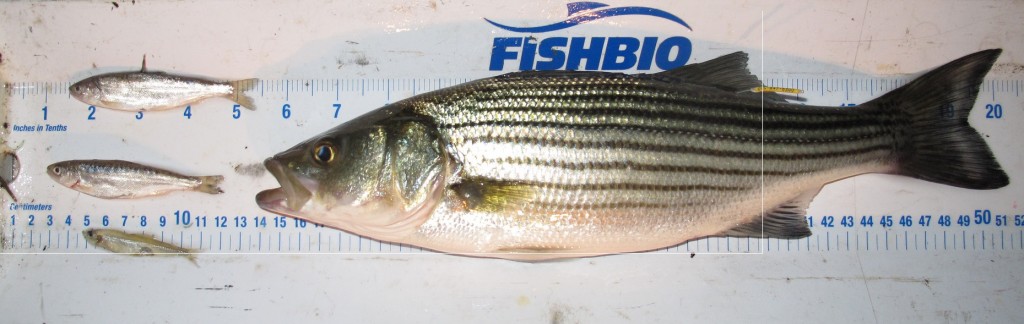
  3. The increases in stocking of hatchery salmon smolts to over 30 million annually in the Central Valley have encouraged and sustained the remaining striped bass, which now focus more on young salmon. Adult striped bass now concentrate in spring below all the Central Valley salmon hatcheries and dams. Remnants of the once prolific striped bass population await the fat hatchery smolts in all 300 miles to the Golden Gate. A shift in prey and location of prey has forced more Striped Bass into the rivers and tributaries for prey.
  4. Yearly Hatchery Steelhead Photo

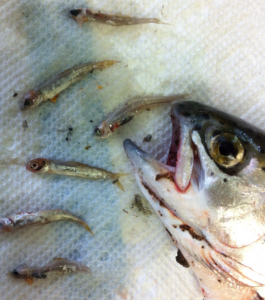
    Photo: yearling hatchery steelhead smolt fed on wild salmon fry in American River. (Photo by author)

    The stocking of millions of large yearling salmon and steelhead smolts also contributes directly to predation on wild salmon and steelhead fry. (see photo at right)

  5. Research has shown that habitat changes have had more to do with increased predator populations like largemouth bass in the Delta. Controlling habitat change is the proven way to limit predators, rather than direct control of predators, which does not work (logistically impossible and very costly and inefficient).

“However, only recently has the existing body of science on predation been recognized among fisheries managers as a major source of juvenile salmon mortality.” This statement is simply not true. Hatchery salmon smolts have been trucked to the Bay for three decades to avoid the hundreds of miles of predator gauntlet. Predation studies at specific locations such as the Red Bluff Diversion Dam have long indicated predation problems. The dam was removed because it was a recognized predator “hot spot”.

There is no doubt that predation by non-native fish like Striped Bass and Largemouth Bass is a major factor in Chinook Salmon and Steelhead mortality in the Central Valley. However singling them out as the primary cause of native fish declines misses the key factor: water management. Salmon, smelt, and bass got along well until the State Water Project came on line in the 1970s and increased Delta exports from 2 million to 6 million acre-feet per year. There is no doubt that droughts and climate change have added to or sped up changes; however the underlying problem remains water diversions.

“It has now become clear that predation may significantly limit the success of salmon recovery efforts (NMFS 2009b; Dauble et al., 2010).” While this statement may be true under existing conditions where salmon production is limited by water management and habitat degradation (with predation exacerbated by these factors), the solution should be a broader range of risk factor management, not just a focus on predation. For example, spring reservoir releases can reduce predation risk by speeding emigration, increasing turbidity, and reducing water temperature.

“The survival estimate of 7% in 2012 was much lower than the 40-60% previously estimated by mark-recapture studies conducted by CDFW.” In drought years like 2012, reservoirs capture and retain nearly all winter-spring flows. No doubt this creates better conditions for Striped Bass (and resident Rainbow Trout and Pikeminnow) predation on young salmon that are programmed to emigrate when Mother Nature provides appropriate freshets. So is the problem predation or lack of natural flows? (This problem could be partly mitigated through a more comprehensive approach in the worst case drought years by capturing young salmon in migrants traps and transporting them to the Bay, thus avoiding the predators in the river (and Delta). In such dry years adult Striped Bass could also be effectively captured in upstream migrant traps and transported to the Bay where other types of prey are far more abundant.)

“[N]o changes in sportfishing regulations, and, to date, no meaningful actions of any kind have been taken to accept or address the problem.” Changing sport fishing regulations would be a drop in the bucket and alienate most sport fishermen. Why doesn’t CDFW take the hundreds of thousands of young striped bass salvaged each summer at the Delta export pumps (and returned to the west Delta) and stock them in a southern California reservoir? Because that would cripple the Bay-Delta striper fishery – an angler’s Catch-22. Why doesn’t CDFW take the catch from hundreds of bass tournaments each year in the Delta somewhere other than nice spots in the Delta? Because that would cripple the world-renowned bass fishery – another Catch-22. FishBio describes the bounty fishery on Columbia River predators that are less desired as gamefish. It is altogether different to put a bounty on Striped Bass and Largemouth Bass.

FishBio noted that harvest restrictions on non-native sport fish have recently been removed on the Columbia River to protect native salmonids. “A similar policy change in California, coupled with focused removal and suppression efforts, could lead to improved survival conditions for native species as has been demonstrated on the Columbia River.” Columbia River salmonid fisheries are far more valuable and popular than bass and walleye fisheries. Furthermore, there is little else managers can do on the Columbia to benefit salmon. Water diversions in the Columbia are far less of a problem, and managers on the Columbia have already severely limited hydropower production to provide spring spills for salmon. These actions have brought record or near record salmon and steelhead runs.

In conclusion, Striped Bass and Largemouth Bass are two of the top sportfish in the Central Valley. Destroying their populations and sport fisheries, and associated socio-economic benefits, without addressing water management, the real culprit, will not solve or defuse the problem.

Feinstein Objects as State and Federal Regulators Hold Back on Delta Exports

The Sacramento Bee ran an article on March 11, 2016 that reported how state and federal water managers have limited Delta exports to protect endangered salmon and smelt. The article also reported that Senator Feinstein had called for increased exports, and quoted a representative from Westlands Water District lamenting the loss of stormwater to the ocean.1

The facts are that limiting exports to about 6,000 cfs (maximum is 11,400 cfs) under present rules is reasonable given the risks to endangered Winter Run salmon and Delta smelt. As stated in the article, most of remnant Winter Run salmon and Delta smelt are in the Delta.

It was not so long ago that high late winter exports contributed to the decline of both species. In 2001, late winter exports of 8,000-11,000 cfs resulted in high salvage counts of salmon (Figure 1 – up to several hundred per day of Winter Run) in contrast to several hundred for the entire winter in 2016. Delta smelt salvage at South Delta Fish collection facilities reached several hundred per day in 2001 (Figure 2), in contrast to only a total of 12 in winter 2016. Winter 2001 Delta outflows were also high (Figure 3), but exports rules were not as strict.

Also noteworthy is the fact that the multi-agency Smelt Working Group has been recommending even lower exports this winter2 because of the record low numbers of smelt and the high risks to smelt from exports.

Restrictions on exports are reasonable and necessary to protect smelt and salmon.

Chinook salmon salvage at South Delta fish facilities in 2001

Figure 1. Chinook salmon salvage at South Delta fish facilities in 2001. CVP is federal Tracy facility. SWP is state Clifton Court facility. Export rates are in acre-ft per day. Daily export rate in cubic feet per second (cfs) is approximately 50% of the rate in acre-ft. Winter 2016 salvage totals in contrast total only several hundred. (Source3)

Delta smelt salvage at South Delta fish facilities in 2001

Figure 2. Delta smelt salvage at South Delta fish facilities in 2001. CVP is federal Tracy facility. SWP is state Clifton Court facility. Export rates are in acre-ft per day. Daily export rate in cubic feet per second (cfs) is approximately 50% of the rate in acre-ft.

Delta outflow in winter 2001

Figure 3. Delta outflow in winter 2001. Winter 2016 outflow ranged from 10,000 to 66,000 cfs. (Source: CDEC)

February Delta Smelt Update

The February trawl survey indices are in – there are a few Delta Smelt left (Figure 1).

The Smelt Working Group, created as prescribed in the Smelt Biological Opinion issued by the US Fish and Wildlife Service (in the Department of Interior), has stated following its meetings on February 15 and 22: “The fact that sporadic Delta Smelt catches have continued to occur at Prisoners Point under the lowest February SKT survey on record indicates that the risk of entrainment remains high and is incompatible with current pumping levels.” 1

After its February 22 meeting, the Working Group added: “Salvage: Four delta smelt on February18, geographic influence of the pumps extends to the lower San Joaquin River at the more negative end of this flow range, especially affecting the southern bank near Jersey Point. Recent salvage of adult Delta Smelt confirms that entrainment into the export facilities has occurred and likely is continuing…. The Working Group concluded that any salvage observed at either facility will be of high concern because Delta Smelt abundance is at a historic low, contributing to low detection probability of Delta Smelt in salvage under RPA compliant operations (BiOp page 338). One fish was detected in salvage sampling on January 21 and February 18, counting as eight salvaged Delta Smelt due to an expansion factor of four.”

Following these meetings, the US Bureau of Reclamation (also in the Department of Interior), which operates the federal export pumps in the South Delta, exported more than double the recommendation of the Smelt Working Group. Together the state and federal exports were nearly triple the recommended amount (<2000 cfs). This situation, where the state and federal experts in the Smelt Working Group were ignored by their managers, who instead maximized Delta exports in February, is a gross violation of the intent of the state and federal endangered species acts and species protections in the biological opinion. Graph of Kodiak Trawl 
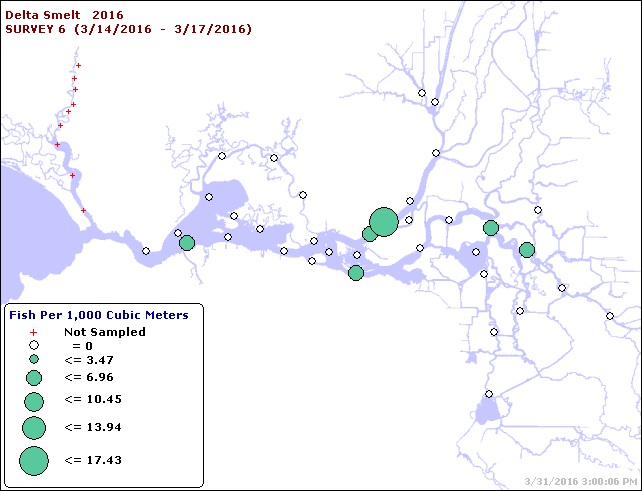
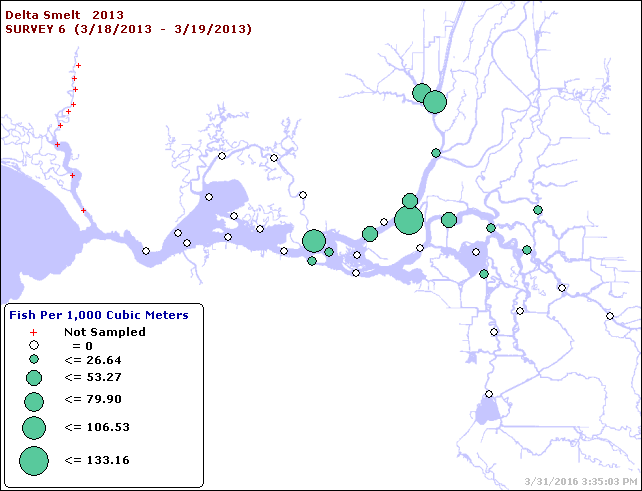
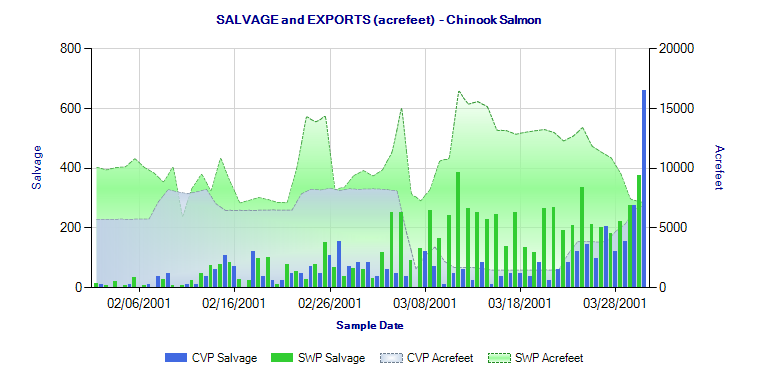
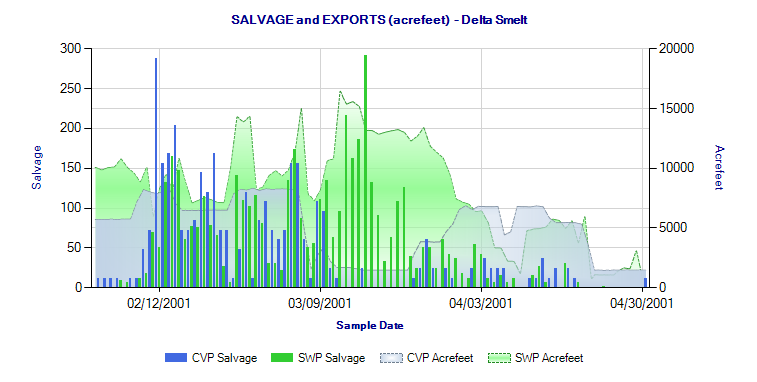
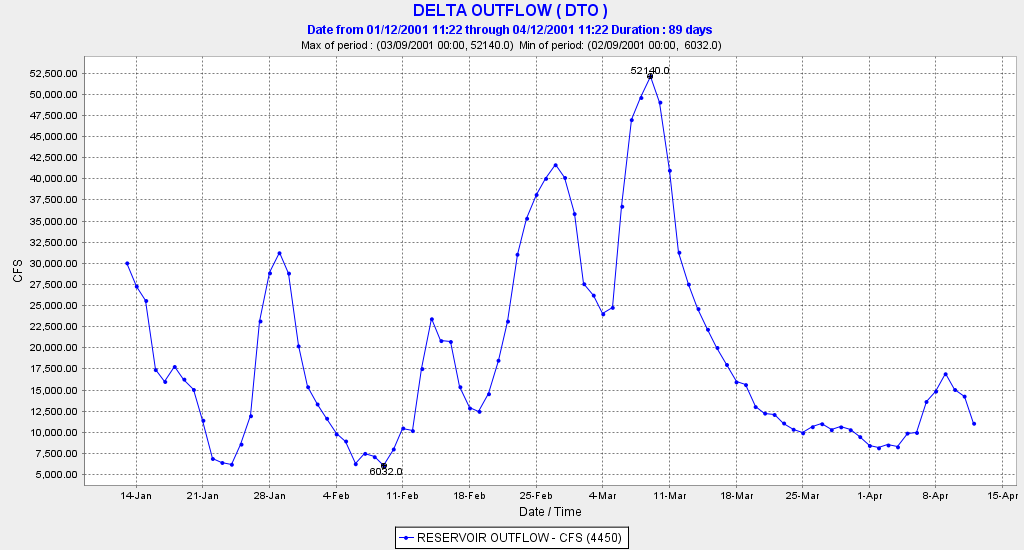
Figure 1. Record low indices for Jan-Feb 2016 in Kodiak Trawl Survey2

Few Smelt Left are at High Risk

This third week of February 2016 the Smelt Working Group concluded “the risk of entrainment remains high and it is incompatible with current pumping levels”1. Basically as Delta inflows decline after the early winter stormwater recedes in early February and South Delta exports increase, the risk to Delta Smelt is high with the onset of spawning imminent. Despite the high risk assessment, state and federal managers have decided to raise exports to the maximum allowed under the Delta Smelt Biological Opinion, to 6,000 cfs, which is triple the 2000 limit suggested by the working group, and about a third of Delta inflow. The working group warns the managers that just because there are few smelt being seen in Delta surveys does not mean that the remnants of the populations are not at risk.

The working group is also concerned with what may soon occur once smelt do start spawning. As Longfin Smelt have begun spawning, I have summarized recent data to specifically look at that risk. Figure 1 shows the recent early February Smelt Larval Survey results along with annotations of net flows. Under 6000 cfs exports negative upstream net flows occurs throughout the central Delta (red arrows). The larval smelt in this area will transport to the south Delta over time. With spawning smelt in this area, their offspring will also likely move south to the pumping plants.

With most of the larval Longfin in Suisun Bay because of the earlier storm flows, the risk to the population is low. Yet, these are a state endangered species with these export operations causing a measurable take. With Delta Smelt yet to spawn, they are more likely to be found further upstream because of lower Delta inflows, thus putting their larvae at greater risk than Longfin, especially given ripe adults are present in the central Delta.

One final note, with these operations and declining Delta inflow, the low salinity zone where smelt larvae concentrate will be drawn ever eastward from eastern Suisun Bay into the central Delta. This pattern will increase the risks to smelt. The upstream edge of the low salinity zone is moving upstream in the lower San Joaquin channel with the higher exports as seen at Antioch (Figure 2) and False River (Figure 3).

February Longfin Smelt densities from Larval Smelt Survey

Figure 1. Early February Longfin Smelt densities from Larval Smelt Survey2 with added annotations of net flow in the Central Delta zone of influence (red circle) of the South Delta exports. Blue circle shows catch at Jersey Pt station (809). Red arrows depict net negative flows on the order of 400-5000 cfs3. (Note these early February Longfin larvae densities are by far the lowest observed in the eight years of surveys.)

Feb Salinity (EC) at Antioch

Figure 2. Salinity (EC) at Antioch in the San Joaquin channel of the west Delta during February 2016. (Source: CDEC)

Salinity (EC) in False River

Figure 3. Salinity (EC) in False River in the central Delta during February 2016. (Source: CDEC)