Introduction
The population dynamics of the San Francisco Bay-Delta estuary’s endangered Delta smelt can be viewed using patterns in annual indices of their abundance published by the California Department of Fish and Wildlife (CDFW). Indices of abundance are available from the Fall Midwater Trawl and Summer Townet surveys over the past five decades. Since Delta smelt have a short one to two year lifespan, they readily lend themselves to spawner-recruitment (S/R) analyses that help define the population dynamics of the species.
This report employs S/R analyses to review long-term trends in the population indices of the Delta smelt. The analyses support the hypotheses that abundance (adult numbers) and recruitment into the adult population are primarily controlled by the numbers of adult spawners, adjusted by wet-dry year differences in production of juveniles. In other words, the population abundance from year to year is determined by the number of eggs laid each year and the survival of each egg cohort to adults a year later.
Annual Indices of Delta Smelt Abundance and Recruitment
The long-term trends in Delta smelt reflected in the CDFW annual indices of summer and fall survey catch show dramatic declines over the past five decades (Figures 1 and 2). In the Summer Townet (STN) Index (Figure 1), the most obvious population declines are in the early 1980’s and the mid-2000’s. The Fall Midwater Trawl (FMWT) Index (Figure 2) highlights several key periods of population change: 80-83, 88-91, 00-05, and 09-13.
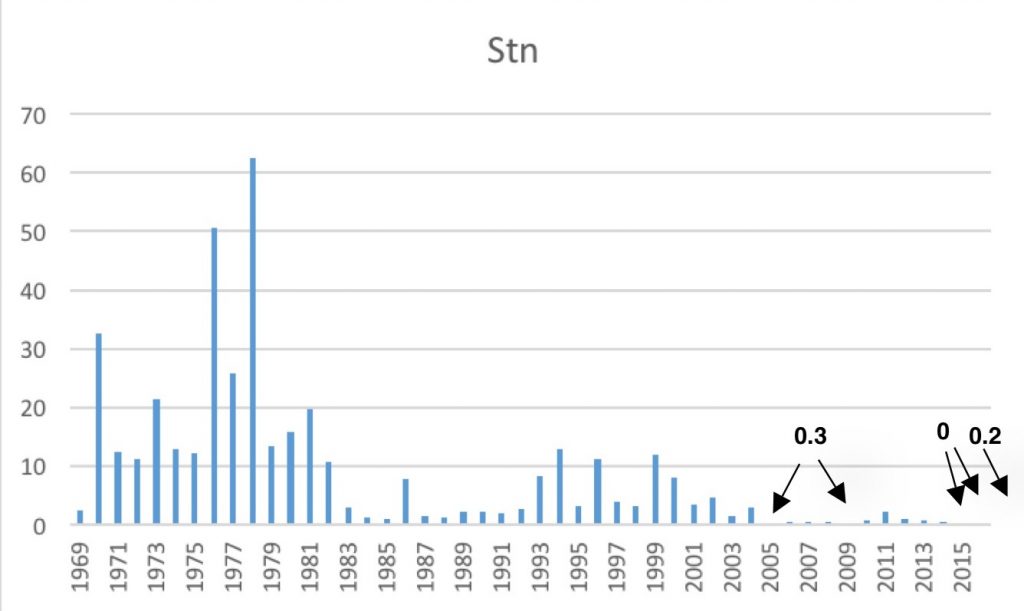
Figure 1. Delta smelt Summer Townet Index (1959-2016). Data source: CDFW
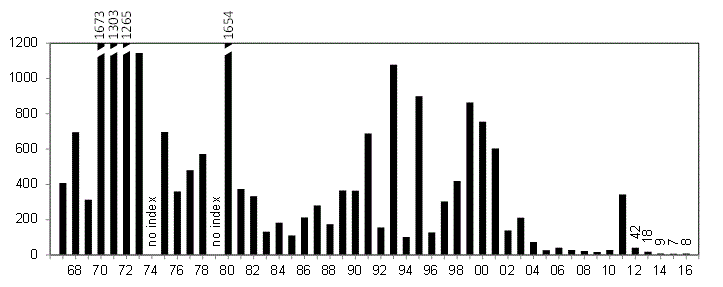
Figure 2. Delta smelt Fall Midwater Trawl Index (1967-2016). Source: CDFW
Spawner-Recruit Analyses
In this report I break down these indices by depicting three relationships: fall adults to the following summer recruits, summer recruits to following fall adults, and fall adults to following fall adults.
The relationship between the fall index of adult spawners to the index of juveniles the following summer is shown in Figure 3. Note the strong positive and highly significant relationship between the numbers of fall adult spawners and the numbers of juveniles that survive to the following summer. This relationship is indicative of the strong role the number of adult spawners (egg production) has on recruitment into the population. Note also the generally lower recruitment-per-spawner in drier years (red years), which is likely the result of a complex of factors related to Delta inflow/outflow and the export of water from the Delta. The population tends to expand (up to 10-fold, one log10 level) with the higher recruitment-per-spawner in wet years and tends to contract with the lower recruitment-per-spawner in dry years. There is also a strong pattern of reduced abundance in the past three decades, starting with a sharp decline in recruits per spawner in the 80’s and 90’s often attributed to the proliferation of exotic clams, the 2001-05 period often referred to as the Pelagic Organism Decline (POD), and the drought periods of 2007-09 and 2012-15.
A closer look at these patterns in Figure 3 indicates possible explanations for the overall 50-year pattern of trending lower numbers of spawners and recruits, and recruits per spawner, over time. In the 70’s, the population expanded initially with the abundant 1970 year-class that featured a high number of recruits-per-spawner, followed by another increase with the strong 1978 year-class. The population was sustained by high recruits per spawner through the wet and dry years of the 70’s. In the 80’s and 90’s, recruits per spawner dropped sharply in drier years, while remaining relatively high in wetter years. A sharp drop in the spawning population occurred after the 1980 fall peak (red 81). In the 80’s and 90’s, the population had matching upward (Group B) and downward (Group A) movements that maintained the population into the early 2000’s (00, 01, and 02). Despite low recruits per spawner in the 87-92 drought, the population rebounded in the wet years from 93 to 99. The population then took a sharp drop from the high fall level in 99 to the much lower level in 04 and the very low recruit-per-spawner year 05. Again, that latter period corresponds to the POD and a drier 00-05 period with four normal and two dry years. There was a sharp uptick in recruitment per spawner in wetter 10-11 (Group C) following the dry years of 07-09, but the population collapsed again with very poor recruitment per spawner in 2012.
The lower recruits-per spawner in drier years can be explained by low Delta outflows and high exports in winter and spring of drier years. This is best exemplified by comparing Groups A and B in Figure 3. The low recruits per spawner in 05, followed by the drought of 07-09, defined the late 2000’s (Group D). A short recovery period in 10-11 (Group C) was crushed by the poor recruits per spawner in the drought period of 12-16. The poor number of recruits in 15-16 (Group E) is simply a lack of spawners (low eggs) and continuing drought conditions.
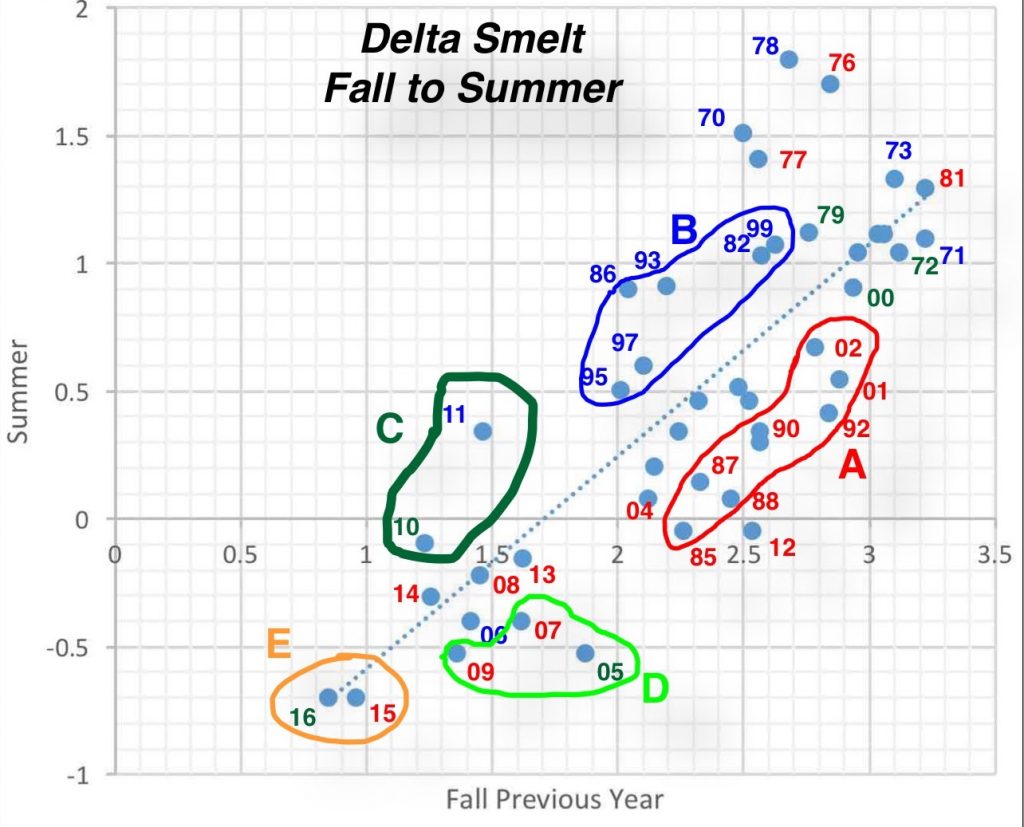
Figure 3. Groupings A to E in Log vs Log plot (Figure 3) of Summer Index of Delta smelt as related to the previous Fall Index of abundance, by year of summer index. Blue years are wet water years (Oct-Sept). Green years are normal water years. Red years are dry and critical water years. Year types are as determined by the California Department of Water Resources for the Sacramento Eight-River Index.
The relationship between summer juvenile production as reflected in the STN index for the year and survival as reflected in the following fall adult FMWT index is shown in Figure 4. The comparison represents the relative survival between summer and fall, most likely reflecting July-September conditions in the Bay-Delta. The strong positive relationship indicates that the number of juvenile smelt in summer determines in large part the population in the fall, adjusted by summer-fall environmental conditions that can significantly affect survival to the fall. Again, Delta inflow/outflow and exports are likely factors in defining the survival relationship, over and beyond the beginning summer numbers of smelt. As in the previous fall to summer relationship described earlier, summer to fall survival is generally higher in wetter years, with notable exceptions. These exceptions are due mainly to the fact that conditions in the Bay-Delta in many summers, regardless of water-year type, are drought-like: there is often little difference between wet and dry year summer-fall conditions. Note the pattern of falling indices over the five decades of the surveys.
A closer look at the pattern in Figure 5 indicates possible explanations for the overall 50 year pattern of trending lower numbers of fall survivors from summer juveniles, and fall production per summer juvenile production level index over time. In the 70’s, the population was high and remained so through 1982. Reduced summer to fall production from 1976-81 led to a lower 1982 population. The subsequent declines from 1982 to 1985 have been attributed to the 80s clam invasion, although there was no apparent decline in summer to fall survival. Poor summer to fall survival in 2004 led to a sharp downward population shift. Group A is indicative of poor over-summer survival in high-export dry years. Group B represents very wet years when part of the population is distributed below the survey area. Group C represents moderately wet years under low to moderate Delta exports. Group D includes wet years and three dry years with low summer exports. Near zero 2015-16 summer indices led to near zero fall indices, a pattern indicative of recruitment failure, where summer production is so low that only low numbers remain in the fall.
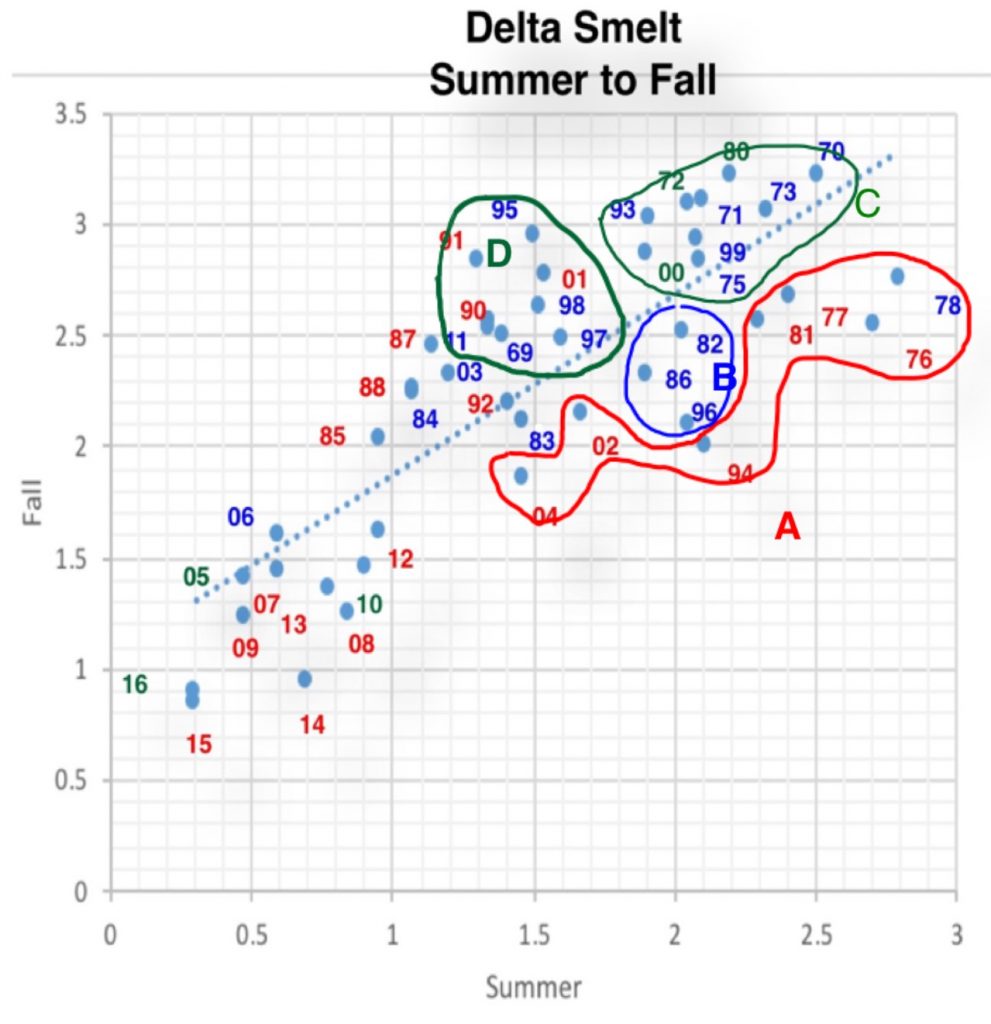
Figure 4. Log vs Log plot of fall FMWT Index of Delta smelt as related to the prior summer STN Index of abundance for that year. Blue years are wet water years (Oct-Sept). Green years are normal water years. Red years are dry and critical water years. Year types are as determined by the California Department of Water Resources for the Sacramento River runoff to the Bay-Delta Estuary (http://cdec.water.ca.gov/cgi-progs/iodir/WSIHIST ).
The plot of LogFall to following LogFall indices (Figure 5) indicates strong recruitment in wet years and poor recruitment in dry years. While the prior year or starting abundance remains the dominant factor as in the above relationships, generally higher recruits-per-spawner occur in wet years and lower recruits-per-spawner occur in drier years. The poor recruitment years (81, 05, and 12) led to sharply negative population shifts. Multi-year droughts 07-09 and 12-15 also led to declining year-to-year population levels. Good recruitment years (e.g., 70, 93, 95, and 11) led to strong positive population recruitment.
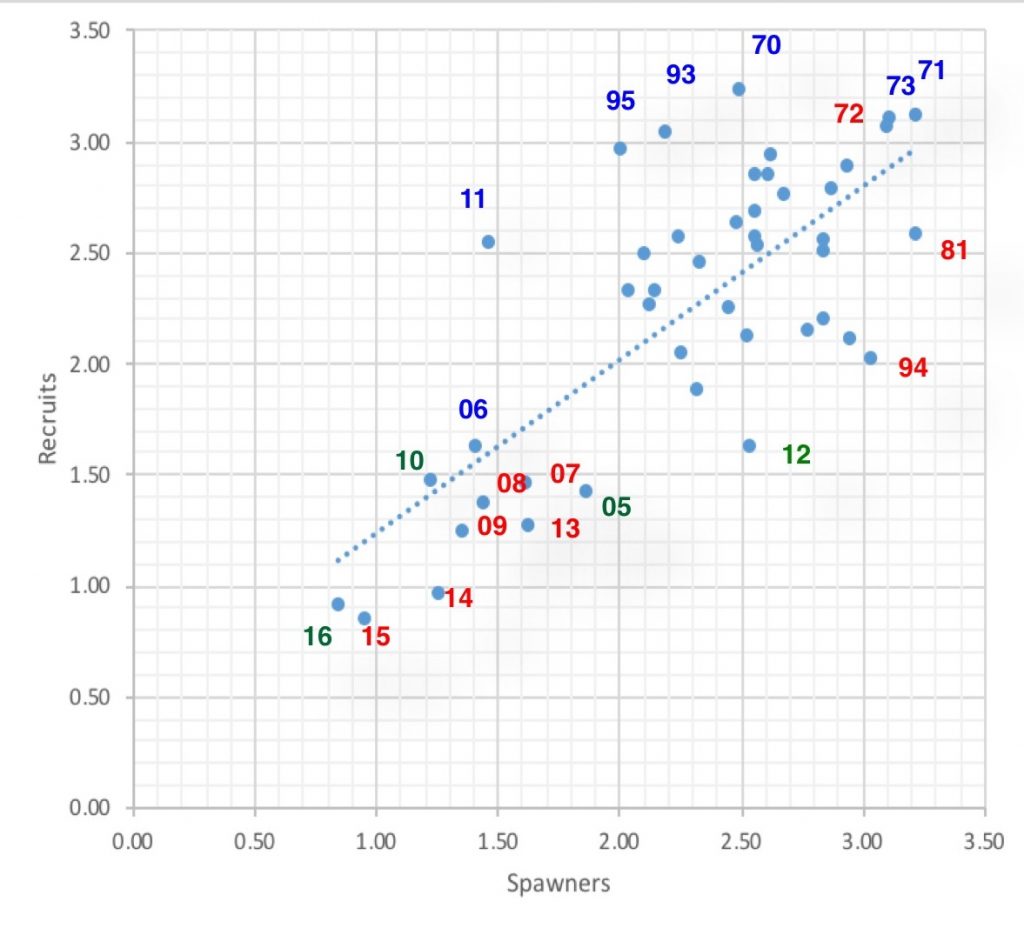
Figure 5. Log vs Log plot of fall FMWT Index of Delta smelt (recruits) vs previous fall index (spawners). Blue years are wet water years. Green years are normal water years. Red years are dry and critical water years. Year types are as determined by the California Department of Water Resources for the Sacramento River runoff to the Bay-Delta Estuary (http://cdec.water.ca.gov/cgi-progs/iodir/WSIHIST ).
Summary
The population dynamics of Delta smelt are characterized by a strong positive spawner-recruit relationship, modified by wet-dry year conditions. Dry year sequences drive population abundance down, hindering future abundance levels. Wet years generally lead to higher recruitment per spawner. The number of spawners remaining in 2017 may be too low to sustain the population and bring about recovery without extraordinary positive measures such as improved flow conditions, reduced exports, and/or stocking of hatchery-reared Delta smelt.
