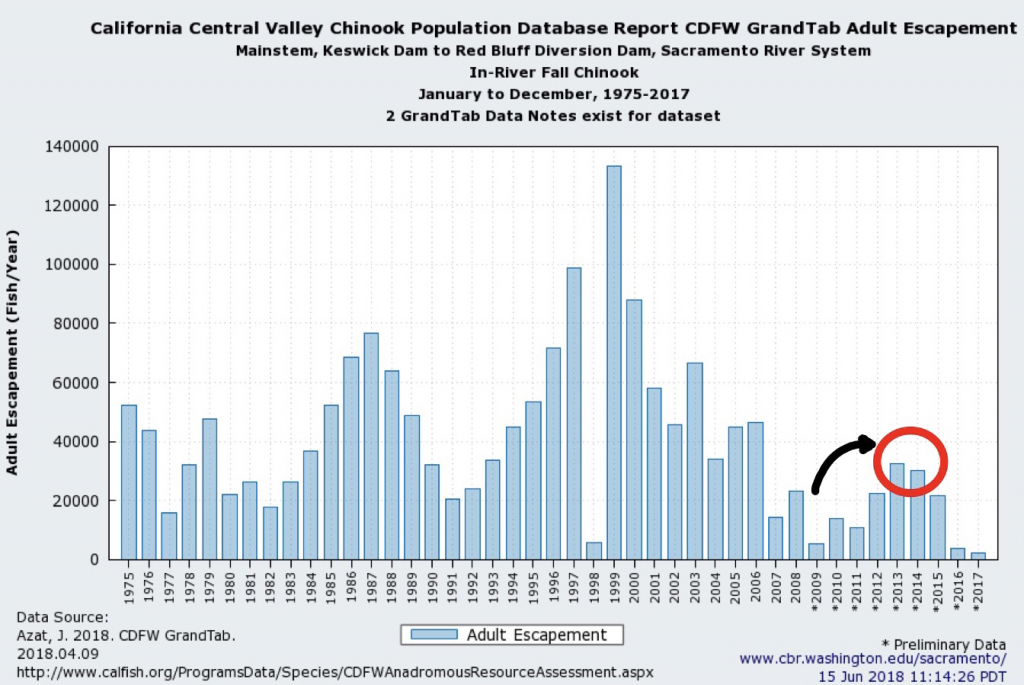
With poor salmon runs from 2009 to 2011, Reclamation provided good conditions in the lower Sacramento River below Shasta Reservoir in spring-summers of 2010 to 2012 for fall-run and winter-run salmon. That effort contributed to recovery of fall-run salmon from the 2007-2009 drought in 2012-2014 (Figure 1). The sequence of below-normal, wet, and below-normal water years (2010-2012) provided sufficient water for good smolt survival, overcoming a significant deficit of adult spawners (eggs spawned). Poor conditions in the subsequent drought of 2013-2015 led to the latest fall-run collapse in 2016-2017.1
So did Reclamation provide good spring-summer conditions in the lower Sacramento River in below-normal, wet, below-normal water year sequence 2016-2018 to help recovery from the latest drought? No. As a result, we can now expect poor runs in 2019 and 2020 instead of a recovery.
2010-2012
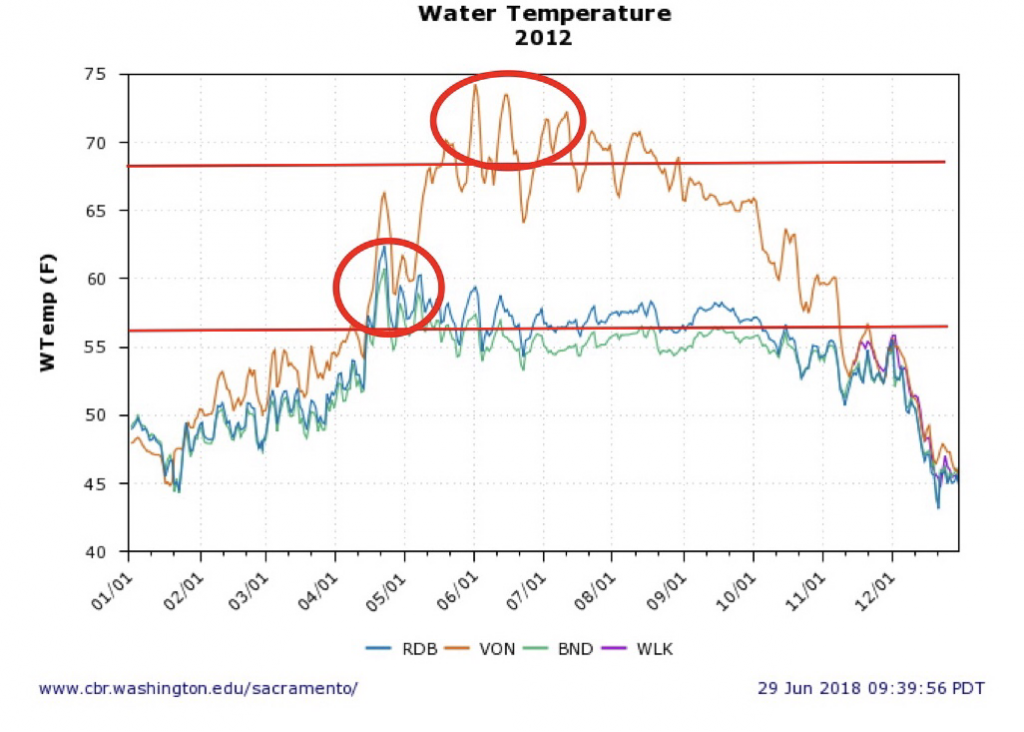
Reclamation made a concerted effort in 2010-2012 to meet water temperature objectives in the upper river near Red Bluff (Bend, Balls Ferry, and Red Bluff) and the lower river near Sacramento (Wilkins Slough, Verona). The 56°F and 68°F water temperature objectives for the upper and lower river, respectively, were regularly met (Figures 2-4) in spring and summer.
2016-2018
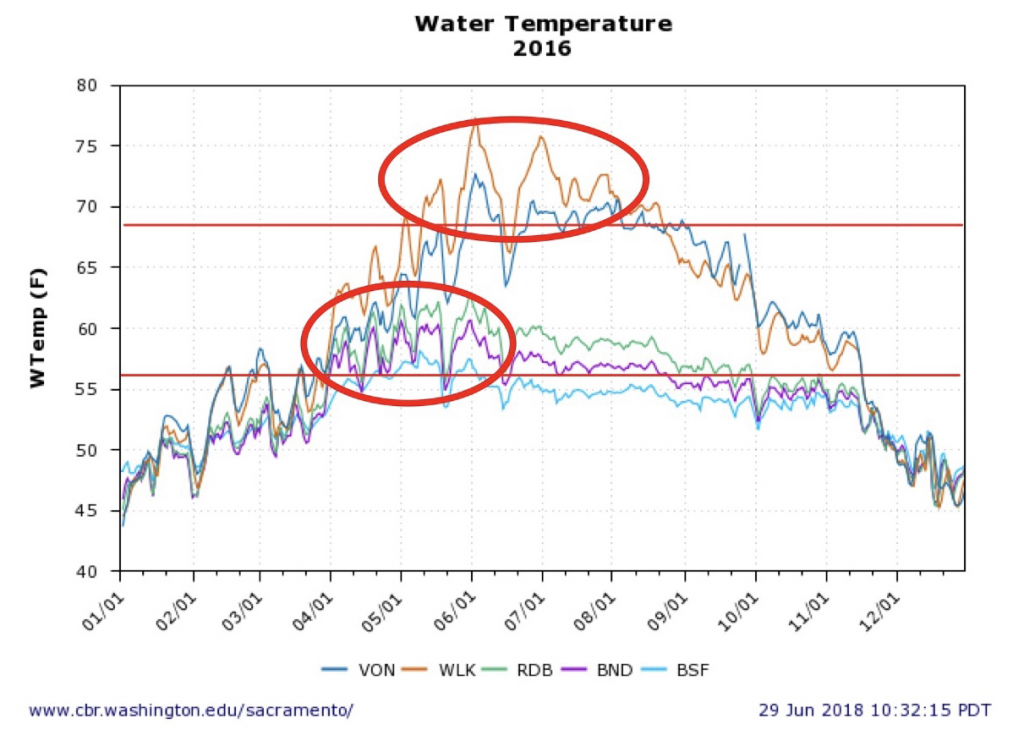
In a less than concerted effort in 2016-2018, Reclamation has failed to meet the water temperature objectives more often and with greater discrepancies (Figures 5-7). More detail on the failure is provided in a recent post.
Problem and Solution
The causal factor is simply lower flows in spring and summer 2016-2018 than 2010-2012 (Figure 8). Lower flows, higher water temperatures, and lower turbidities lead to poor salmon smolt survival (and low adult migrant survival and subsequent egg viability). A concerted effort to recover salmon would mean maintaining water temperature objectives with spring-summer flows in the lower river at Wilkins Slough in the 7000-8000 cfs range instead of the 5000-6000 cfs range (Figure 8). This may require a supplemental release from Shasta Reservoir as in 2012 (Figure 9), which amounted to nearly 200,000 acre-ft of storage release, so that storage ended at 2,600,000 acre-ft at the end of September. The target end-of-September storage in below-normal water year 2018 is 2,300,000 acre-ft. With water deliveries near 2 million acre-ft from the Sacramento River in 2012 and 2018, a “concerted effort” involving 200 thousand acre-ft to maintain water temperature objectives prescribed in the water right permits seems reasonable. Whether it comes from Shasta storage or water contractor deliveries is a management/permitting agency decision.

Figure 1. Long-term trend in upper Sacramento River fall-run salmon escapement. Red circle denotes recovery from low escapement from 2007-2009 drought.

Figure 2. Water temperature in the upper (Red Bluff, Balls Ferry) and lower Sacramento River (Verona) in 2010. Top red line denotes objective for lower river (68°F); bottom line denotes objective for upper river (56°F). Red circle denotes excessive temperatures. In 2010, a below-normal water year following three years of drought had water temperatures near objectives.

Figure 3. Water temperature in the upper (Red Bluff, Balls Ferry) and lower Sacramento River (Verona) in 2011. Top red line denotes objective for lower river (68°F); bottom line denotes objective for upper river (56°F). In 2011, a wet water year had water temperatures near objectives.

Figure 4. Water temperature in the upper (Red Bluff, Balls Ferry) and lower Sacramento River (Verona) in 2012. Top red line denotes objective for lower river (68°F); bottom line denotes objective for upper river (56°F). Red circles denote excessive temperatures. In 2012, a below-normal water year following a wet year had water temperatures near objectives.

Figure 5. Water temperature in the upper (Red Bluff, Bend, Balls Ferry) and lower Sacramento River (Wilkins Slough, Verona) in 2016. Top red line denotes objective for lower river (68°F); bottom line denotes objective for upper river (56°F). Red circles denote excessive temperatures. In 2016, a below-normal water year following three drought years had water temperatures exceeding objectives April through July.

Figure 6. Water temperature in the upper (Red Bluff, Bend, Balls Ferry) and lower Sacramento River (Wilkins Slough, Verona) in 2017. Top red line denotes objective for lower river (68°F); bottom line denotes objective for upper river (56°F). Red circles denote excessive temperatures. In 2017, a wet water year had water temperatures exceeding objectives May through August.

Figure 7. Water temperature in the upper (Red Bluff, Bend, Balls Ferry) and lower Sacramento River (Wilkins Slough, Verona) in 2018. Top red line denotes objective for lower river (68°F); bottom line denotes objective for upper river (56°F). Red circles denote excessive temperatures. In 2018, a below-normal water year following three drought years had water temperatures exceeding objectives April through June.

Figure 8. Summer flow in the lower Sacramento River (Wilkins Slough) in 2010-2012 and 2016-2018.

Figure 9. Releases of water from Keswick Reservoir to the lower Sacramento River in 2012 compared to 54 year average.
