
In previous updates in 2016 and 2017, I remarked on progress toward increasing San Joaquin watershed salmon runs during the recent 2013-2015 drought period. I attributed the improvements to several positive factors:
- Increased production from Mokelumne and Merced state hatcheries. Both the Stanislaus and Tuolumne runs benefitted from strays from the two hatcheries, as well as from strays from the three Sacramento River hatcheries (Battle Creek, Feather, and American).
- River and Delta flow improvements in spring and fall mandated by federal biological opinions.
- Stronger runs in the Stanislaus River from improved flow and water temperature regimes in the Stanislaus and in the San Joaquin below the mouth of the Stanislaus. Fall temperatures below 60oF in the Stanislaus and below 65oF in the San Joaquin proved beneficial to the Stanislaus run, likely by attracting hatchery salmon as well as wild strays from the Merced and Tuolumne rivers.
I also attributed past very poor runs to drought conditions during rearing and during adult spawning runs, exactly the conditions of the 2015 run. However, the 2015 run was much better than expected, likely because of hatchery strays.
In this post, I update the previous assessments with new information on the 2016-2018 runs. The 2016 and 2017 runs were the product of rearing conditions in the 2014 and 2015 critical drought years, as well as wetter-year fall adult migration conditions. The 2018 run was a product of normal-water-year rearing (2016) and adult migration (2018) conditions.
The 2016 and 2017 runs were strong in the Stanislaus and Merced rivers (Figure 1), with both rivers benefitting from hatchery production and strays. One strong component of the strays was the unusually high proportion of strays from the Battle Creek hatchery, whose managers’ strategy during the 2014-2015 drought was to truck smolts to the Bay.
The 2018 San Joaquin run was lower, but still a strong improvement over the drought-influenced runs in 2007-2011 (Figure 1). Spring rearing conditions in 2016 and fall adult migration conditions in 2018 were generally better than they were during the critical drought years. Also, most of the Mokelumne and Merced hatchery smolts were released to the Bay and west Delta, respectively, in 2016. However, adult salmon migrating upstream in the fall of 2018 were subject to stressful conditions in the lower San Joaquin River, where high water temperatures were similar to the high temperatures there in 2015 and 2016 (Figures 2-4).
An updated spawner-recruitment relationship is shown in Figure 5. Runs from 2016-2018 are shown as red-bordered blue dots labelled from 2014-2016, representing rearing-year conditions for these runs. The recruitment trend remains strong given the generally dry water conditions during the 2012-2016 drought period. The recent recruitment per spawner remains up to 10-fold higher than in the prior two droughts, 1987-1992 and 2007-2009. The best explanations for this improvement remains strong hatchery contributions and better hydrology-related habitat and migration conditions prescribed in the 2008-09 federal biological opinions.
The State Water Resources Control Board is in the process of developing biological goals for fall-run Chinook salmon in the lower San Joaquin River and its three salmon-bearing tributaries. The Board should include goals for escapement as well as the factors that control escapement.
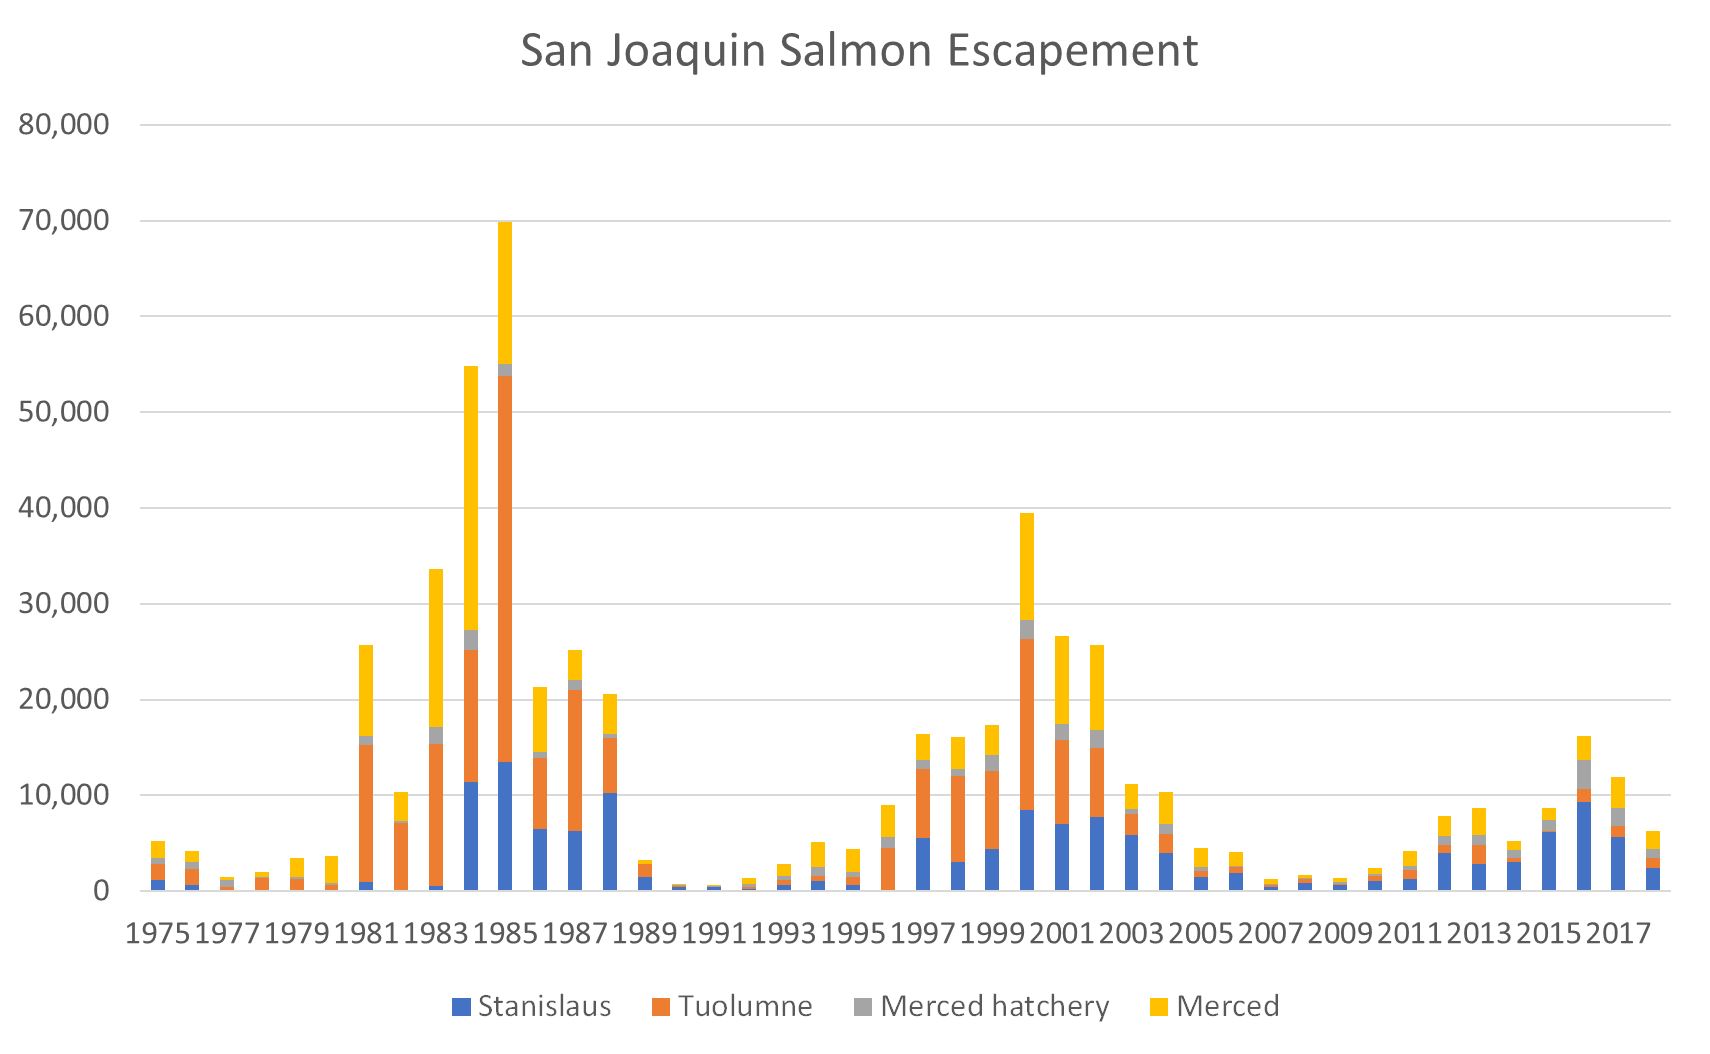
Figure 1. Chinook salmon runs (escapement) in the San Joaquin River from 1975-2018 is made up of components of escapement/run estimates from its three spawning tributaries. Data source: CDFW.
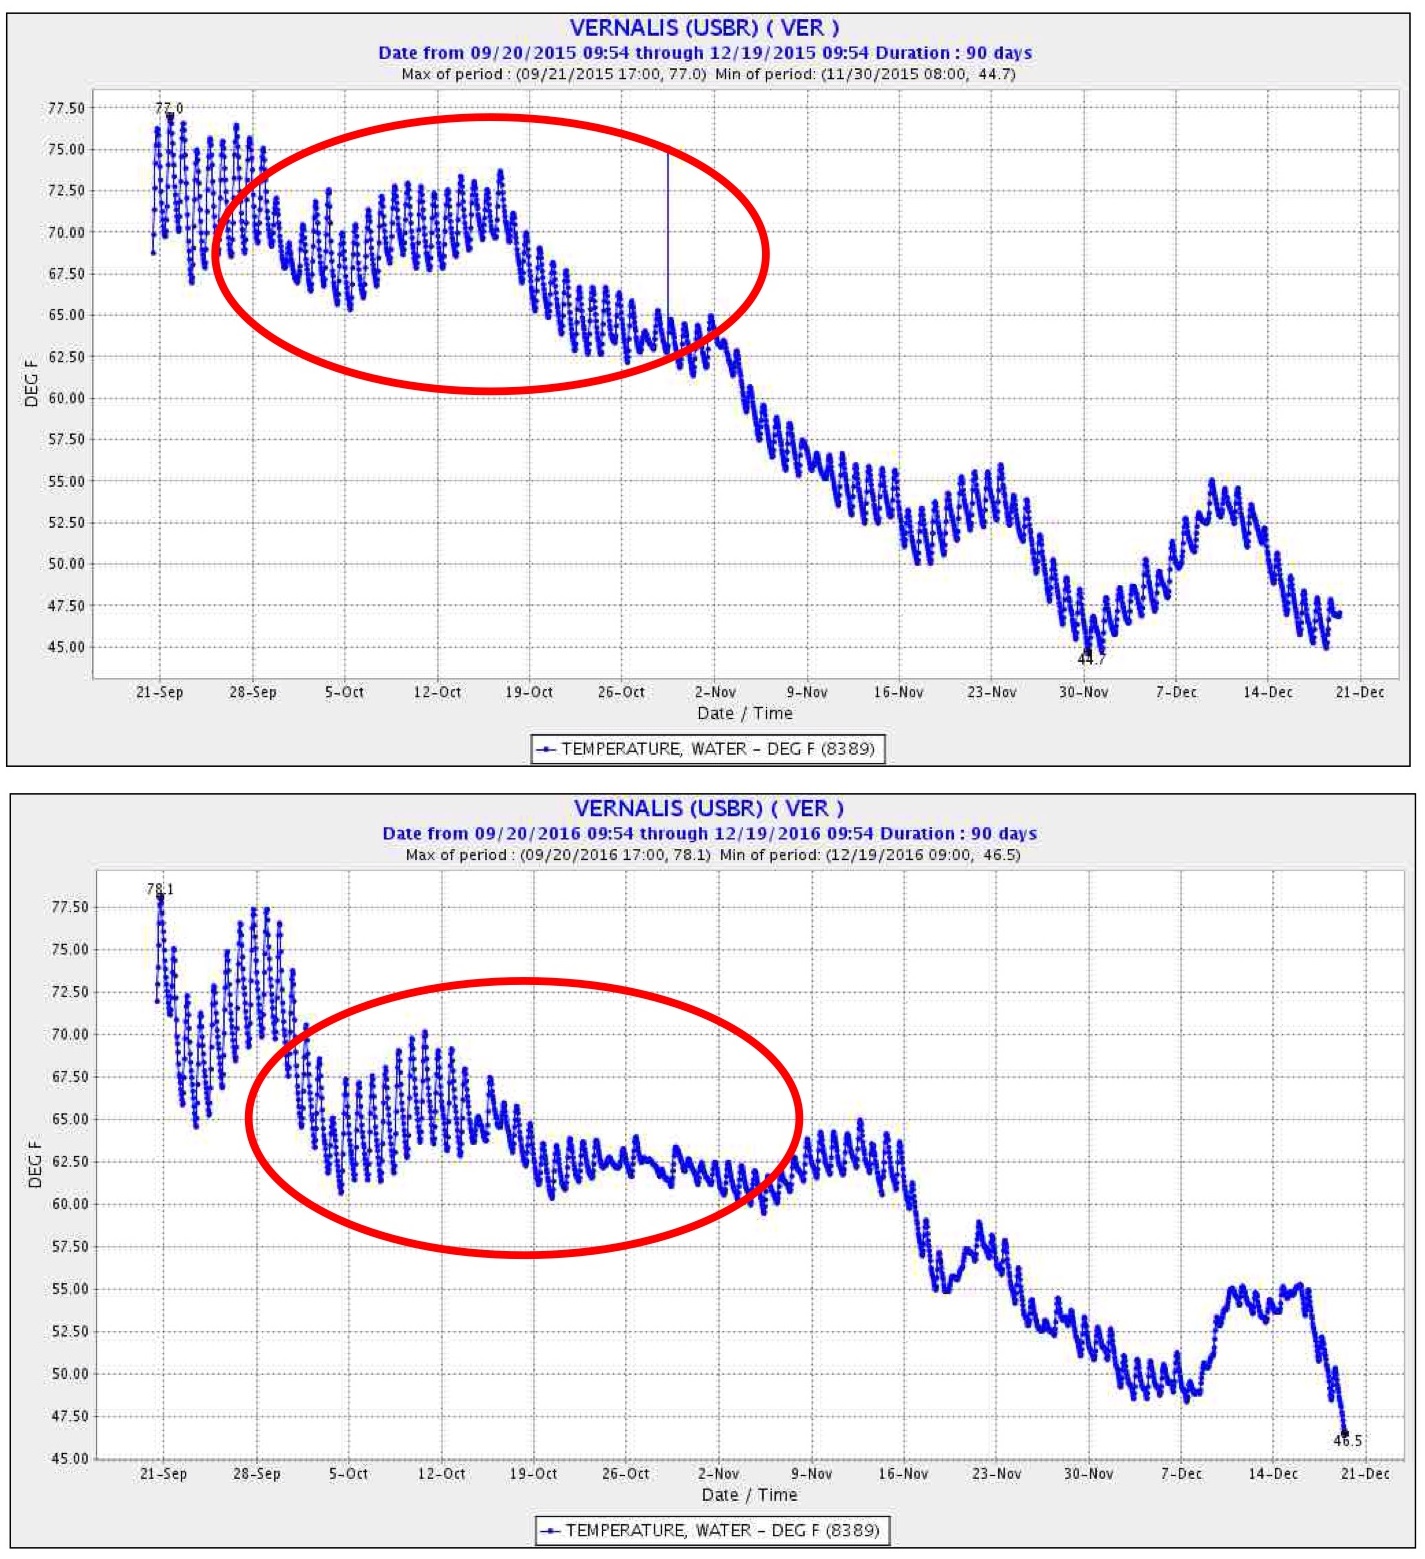
Figures 2 and 3. Fall water temperatures in the lower San Joaquin River downstream of salmon spawning tributaries in 2015, a critical drought year, and 2016, a normal water year.
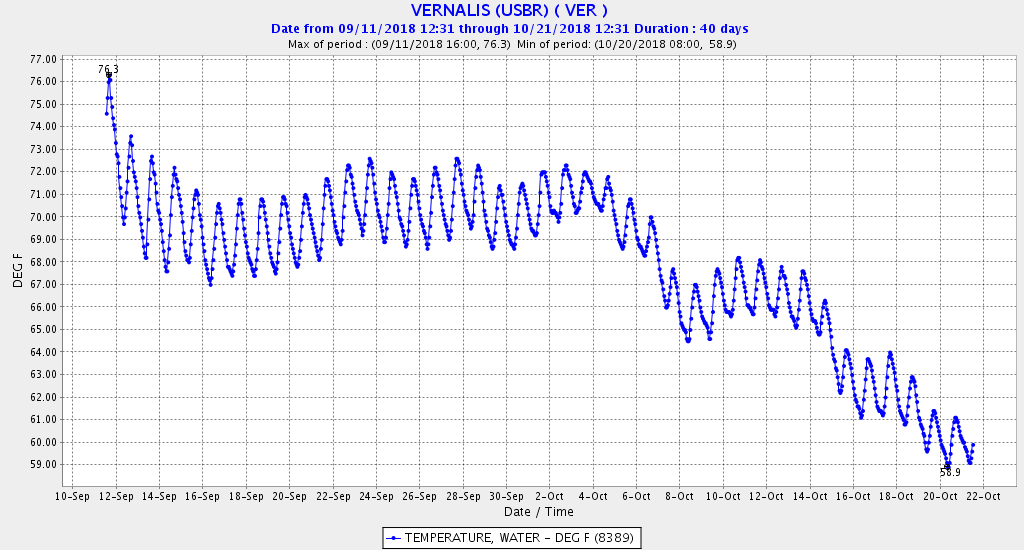
Figure 4. Fall water temperatures in the lower San Joaquin River downstream of salmon spawning tributaries in 2018, a normal water year. Compare with temperatures in red circles in Figures 2 and 3.
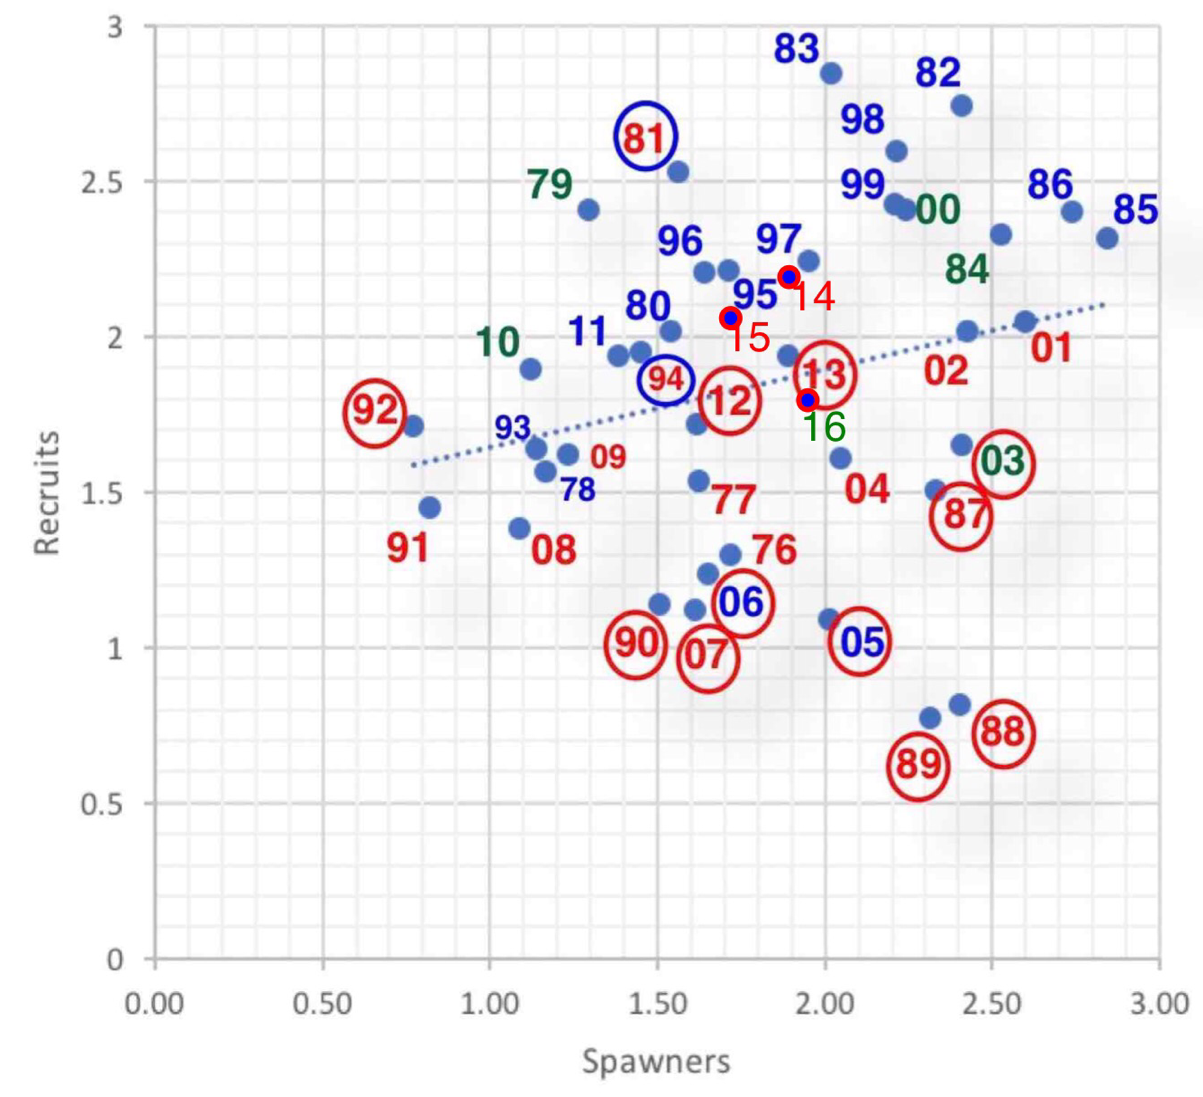
Figure 5. Recruits-per-spawners relationship ((log10X)-2) for San Joaquin River fall-run Chinook salmon 1976-2018. The year shown is the year that the salmon were rearing as juveniles in the rivers in their first year of life. (For example: year 13 represents the progeny of the fall 2012 spawn; these juveniles in 2013 would have predominantly spawned as 3-year-old adults in 2015). Red years are critical and dry water years. Blue years are wet water years. Green years are normal water years. Red circles represent years when fall conditions during spawning would have reduced recruitment (for example: year 13 red circle indicates poor fall conditions during the fall of 2015). Blue circles represent years when fall conditions were good when recruits returned. (For example: year 81 has a blue circle because fall conditions in wet year 1983 were good).