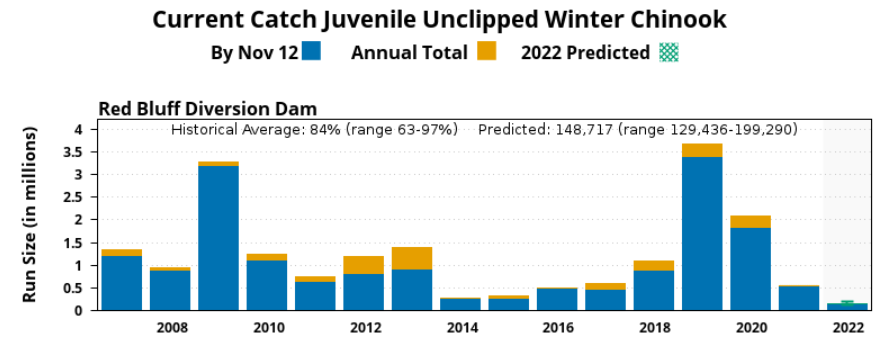
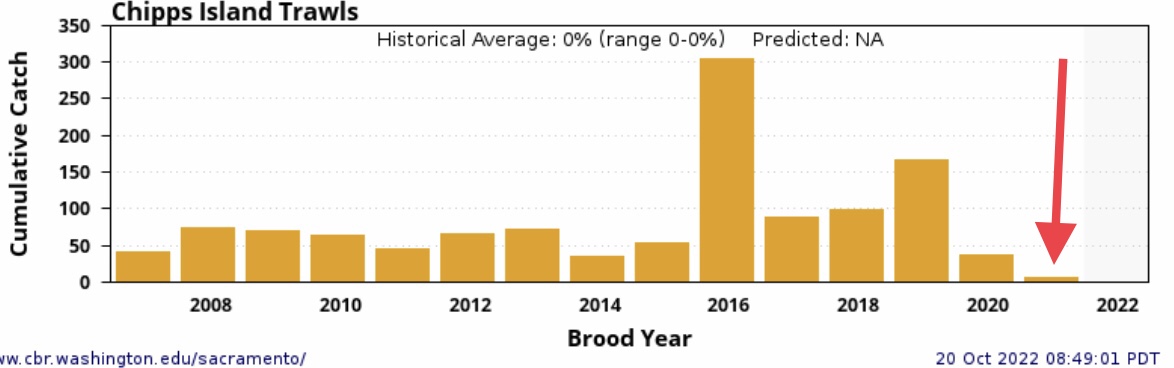
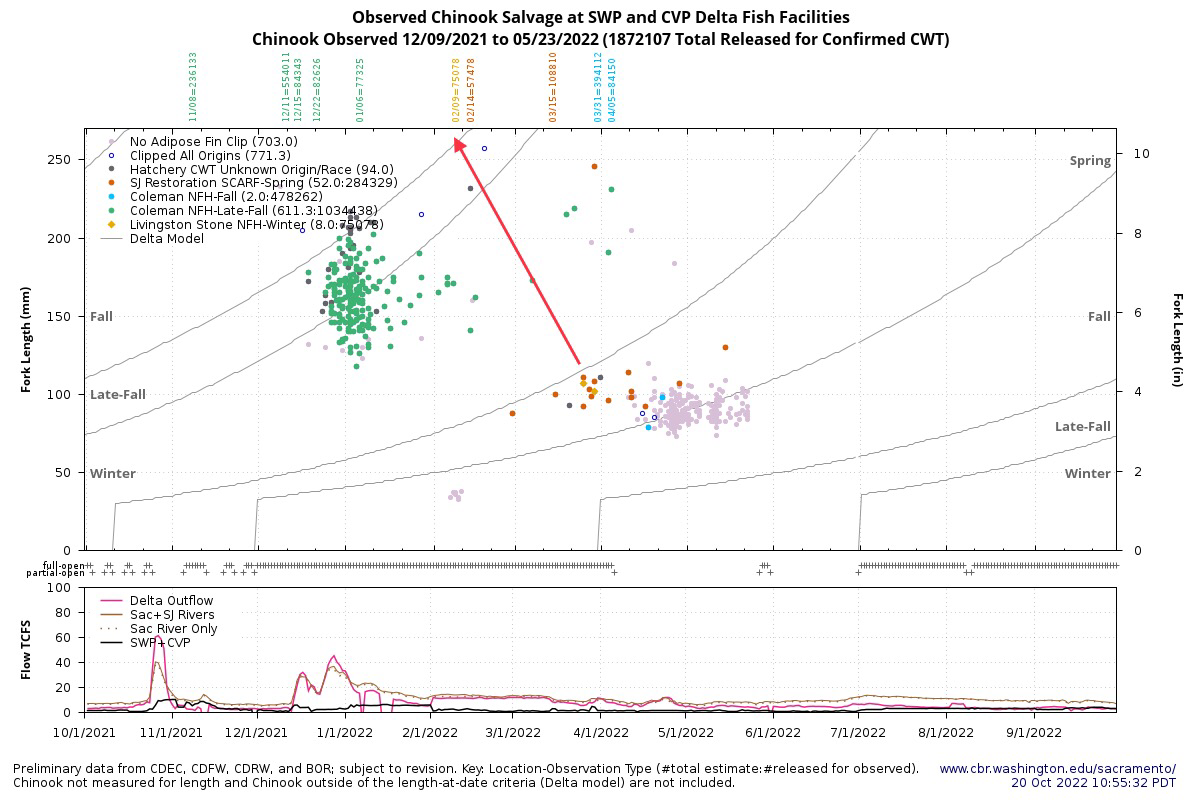
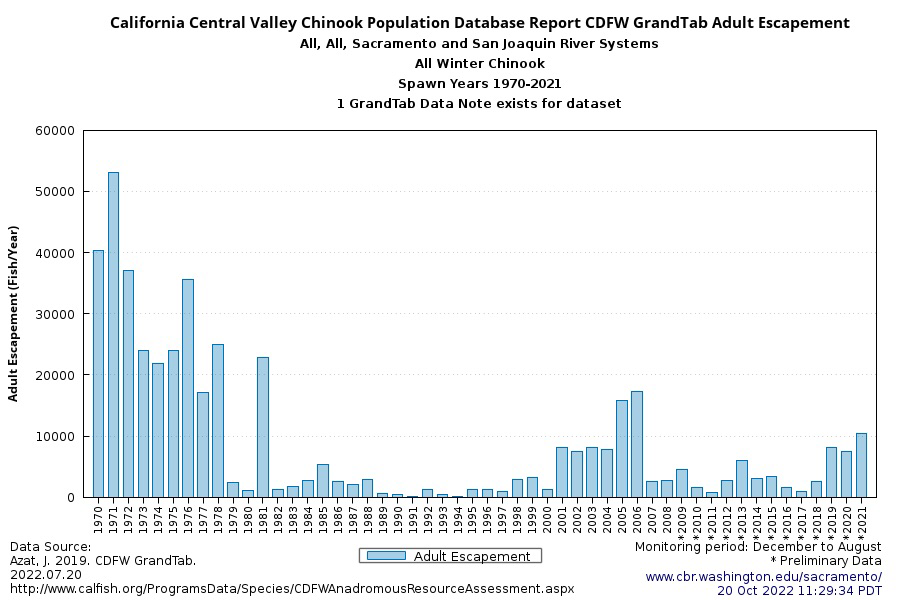
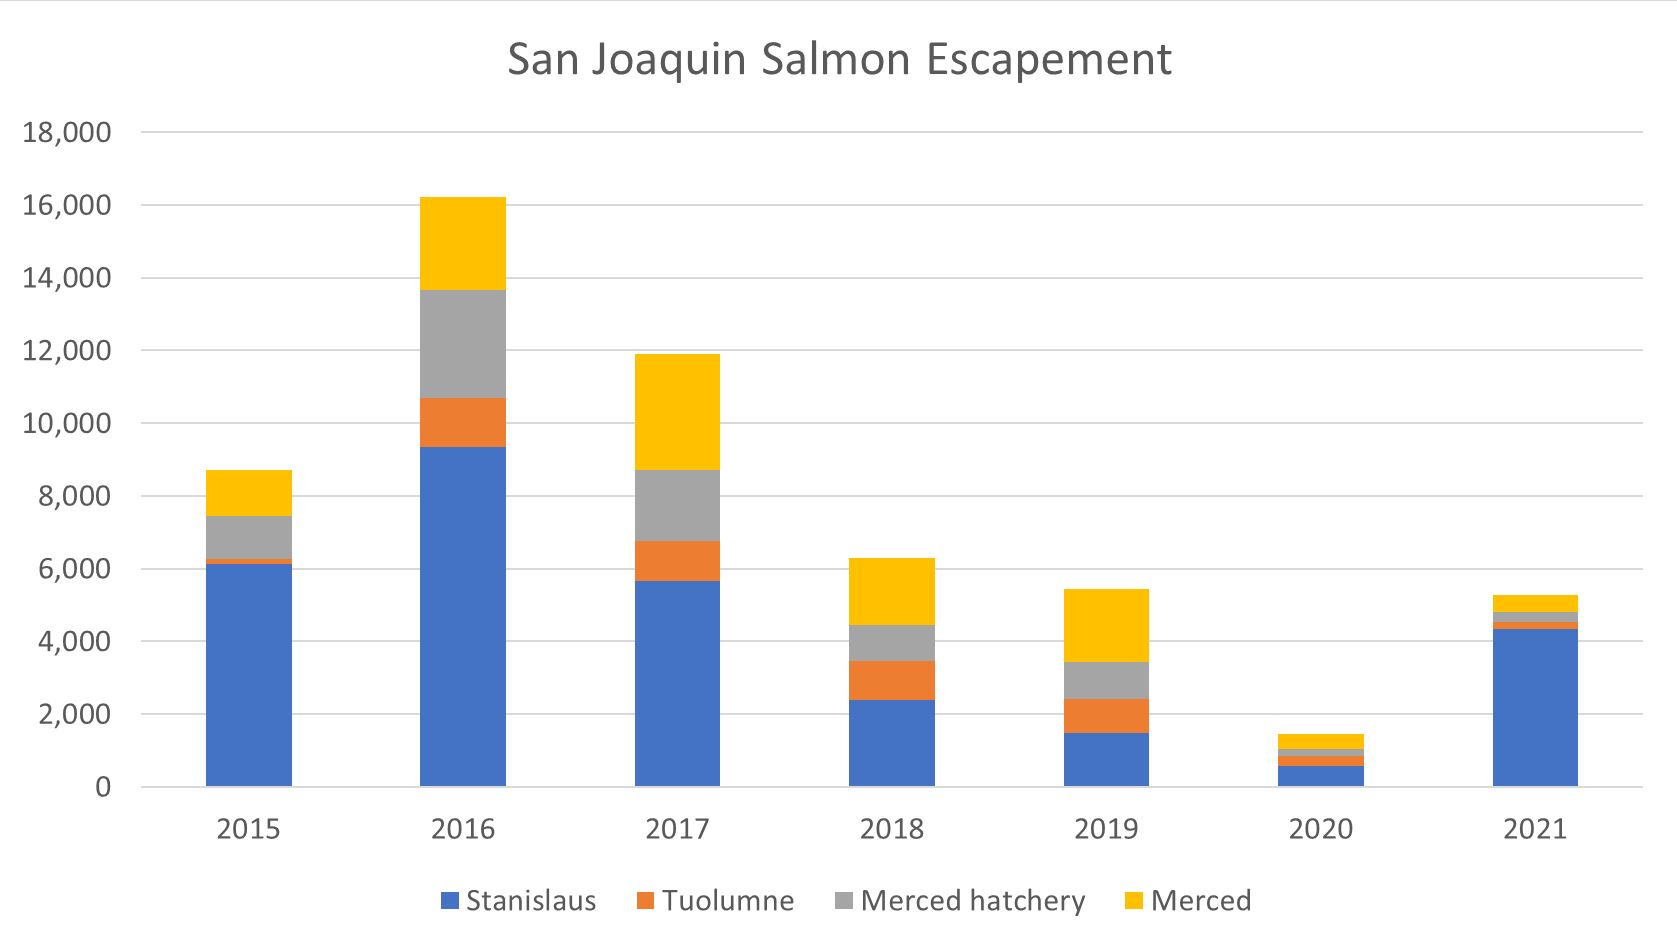
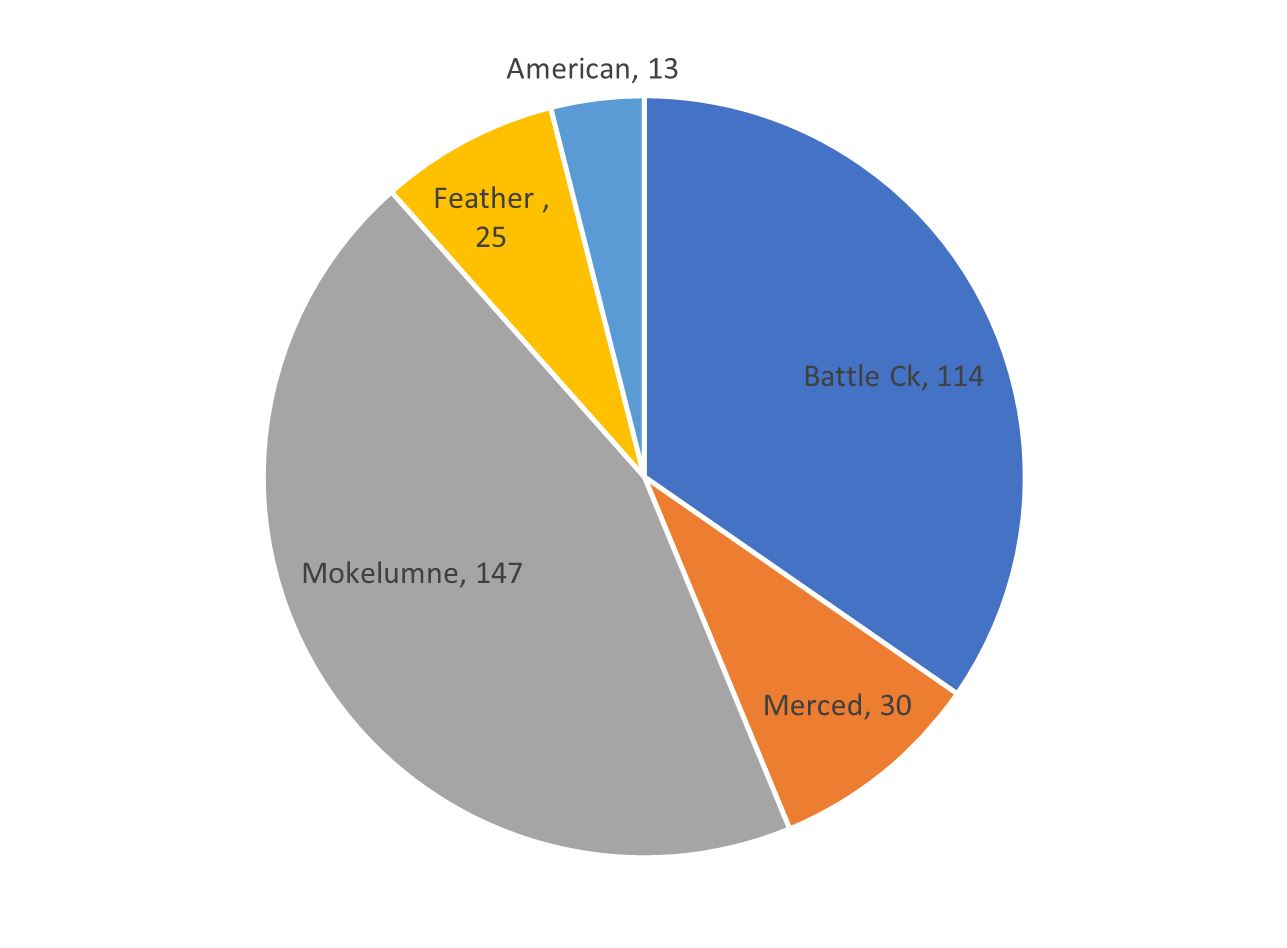
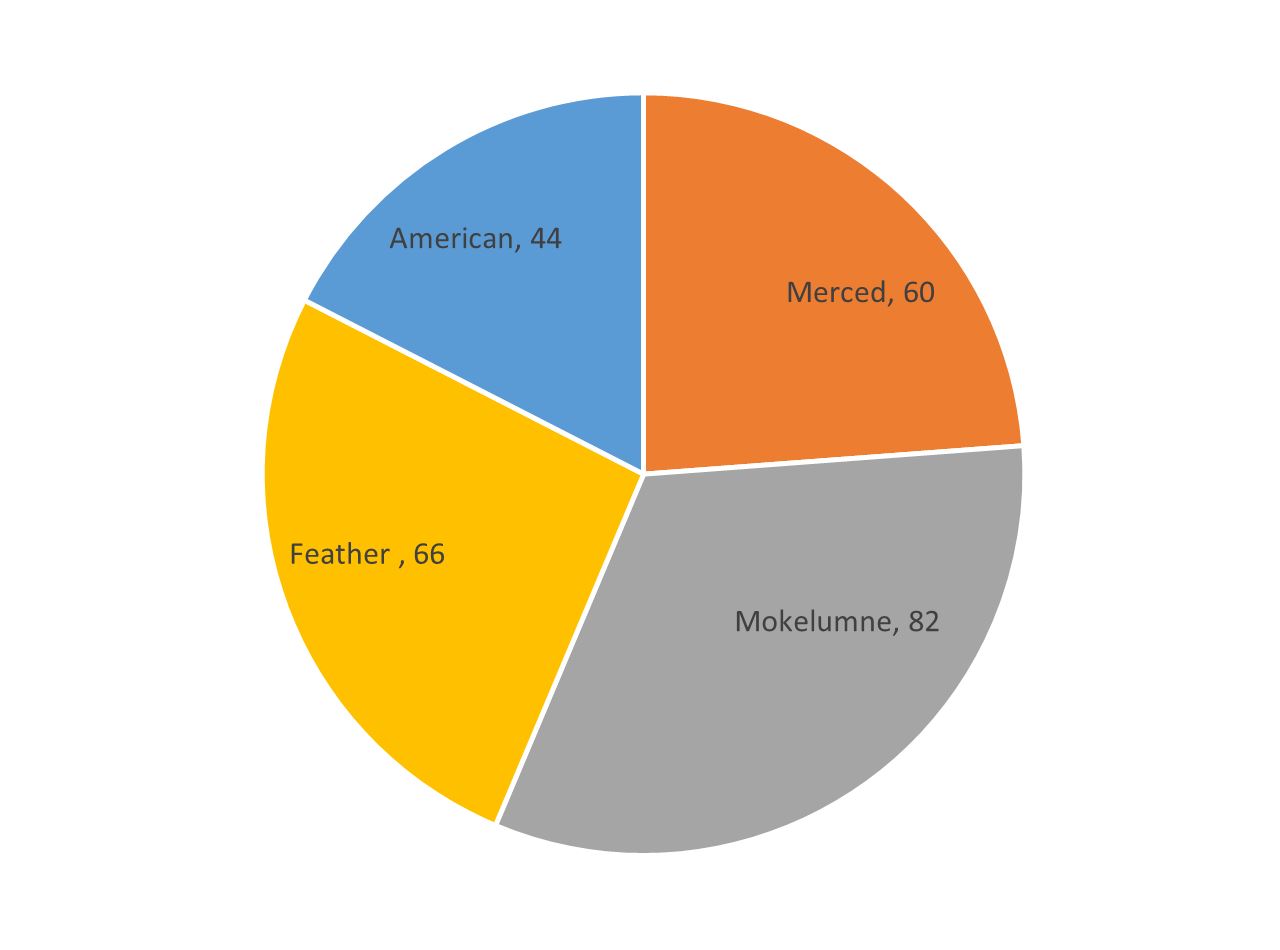
We all know the story of the demise of Sacramento River winter-run Chinook salmon below Shasta Dam over the past several decades (Figure 1).1 But what has happened to the other three Chinook runs: the spring, fall, and late-fall runs? They too have declined (Figure 2-4). Just 50 years ago, 300-500 thousand Chinook salmon ascended the Sacramento River to spawn. This was decades after most of the big Central Valley dams were built. Today, less than 10,000 Chinook salmon return to spawn near Redding. Most of these are Battle Creek and Livingston Stone hatchery fish, plus strays from Feather, American, Mokelumne, and Merced hatcheries. Wild, native Chinook are becoming increasingly rare with each decade.
There are many factors that have led to the demise of Sacramento River Chinook salmon. No doubt, the two major droughts (76-77 and 87-92) had major roles. There was bad management and lack of regulatory protection on many levels. Today, the details of a post mortem are of less value than recognizing the problem and doing something about it.
Much has been tried and accomplished (three of the four runs substantially improved around the turn of the century). A decade of effort and wet years achieved much. However, the three major droughts since (07-09, 13-15, and 20-22) have undone much of those gains and more.
What needs to be done now to bring the salmon back from the brink of extinction is the following:
- Recognize and acknowledge the problem (we haven’t)
- Develop a single integrated, comprehensive plan to solve it (there isn’t one)
- Overhaul the massive salmon hatchery program (we spend huge sums raising and releasing over 30 million salmon smolts each year – the price per pound is astounding – most never reach the ocean)
- Overhaul our salmon fisheries program managed by the Pacific Fisheries Management Council (it’s not working – the stocks are in a constant state of over-fishing – and the fishery is not the most important problem – shutting fishery gates after fish have escaped the corral doesn’t solve the problem)
- Overhaul the Central Valley water supply management system (it’s taking all the water for humans and leaving none for the salmon – don’t let folks blind you, it’s true)
- Overhaul the Central Valley water quality management system (drought “emergencies” routinely bring weakening of standards, wiping out annual salmon runs)
- Rebuild salmon habitat from the ground up (much is gone and what is left is degrading fast, as past and present efforts at watershed restoration literally burn away each year).
- Implement the comprehensive plan with prioritized short- and long-term goals, objectives, and actions.
The sooner we implement these actions the better – Sacramento River salmon are facing a “Passenger Pigeon” moment. The longer we wait, the tougher it is going to be and the less chance there is we will succeed.
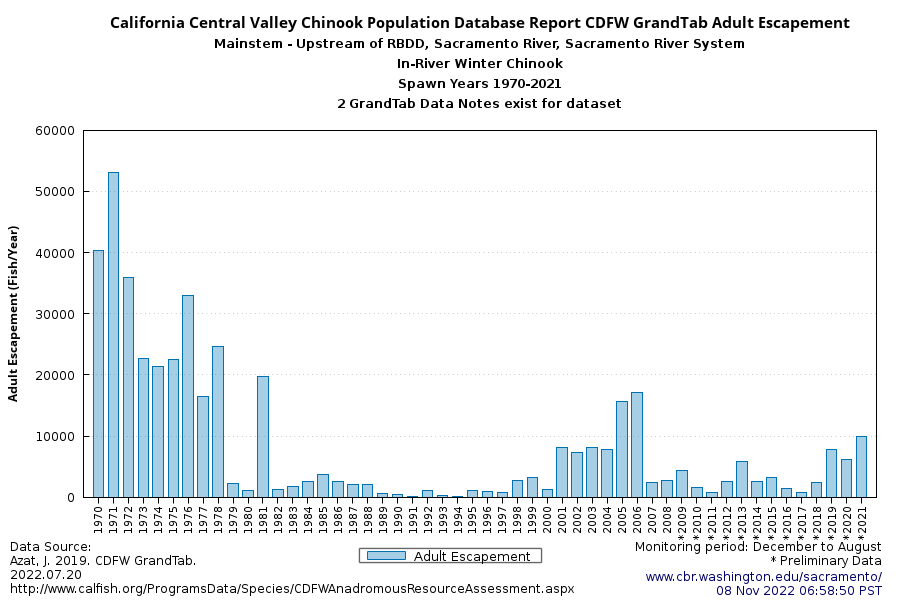
Figure 1. Sacramento River Winter-Run Chinook
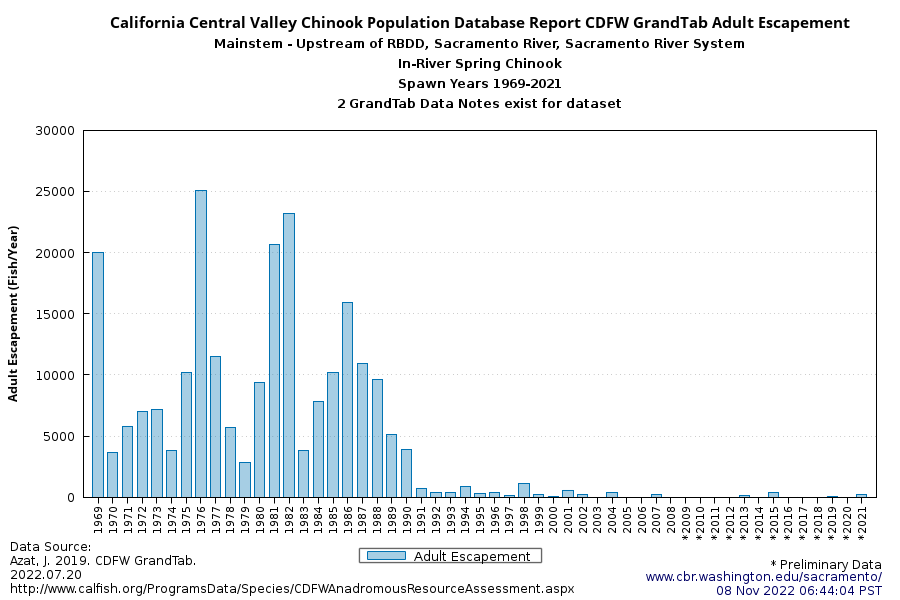
Figure 2. Sacramento River Spring-Run Chinook
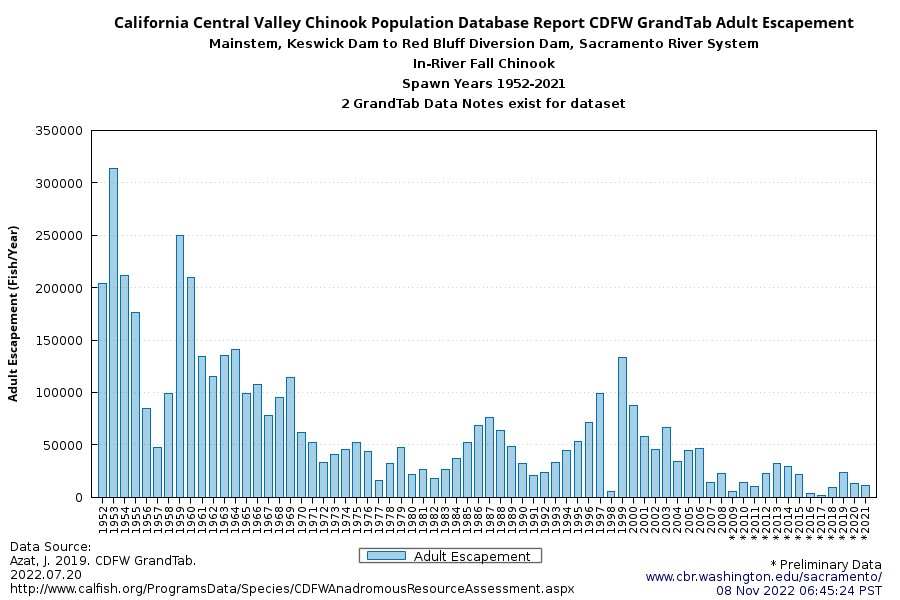
Figure 3. Sacramento River FallRun Chinook
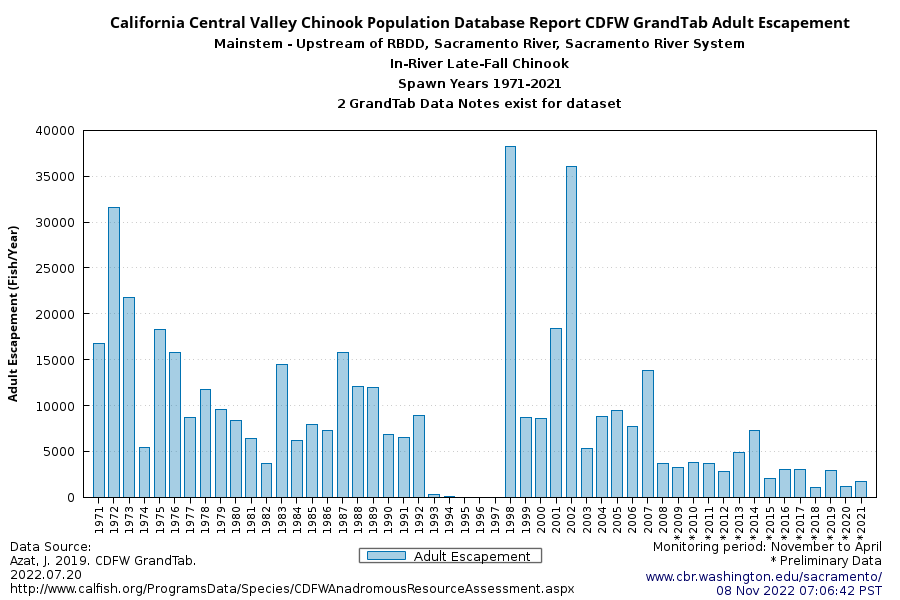
Figure 4. Sacramento River Late-Fall-Run Chinook