
Back on May 3, 2021, I warned about how bad things were getting for salmon in the Sacramento River below Shasta Reservoir, even compared to drought years 2014 and 2015. With high-volume releases from Shasta storage through almost the end of May, conditions went from bad to worse. Water year 2021 began as a critical drought year after a dry year, with everyone scrambling to save the winter-run salmon in the Sacramento River below Shasta and provide water for downstream Central Valley Project (CVP) contractors. The latter objective has won outright.
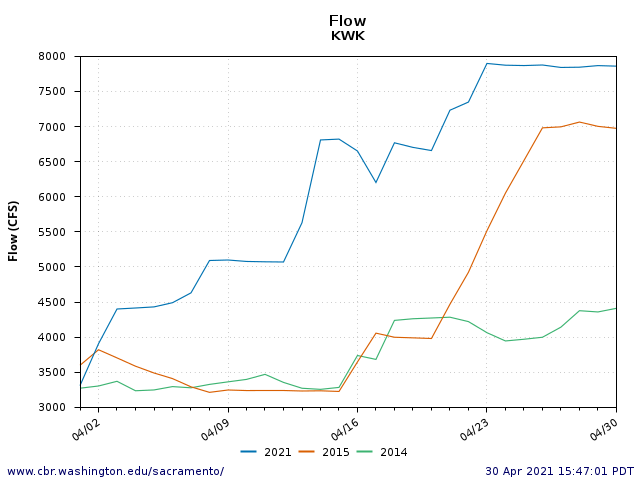
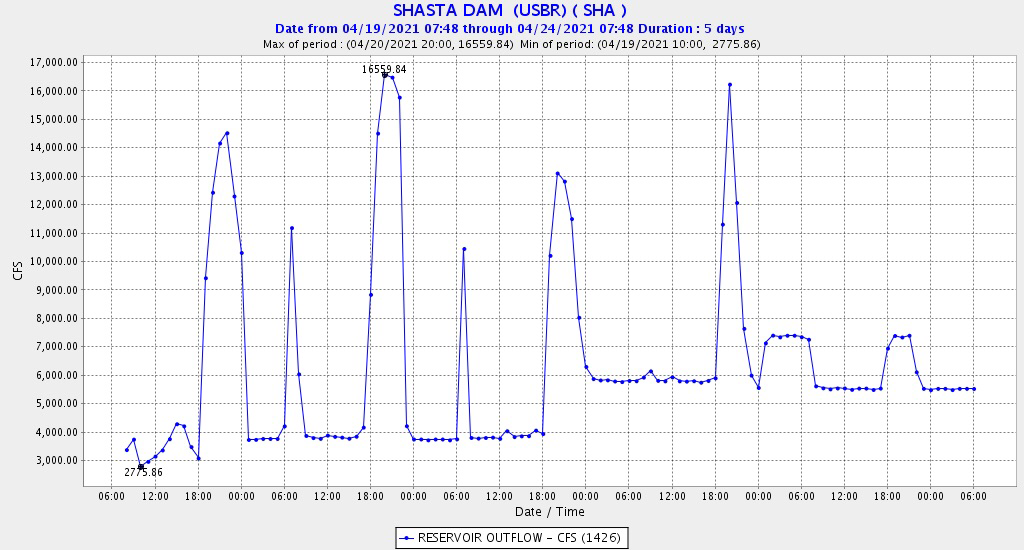
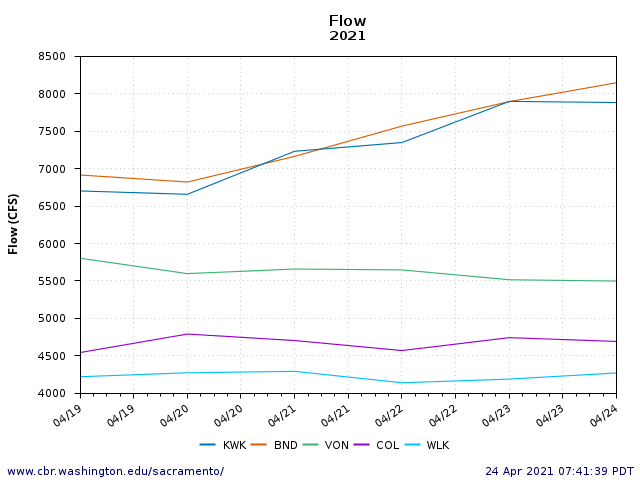
Water releases to the upper Sacramento River were even higher in May than April (Figure 1). Releases remained significantly higher than either 2014 or 2015. Such high releases sustained water deliveries to the CVP’s Sacramento River Settlement Contractors at high levels despite reduced allocations for a critically dry year with low storage.
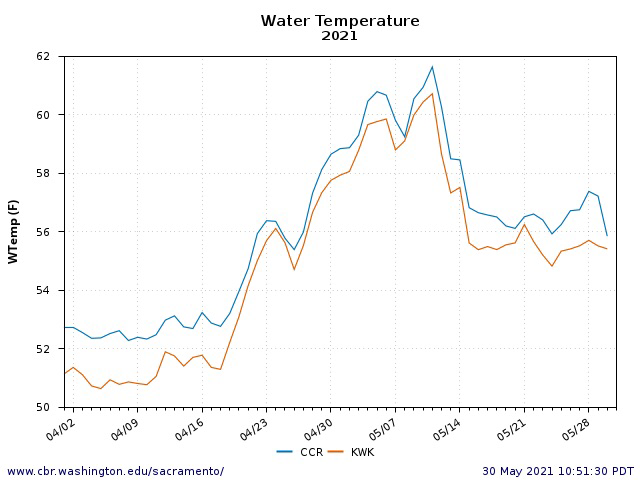
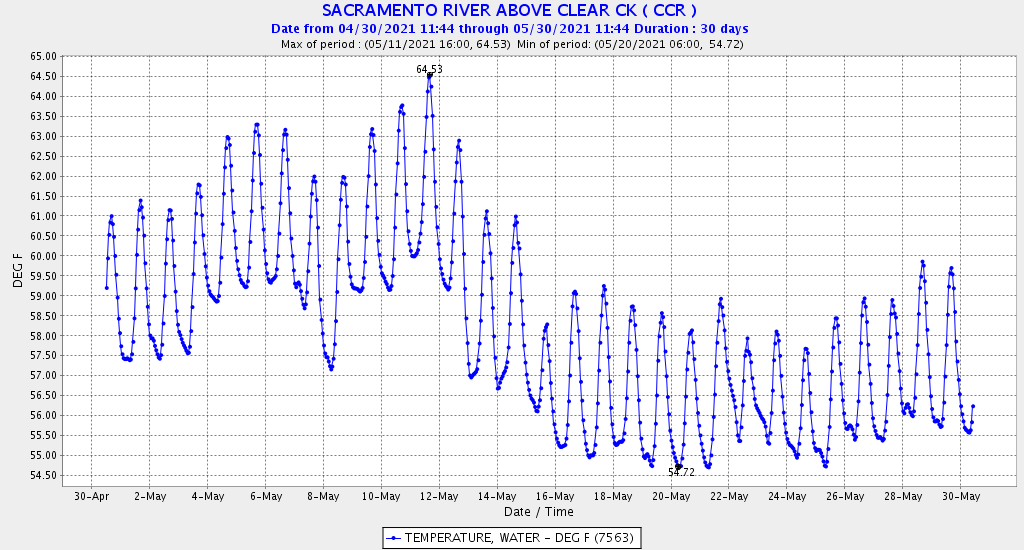
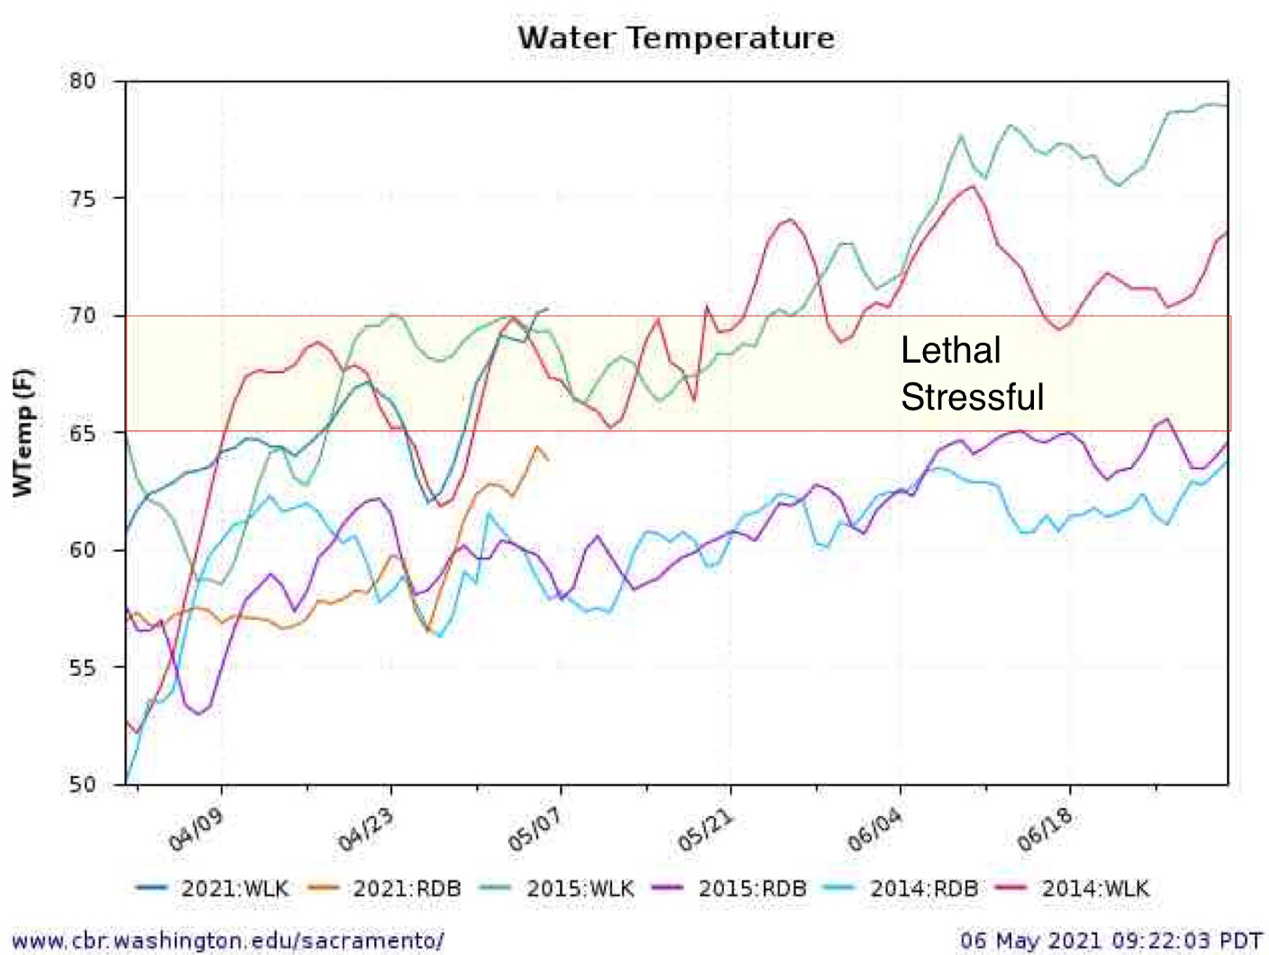
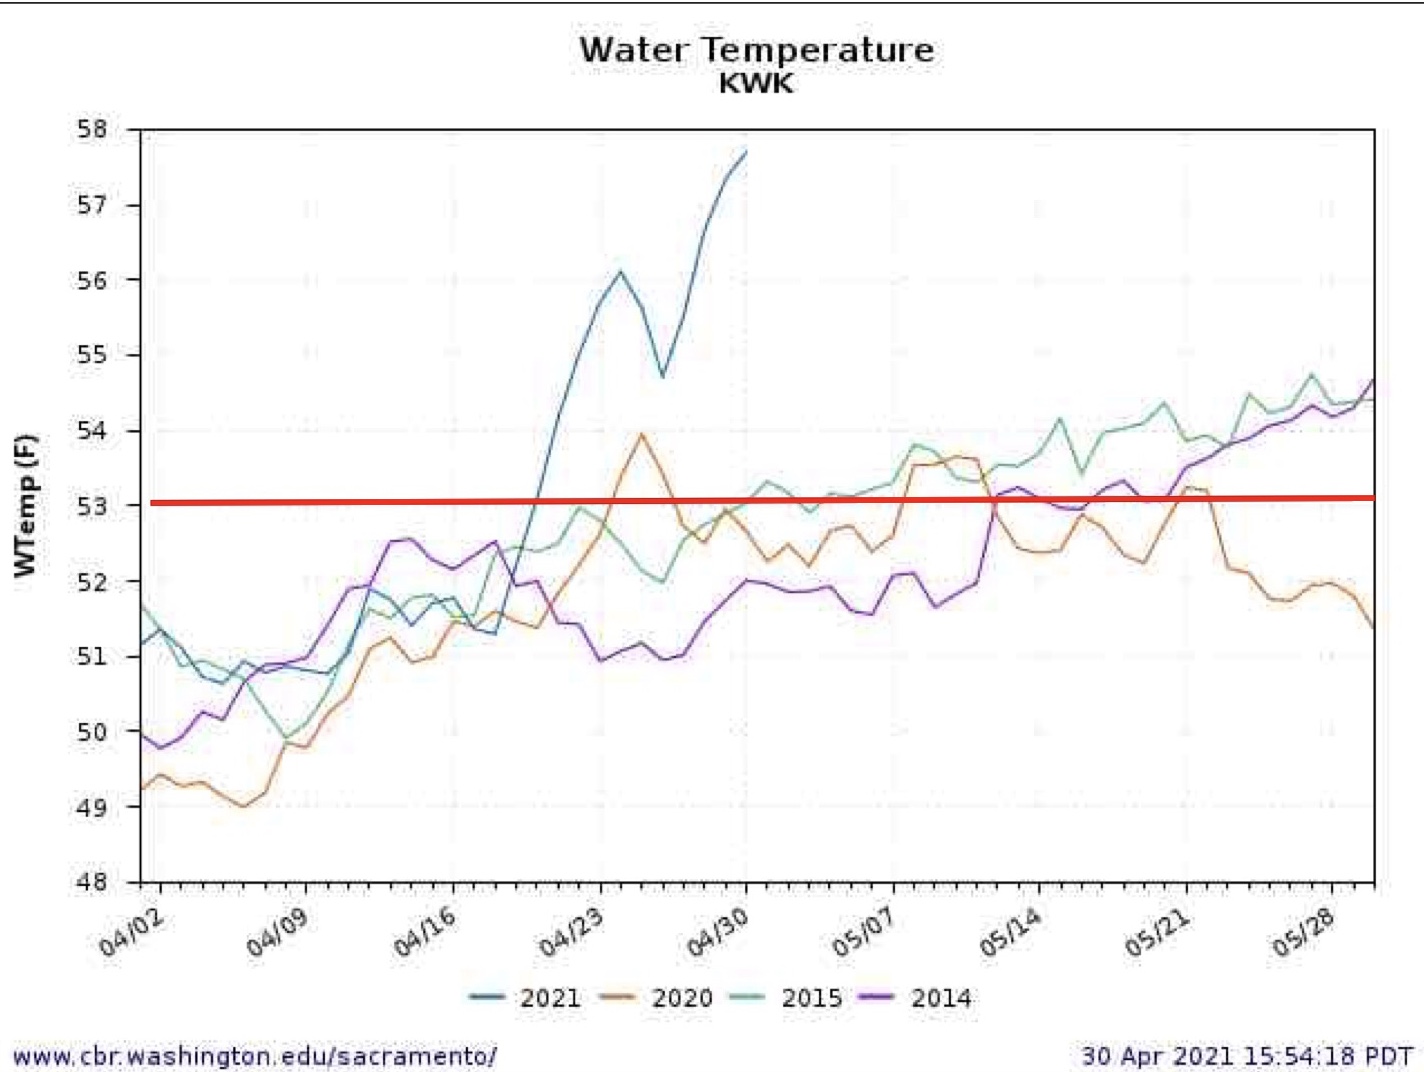
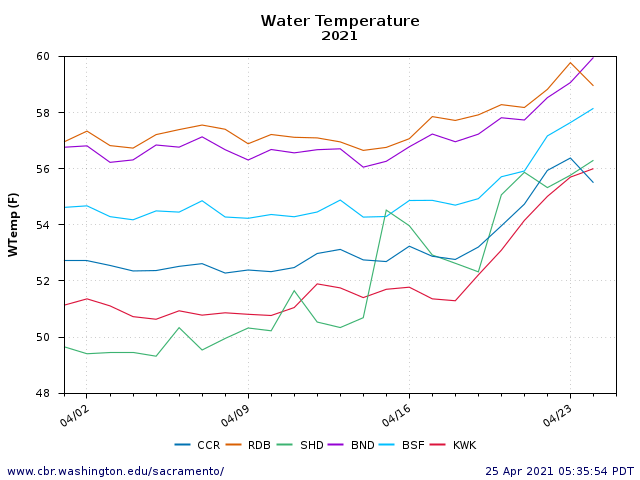
Water temperatures were also significantly higher in May (Figure 2), creating lethal conditions (>53ºF) for eggs of winter-run salmon, which typically begin spawning in April. Peak spawning occurs in June and July, with 60-90% of total spawning by the end of July, even with spawning delayed in warmer years.1 Spawning has likely been delayed in 2021 because of the warmer water temperatures. Delayed spawning also has deleterious effects on egg survival and smolt production.2
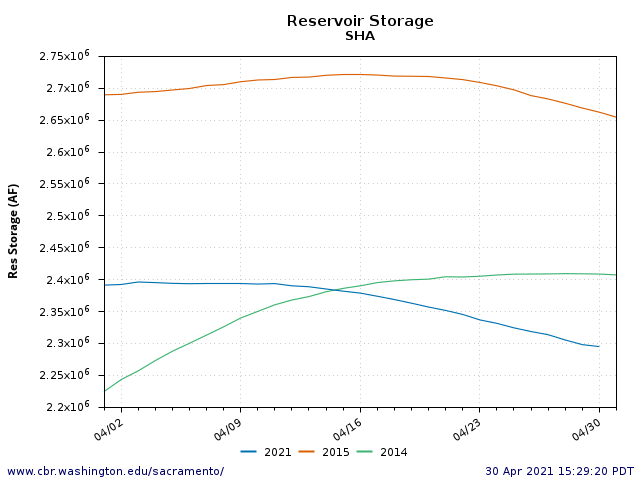
The high-volume releases have led to lower total Shasta Reservoir storage at the end of May in 2021 compared to 2014 and 2015 (Figure 3). Inflows to the reservoir (not shown) were similar in the three years – averaging for May just above 3000 cubic feet per second (cfs).
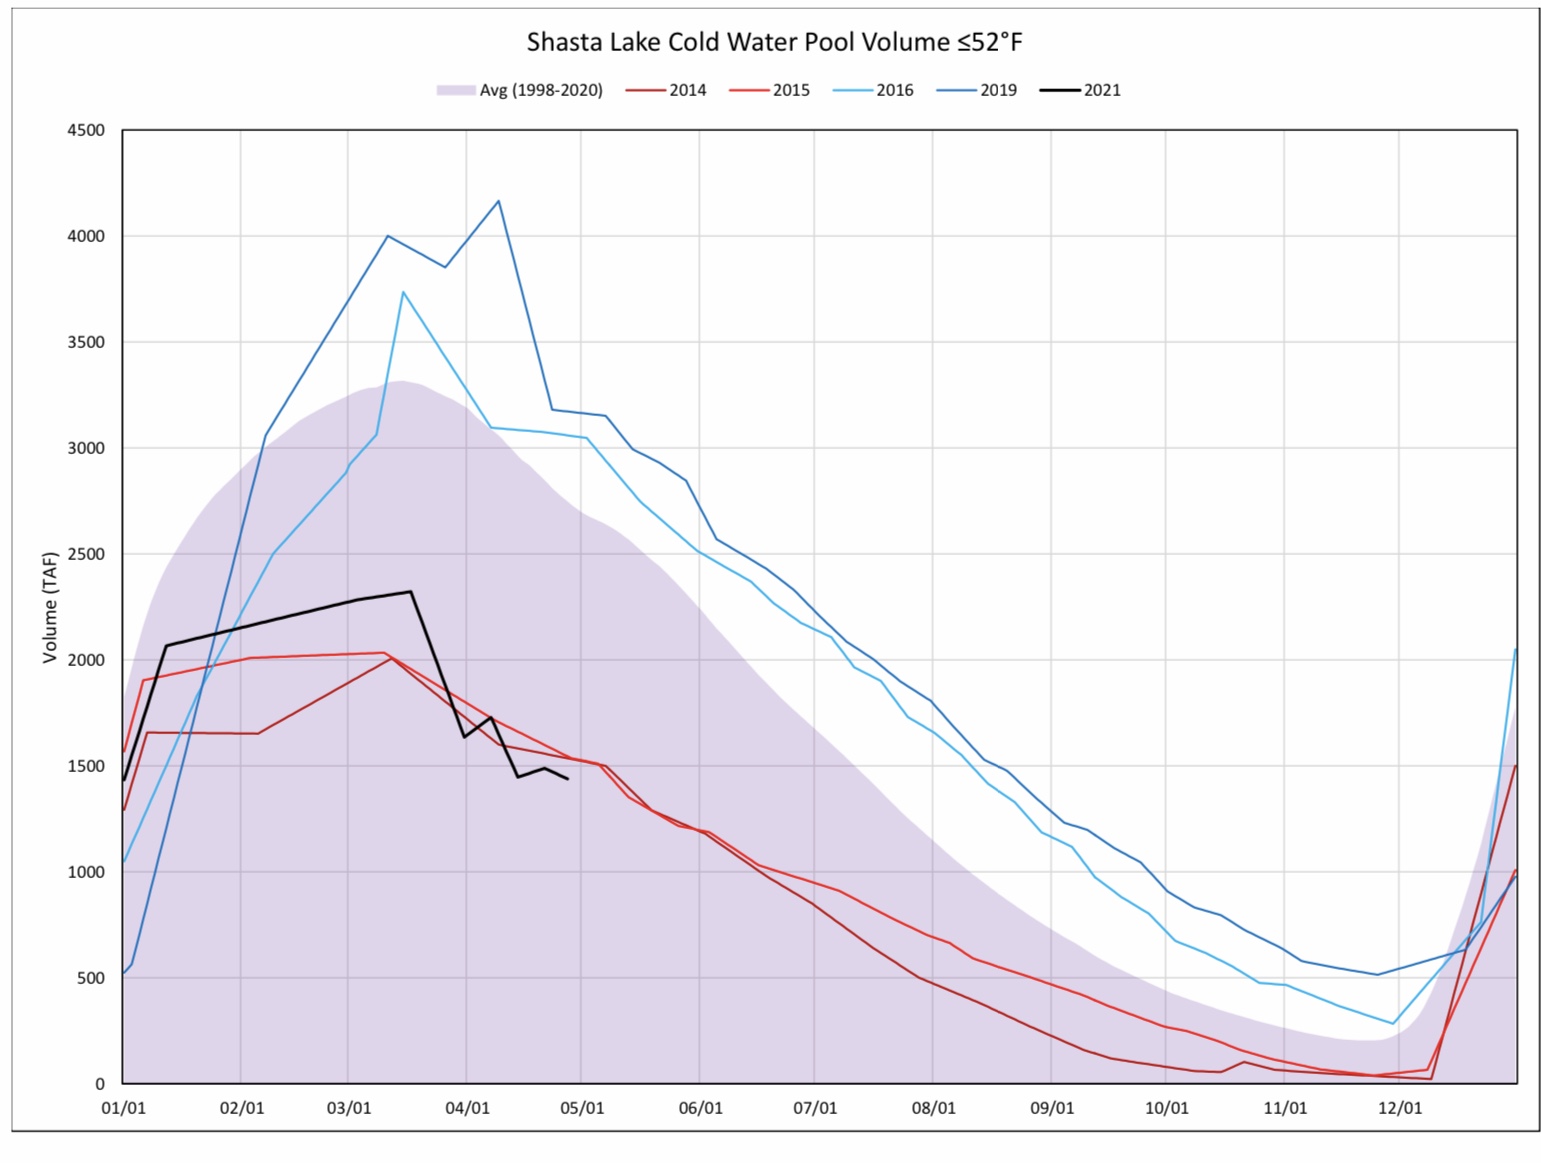
Reclamation has sustained the volume of Shasta Reservoir’s cold-water pool through May 2021 at 2014 and 2015 levels (Figure 4), despite the higher releases and lower storage in 2021. Reclamation did that in part by bypassing power plant releases that draw colder water and instead drawing warmer surface water from “river outlets” nearer the top of the dam (Figure 5).
Reclamation has yet to gain approval for summer operations, but the draft Temperature Management Plan (TMP) it submitted to the State Water Board on May 5 proposed Shasta-Keswick releases of 8000-10,000 cfs. Reclamation’s May 5 draft plan also proposed a target temperature of 56ºF for the 10-mile spawning reach of the Sacramento River just downstream of Keswick Reservoir, around Redding. Such temperatures will lead to high egg mortality this summer. Reclamation’s draft plan included significant inputs of warmer water (>53ºF) originating in Trinity Reservoir and exported to the Sacramento River via the Spring Creek Tunnel from Whiskeytown Reservoir to Keswick Reservoir.
The higher Shasta releases and warmer Trinity water, while proving substantial power generation and water supply deliveries, are depleting already-too-low Trinity and Shasta reservoir storage. They also preclude maintaining the safe water temperature of 53ºF that would minimize egg mortality this summer in the Sacramento River’s spawning reach. Lower storage also results in late summer loss of access to the cold-water pool in Shasta Reservoir.
In a May 21, 2021 letter to Reclamation, the State Water Resources Control Board commented on Reclamation’s draft TMP. The State Water Board’s letter suggested maintaining an end-of-September Shasta target storage of 1,250,000 acre-feet, stating that this would represent a “reasonable balance between temperature control this year, maintaining some carryover storage going into next year, and providing for consumptive water supply needs.” The main problem with the State Water Board’s target 1.25 MAF end-of-September storage is that it would still result in >50% (and potentially much higher) salmon egg mortality. The State Water Board’s target does not correct warm Trinity transfers, excessive Shasta and Trinity releases, and low Shasta and Trinity storage. It would also leave no cold water for Sacramento River fall-run salmon in the fall. The low storage levels may even limit access to cold-water pools in the reservoirs.
Eliminating 80-85% of the warm Trinity transfers and reducing cold water releases from Shasta would save a much greater percentage of the fish in the Sacramento and Trinity-Klamath river systems. It could maintain safe 53-55ºF spawning reach temperatures through the summer, while preserving approximately 500,000 acre-ft of Shasta and Trinity storage for next year.
Such an alternative would cut power production and Sacramento Valley water supply deliveries to roughly half of the levels in 2014 and 2015. In this regard it bears remembering that senior water contractors chose not to absorb some of the water cutbacks in 2020, the first year of the latest drought. Now, drastic delivery cuts are necessary to avoid the third disaster for winter-run salmon in seven years.
For more complete discussion, see CSPA’s May 23, 2021 alternate Temperature Management Plan at https://www.waterboards.ca.gov/waterrights/water_issues/programs/drought/sacramento_river/.
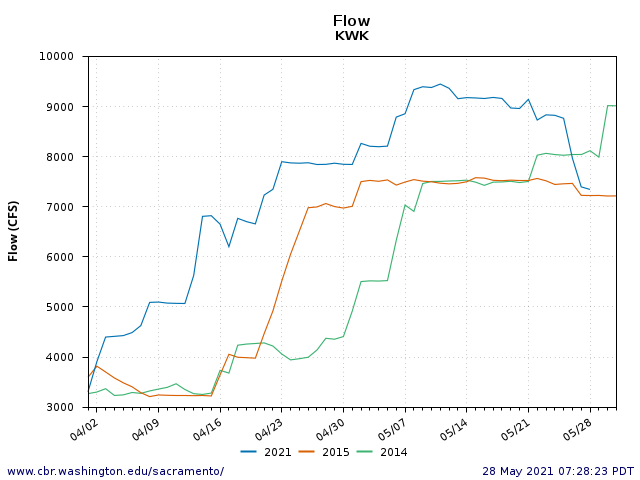
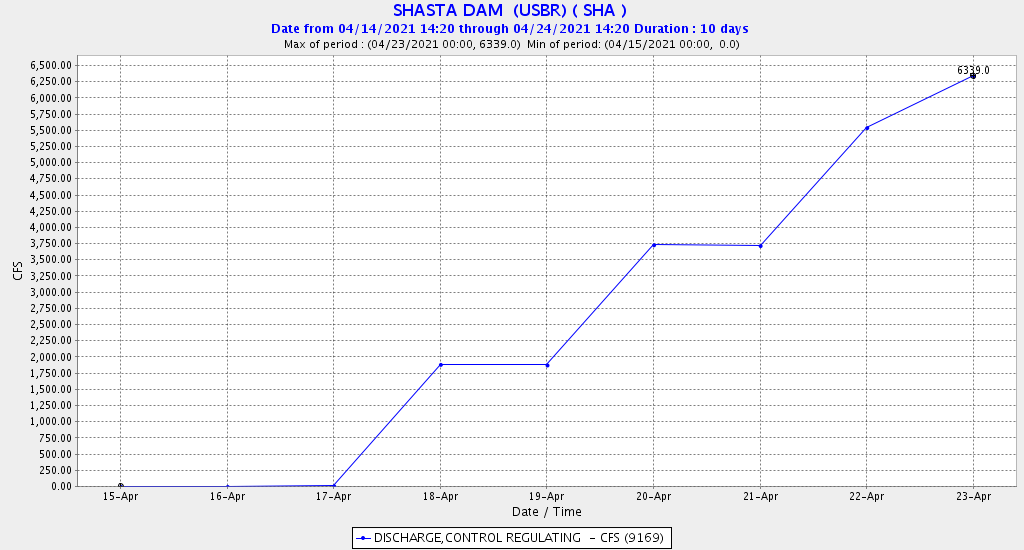
Figure 1. Keswick Reservoir water releases (cfs) in April-May 2014, 2015, and 2021
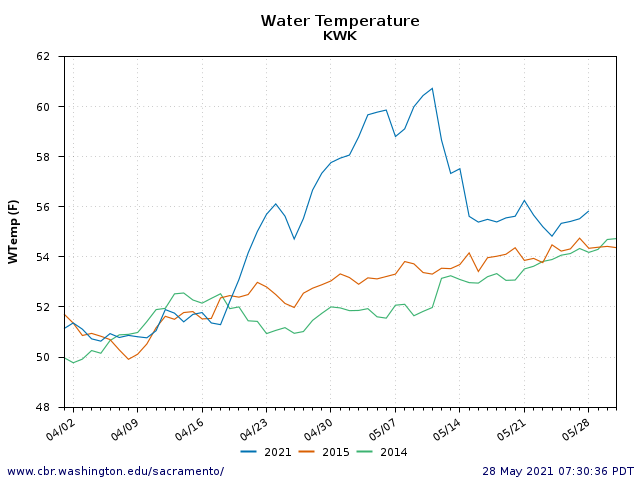
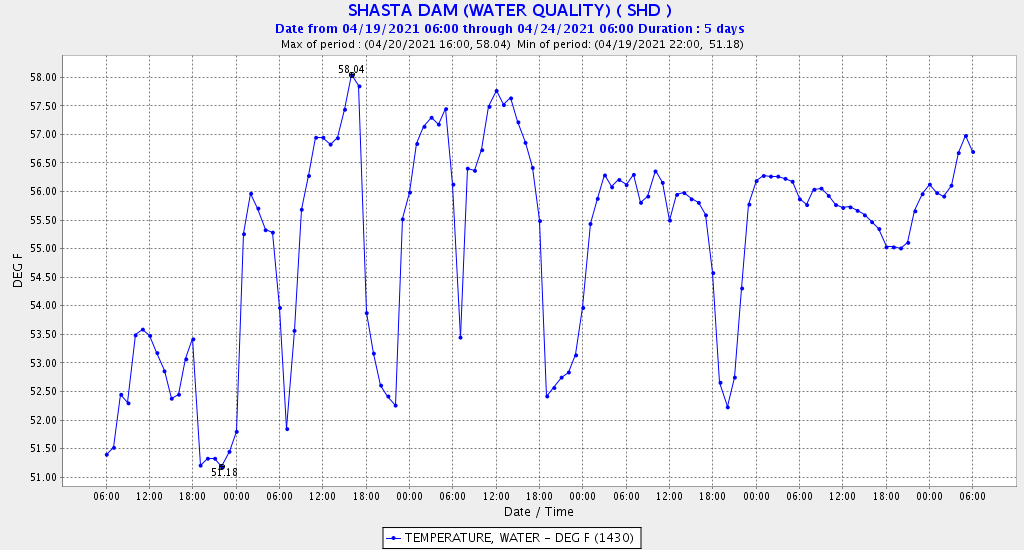
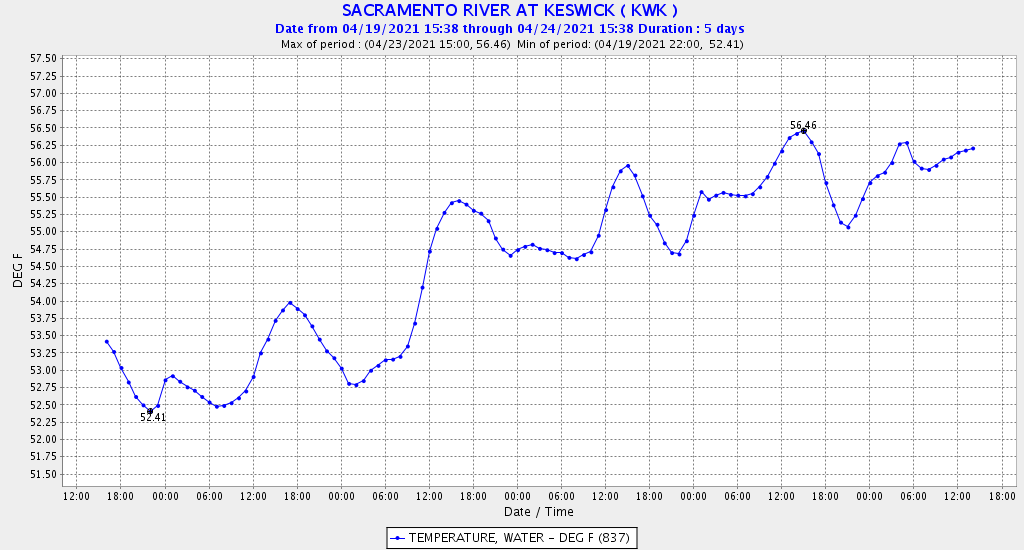
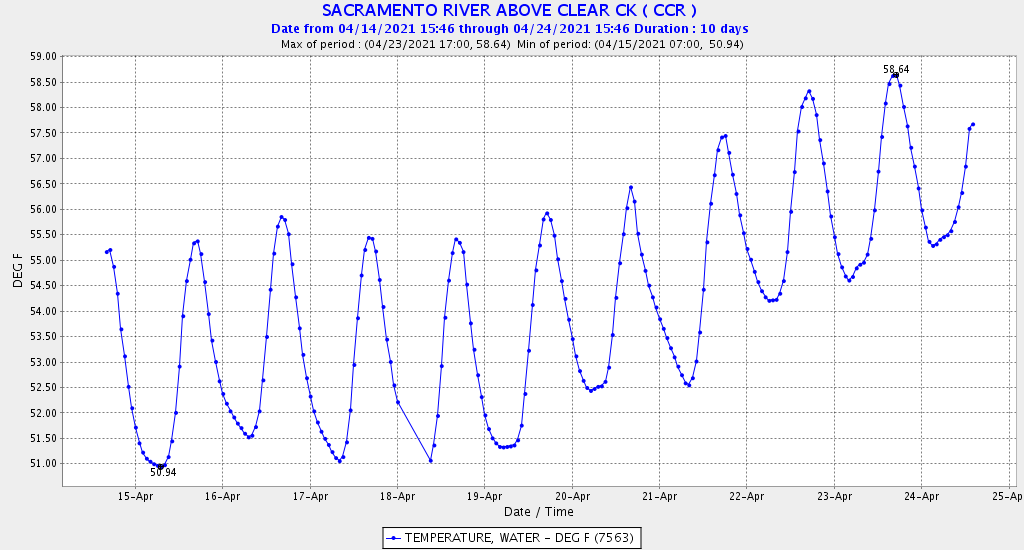
Figure 2. Keswick Reservoir water temperatures (ºF) in April-May 2014, 2015, and 2021.
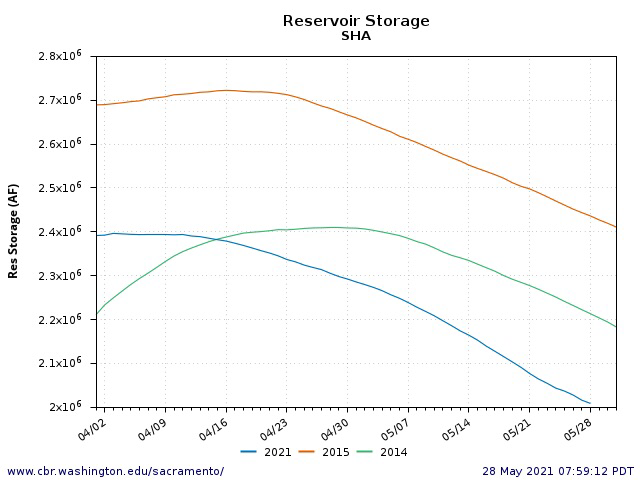
Figure 3. Shasta Reservoir storage (acre-feet) in April-May 2014, 2015, and 2021.
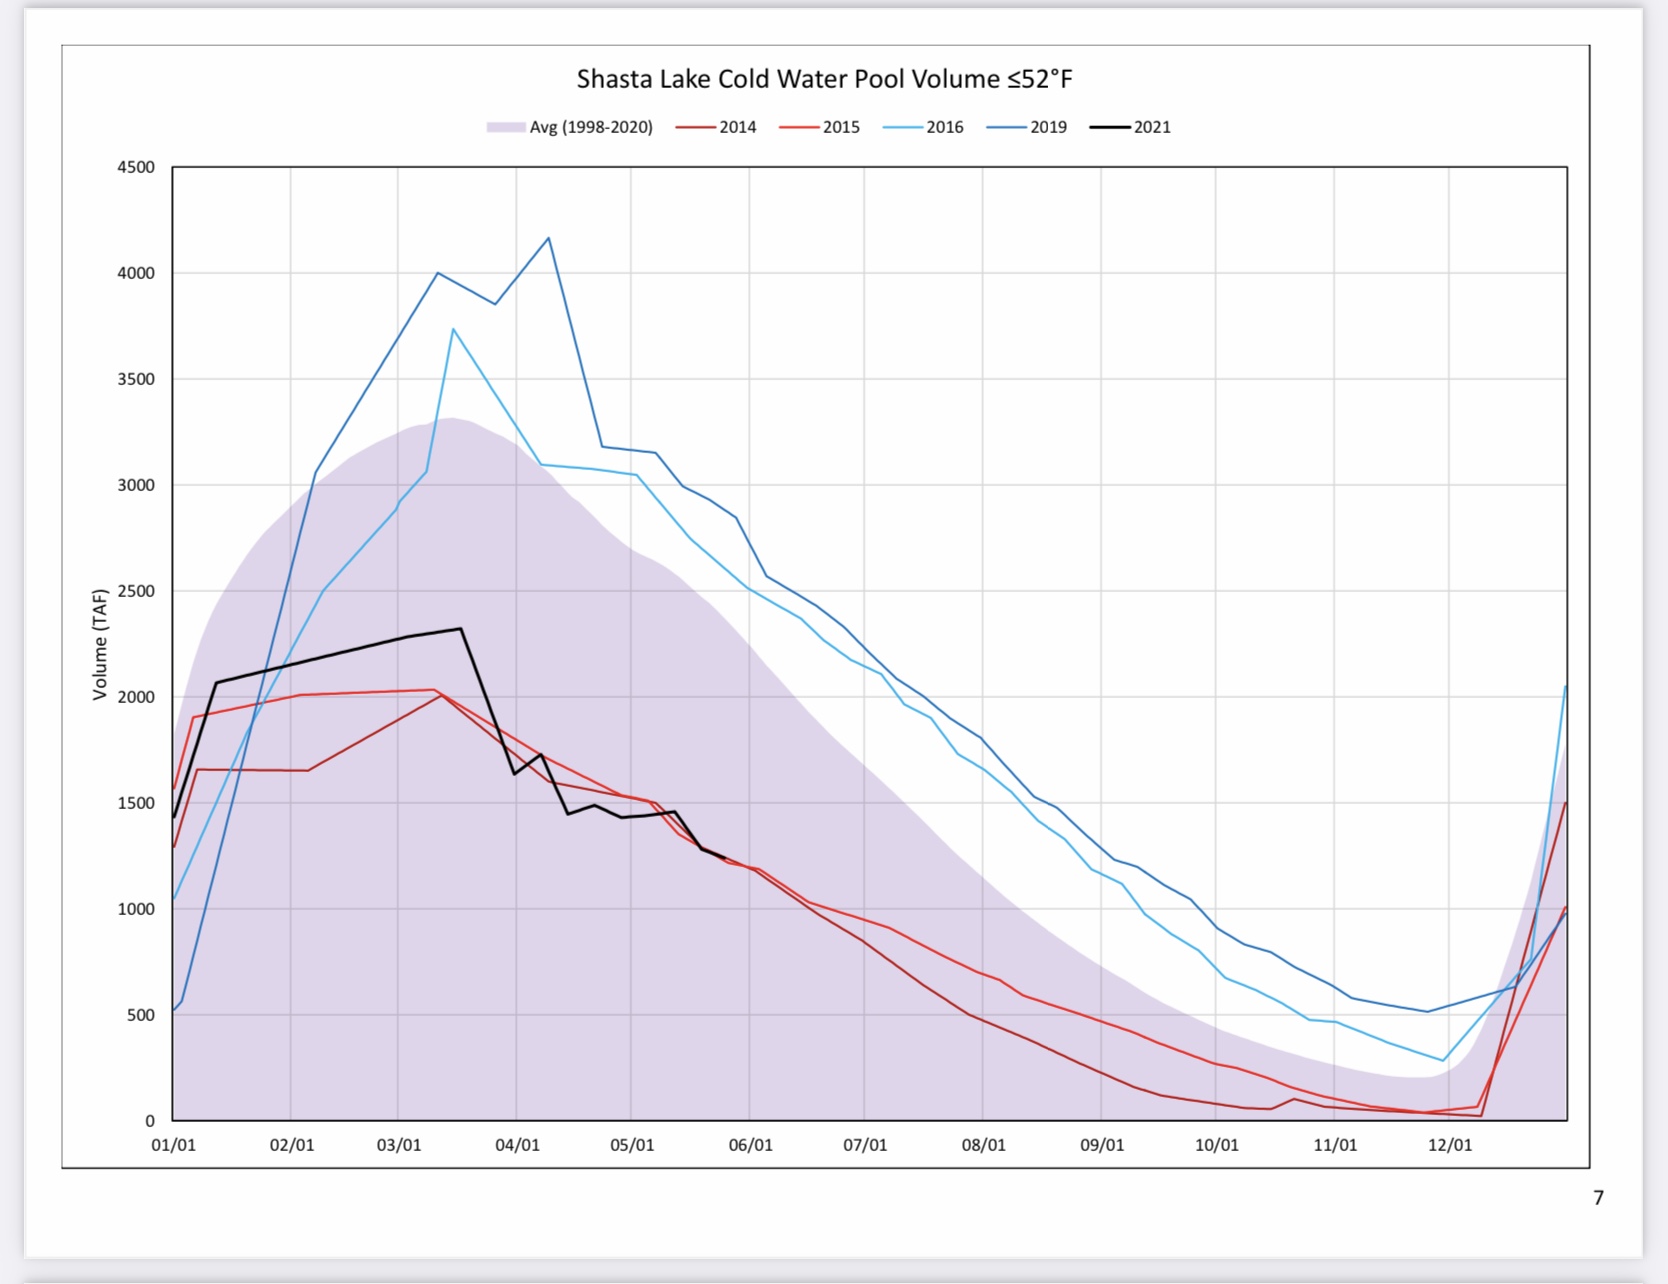
Figure 4. Shasta Reservoir cold-water-pool volume (1000s of acre-ft) in water years 2014 (red line), 2015 (purple line), and 2021 (black line). Also shown is average (shaded) and two wetter years. Source.

Figure 5. Shasta Reservoir pool configuration and release sources on May 18, 2021. Temperature Control Device (TCD) gate operation is also shown. Note the combination of turquoise from TCD gates and orange from river outlet water sources provided Shasta releases on May 18.
- Source. ↩
- For further discussion, see E. Dusek Jennings and Henrdix (2020), Spawn Timing of Winter-Run Chinook Salmon in the Upper Sacramento River. Available at: https://escholarship.org/uc/item/00c1r2mz ↩

 In early April 2021, the Bureau of Reclamation began a series of tests to determine if releases of water that bypass the powerhouses at Shasta Dam could help save Shasta’s cold-water pool through the summer and fall and thus help sustain salmon spawning in the Sacramento River below Shasta. This post describes the third experiment in the series.