A March 14, 2019 post in Maven’s Notebook summarized a presentation at the 2018 Bay Delta Science Conference on Delta smelt growth factors in the Bay-Delta estuary. The main author, Dr. Hobbs, described UC Davis research on smelt growth rates from analysis of smelt ear-bone cross sections.
The research indicates that growth rate is related to salinity, water temperature, and water clarity (turbidity). Growth rates were depressed when salinity was above 3-4 parts per thousand (ppt),when water temperature exceeded 20-21oC, and when water clarity was relatively high.
Dr Hobbs also addressed the question: HOW WILL FLOW AUGMENTATION AFFECT THE DELTA SMELT?
“The answer generally is that it will have an effect if the flows will actually reduce salinity, increase turbidity or reduce temperature.” They found that flow affects salinity, but temperature and turbidity not so much.
- “But from 2015-2017, we had an excessive period of time when it was above 22 degrees throughout the estuary.”
- “The average temperature from 1999 to present shows that 2014 and 2015 were exceptionally warm and the water has been getting clearer throughout the estuary since the early 2000s. How are we going to manage freshwater flows to affect these other two important variables?”
- “We’ve been thinking about how to manage freshwater flows for Delta smelt for the better part of 20 years, and what we need to be thinking about now is how do we manage temperature for Delta smelt? How do we manage temperature at all? Can we even manage temperature?”
My answer to the question about the effect of flow on Delta smelt is that flow is extremely important to salinity, water temperature, and turbidity, as thus Delta to smelt survival and population abundance.
- Dr. Hobbs implied that flow has little effect on water temperature, but he failed to mention that his two warmest years, 2014 and 2015, had the lowest spring-through-fall Delta inflows and outflows. Flow standards were relaxed in both years to save water in depleted reservoirs. He failed to mention that more flow keeps the low salinity nursery area of Delta smelt further west in Suisun Bay, where the air and water are cooler than the Delta.
- Dr. Hobbs also implied that flow has little effect on turbidity. But it is a fact that lower flows and higher exports in the 2000’s led to lower turbidities. More reservoir releases to feed south Delta exports lowers Delta turbidity. When the low salinity zone is west of the Delta, it benefits from the increased turbidity provided by higher winds and from more open shallow bays than are afforded by narrow deep Delta channels.
- Dr. Hobbs failed to mention that flow affects the transport of adults upstream to spawning areas and the movement of juveniles downstream to the low salinity zone nursery area.
Three additional points:
- Higher flows also benefit smelt food production and availability.
- Flow does affect the temperature of water entering the north Delta, in addition to affecting salinity and turbidity. In wet year 2017, summer inflows were low and consequently warm, negatively affecting smelt.1
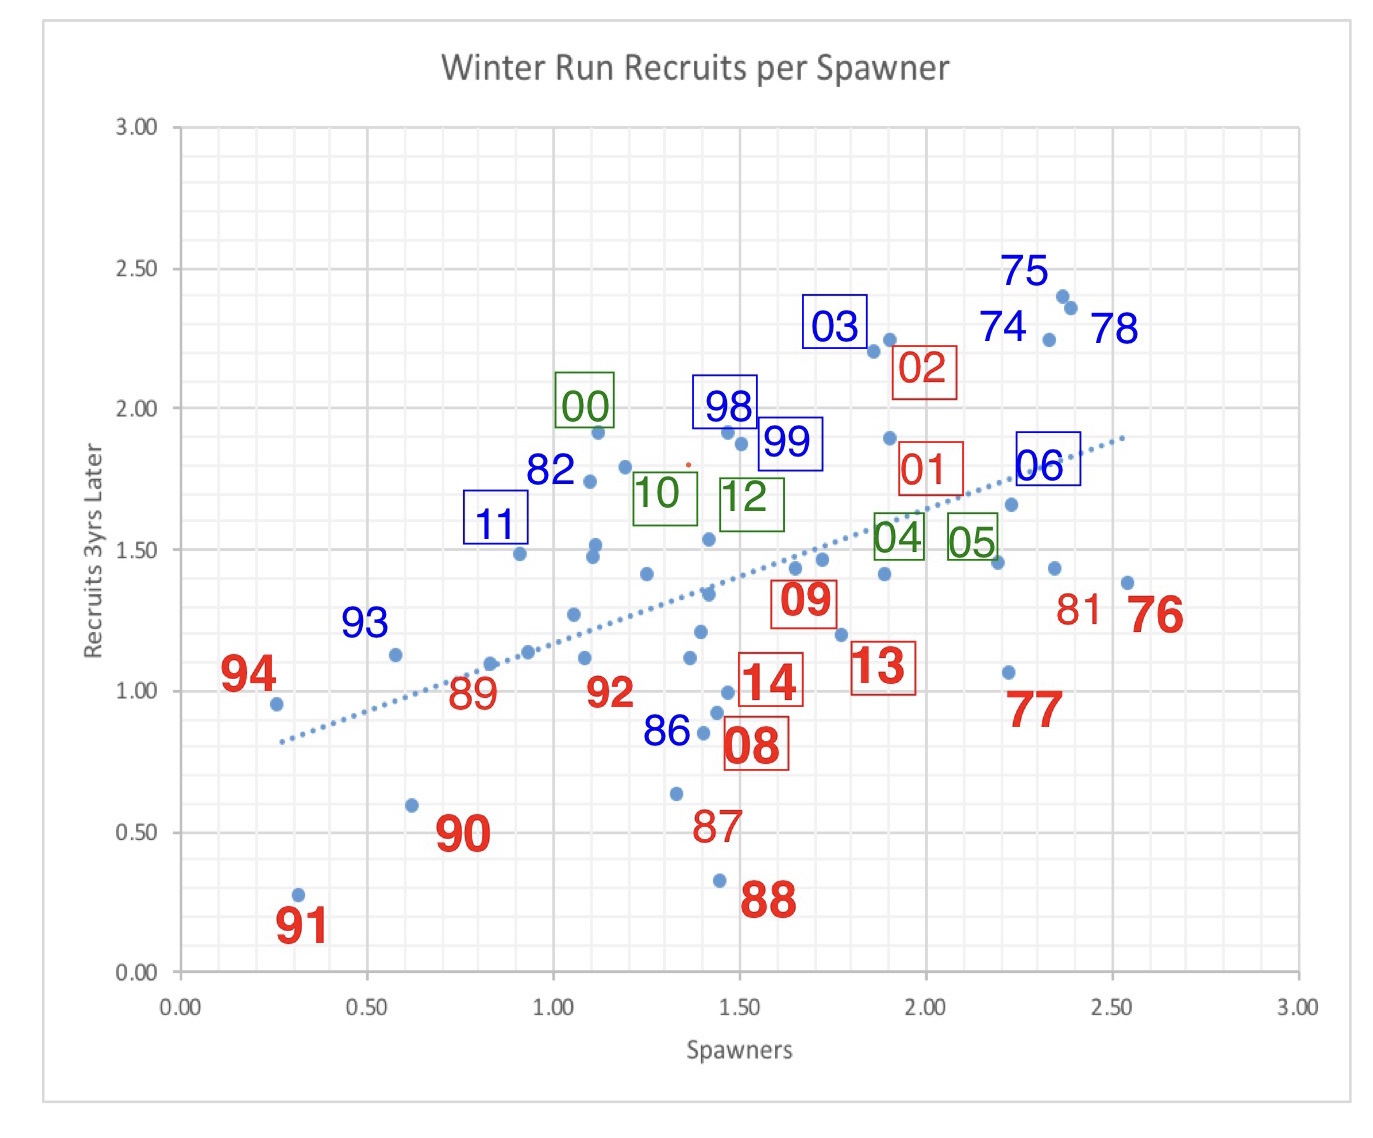
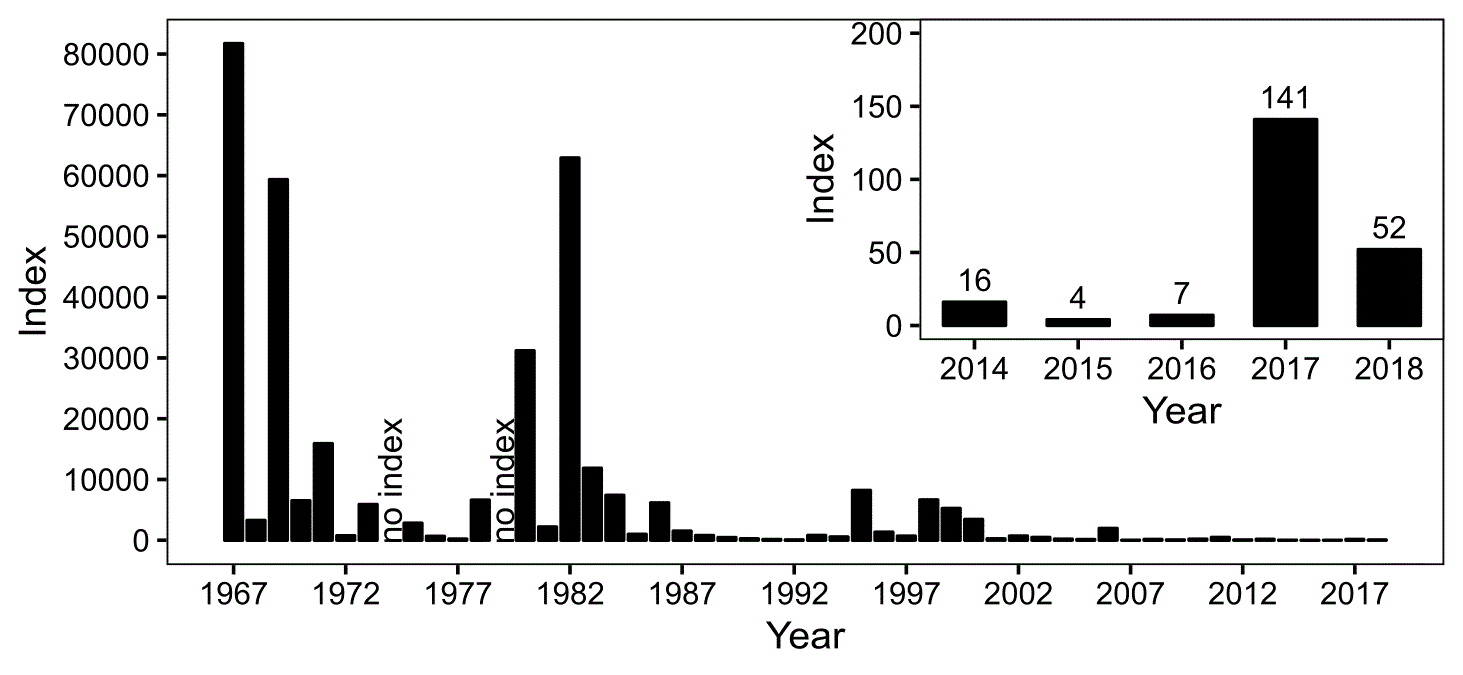
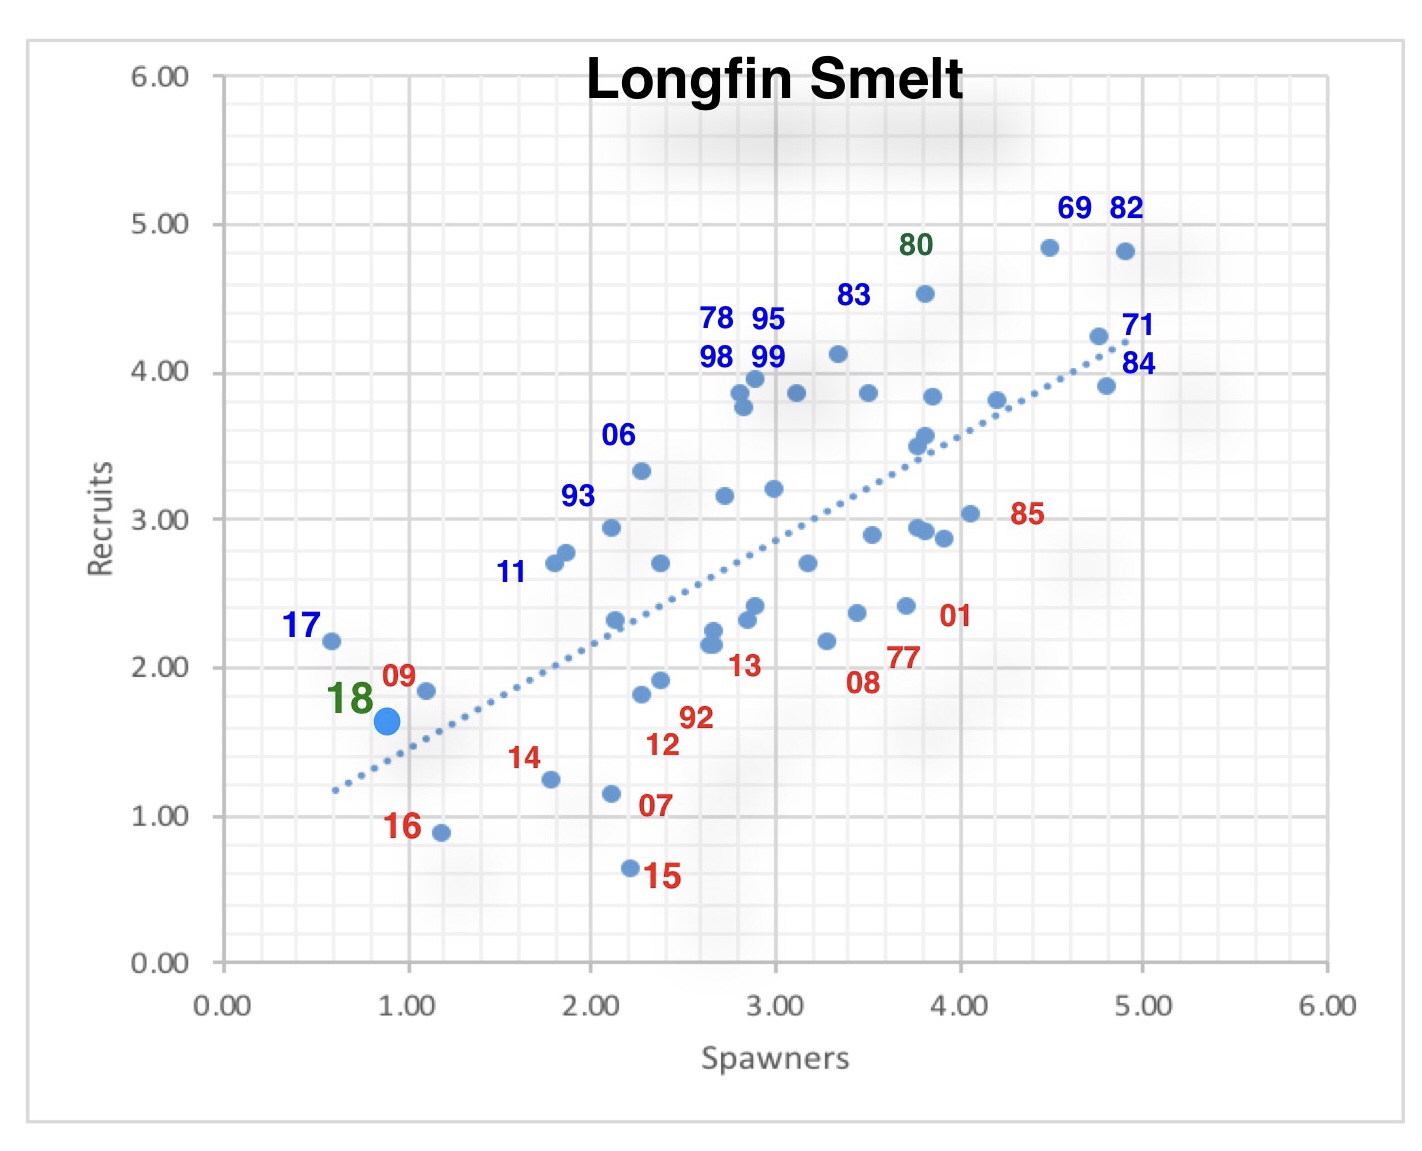
- Smelt production is strongly related to the number of adult spawners (or eggs laid), and 2017 also suffered from poor numbers of spawners.2