More on Delta Smelt Tidal Surfing

The last post about risk to Delta smelt was on January 9. Adult smelt migrate into the Delta from the Bay in winter to spawn. They take advantage of the flood tide to move upstream. However, with flood flows as high as 100,000 cfs entering the north Delta from the Sacramento River, the Yolo Bypass, and Georgiana Slough in mid- to late January 2017, there are no flood tides to ride into the north Delta spawning areas.

The only option for the adult smelt is thus to ride the incoming tide up the San Joaquin River into the central and south Delta (Figure 1). South Delta export pumping is currently at 14,000 cfs, near maximum capacity, using four rarely used auxiliary pumps. This pumping increases the pull of the incoming tide, reducing the effect of the inflow from the San Joaquin, Calaveras, Mokelumne, and Cosumnes rivers. While Delta inflow from these rivers is relatively high (Figures 2-5), it does not offset the influence of the incoming tide as does the inflow from the Sacramento.

Net tidal flows in lower Old and Middle Rivers (OMR flows) remain at the allowed limit of -5000 cfs, consistent with the smelt Biological Opinion. Several adult Delta smelt were salvaged at the export facilities in mid-January. 1 This scenario is considered a “high risk” to Delta smelt by the Smelt Working Group, because of the continuing risk that the pumps will draw or attract adult smelt into the central Delta and subsequently into the south Delta.

Under lower San Joaquin River flows, the maximum allowed export pumping is 11,400 cfs. High San Joaquin River inflow allows exports of 14,000 cfs that do not generate OMR flows more negative than -5000 cfs. The theoretical benefit of high San Joaquin River flows is that it should keep flow into the central and south Delta moving westward. But a large portion of that inflow is diverted south into the Head of Old River toward the pumping plants (Figure 6).

Figure 1. Approximate flood tide flow in cubic feet per second in mid to late January 2016. Blue arrows represent high Sacramento River, San Joaquin River and Mokelumne River flows (during flood tides). Red arrows depict negative flows of incoming tides. Note the south Delta incoming tide of -20,000 cfs would be less if not for the 14,000 cfs export rate at the south Delta pumping plants.

Figure 1. Approximate flood tide flow in cubic feet per second in mid to late January 2017. Blue arrows represent high Sacramento River, San Joaquin River and Mokelumne River flows (during flood tides). Red arrows depict negative flows of incoming tides. Note the south Delta incoming tide of -20,000 cfs would be less if not for the 14,000 cfs export rate at the south Delta pumping plants.

Figure 2. San Joaquin River flow at Mossdale at the head of the Delta upstream of Stockton and the Head of Old River. Note that on Jan 6 when flow reached about 6,000 cfs, the tidal signal dissipated when flow overcame the tidal forces.

Figure 2. San Joaquin River flow at Mossdale at the head of the Delta upstream of Stockton and the Head of Old River. Note that on Jan 6 when flow reached about 6,000 cfs, the tidal signal dissipated when flow overcame the tidal forces.

Figure 3: Flow from the Calaveras River, upstream of the Delta. The Calaveras enters the Delta at Stockton.

Figure 3: Flow from the Calaveras River, upstream of the Delta. The Calaveras enters the Delta at Stockton.

Figure 4. Release from Camanche Dam to the Mokelumne River. CDEC does not show flow values for the Mokelumne at gages further downstream. The Mokelumne enters the Delta near Jersey Point.

Figure 4. Release from Camanche Dam to the Mokelumne River. CDEC does not show flow values for the Mokelumne at gages further downstream. The Mokelumne enters the Delta near Jersey Point.

Figure 5. Cosumnes River flow well upstream of the Delta. Much of the high flow peaks enters the river’s connected floodplain, roughly between Lodi and Elk Grove, and does not flow immediately to the Delta. Flows in the Cosumnes enter the Mokelumne before passing into the Delta

Figure 5. Cosumnes River flow well upstream of the Delta. Much of the high flow peaks enters the river’s connected floodplain, roughly between Lodi and Elk Grove, and does not flow immediately to the Delta. Flows in the Cosumnes enter the Mokelumne before passing into the Delta

 Figure 6. Flow entering the entrance to Old River from the San Joaquin River near Stockton.


Figure 6. Flow entering the entrance to Old River from the San Joaquin River near Stockton.

  1. https://www.usbr.gov/mp/cvo/vungvari/dsmeltsplitdly.pdf Note: website has changed to this new site.

More on Splittail Status

Recently, I summarized survey information from the Bay-Delta on Sacramento splittail that depicted a potentially grim picture of the future of this special status species.  In that post, I did not include trawl survey info from Suisun Marsh Fish Study collected annually by UC Davis (Figure 1), which indicates a core population of adult splittail still present in Suisun Marsh.  Other core populations exist in San Pablo Bay (Petaluma and Napa Rivers).  Peter Moyle and Teejay O’Rear (UC Davis, personal communications) believe the Marsh core population is sufficiently strong and resistant to extinction.

Looking at Figure 1, the Suisun Marsh population survived the 1987-1992 drought, building in numbers with strong recruitment (ages 0 and 1) in the wet years of 1995-2000.  Recruitment declined during the 2007-2009 drought, but there was strong recruitment in the wetter 2010 and 2011 water years.  Recruitment declined in the 2012-2014 drought years, but remains substantially higher than at the end of the 1987-1992 drought.  Teejay O’Rear states the population has remained strong through 2015 and 2016, with some recruitment in the wetter 2016, and likely strong recruitment in the spring of 2017, presuming it stays wet.

Figure 1. Catch-per-unit-effort of Sacramento splittail in Suisun Marsh 1980-2014 by age group. (Source: Teejay O’Rear, UC Davis)

Figure 1. Catch-per-unit-effort of Sacramento splittail in Suisun Marsh 1980-2014 by age group. (Source: Teejay O’Rear, UC Davis)

Restoring Side Channels in the Upper Sacramento River

In a prior blog entry on this site, the importance of restoring juvenile salmon rearing habitats in the upper main stem Sacramento River downstream of Keswick Dam was described:   http://calsport.org/fisheriesblog/?s=rearing+habitat.  The main river channel is actually a harsh environment for young salmon upon emergence from the river gravels after hatching.  The weak-swimming fry are immediately exposed to very high water velocities and most of the riverbed lacks structure to provide those fish with velocity and predator refugia.  One hypothesis, albeit very difficult to prove, is that insufficient rearing habitats in the upper river may be a significant limiting factor for the salmon runs, particularly for the endangered winter-run Chinook.

Although the notion of increasing the quantity and quality of rearing habitats in the main stem Sacramento River has been discussed for decades, meaningful on-the-ground restoration actions have been lacking.  That circumstance is changing.  A management action now being pursued is the restoration of side channels that have lost ecological functions for salmon rearing, primarily because of diminished or total lack of hydraulic connectivity with the main river channel.   Many of the historical side channels have become plugged, stagnant, and choked with overgrown vegetation; excellent frog habitat, but not for salmon.

A major endeavor to reopen some side channels, probably the most complex in modern times, was recently completed on the upper Sacramento River in Redding, California (Figure 1).  Termed the North Cypress Street Project, multiple agencies and stakeholders successfully planned, initiated, and completed this action in 2016.  Finishing touches on the project were completed just prior to the new year.  Funding was provided by the Central Valley Project Improvement Act Anadromous Fish Restoration Program.  According to the Western Shasta Resource Conservation District which provided oversight for the entire effort, restoration of these side channels will provide rearing habitats for winter-run and fall/late-fall-run Chinook (Figure 2) through the provision of optimal flows, refuge from predators, and increased food sources.  The habitats will be particularly important for winter-run Chinook because nearly the entire population now spawns upstream of the site.

Figure 1.  Location of the North Cypress Street side-channel project to restore juvenile salmon rearing habitats.  The Painter’s Riffle project is located just upstream of Cypress Street which was previously described in this blog:  http://calsport.org/fisheriesblog/?s=painter.

Figure 1. Location of the North Cypress Street side-channel project to restore juvenile salmon rearing habitats. The Painter’s Riffle project is located just upstream of Cypress Street which was previously described in this blog: http://calsport.org/fisheriesblog/?s=painter.

Figure 2.  Rearing juvenile Chinook.  California Department of Fish and Wildlife photograph.

Figure 2. Rearing juvenile Chinook. California Department of Fish and Wildlife photograph.

The completed restoration provides up to 1.48 acres of new side-channel rearing habitats at the minimum Keswick Dam release of 3,250 cfs (Figure 3).  The restoration included installation of numerous large woody debris structures to increase the habitat complexity for young Chinook.  Video footage of the project by John Hannon is provided at:  Side Channel Projects

More such actions are planned for implementation on the upper Sacramento River in 2017 and years beyond.

Figure 3.  Post-construction schematic of the North Cypress side-channel project.  Restored side channels are depicted by blue lines (courtesy of the Western Shasta Resource Conservation District).  Sacramento River flow is from the upper right to the lower left in the photograph.

Figure 3. Post-construction schematic of the North Cypress side-channel project. Restored side channels are depicted by blue lines (courtesy of the Western Shasta Resource Conservation District). Sacramento River flow is from the upper right to the lower left in the photograph.

More on Delta Science

More Delta Science
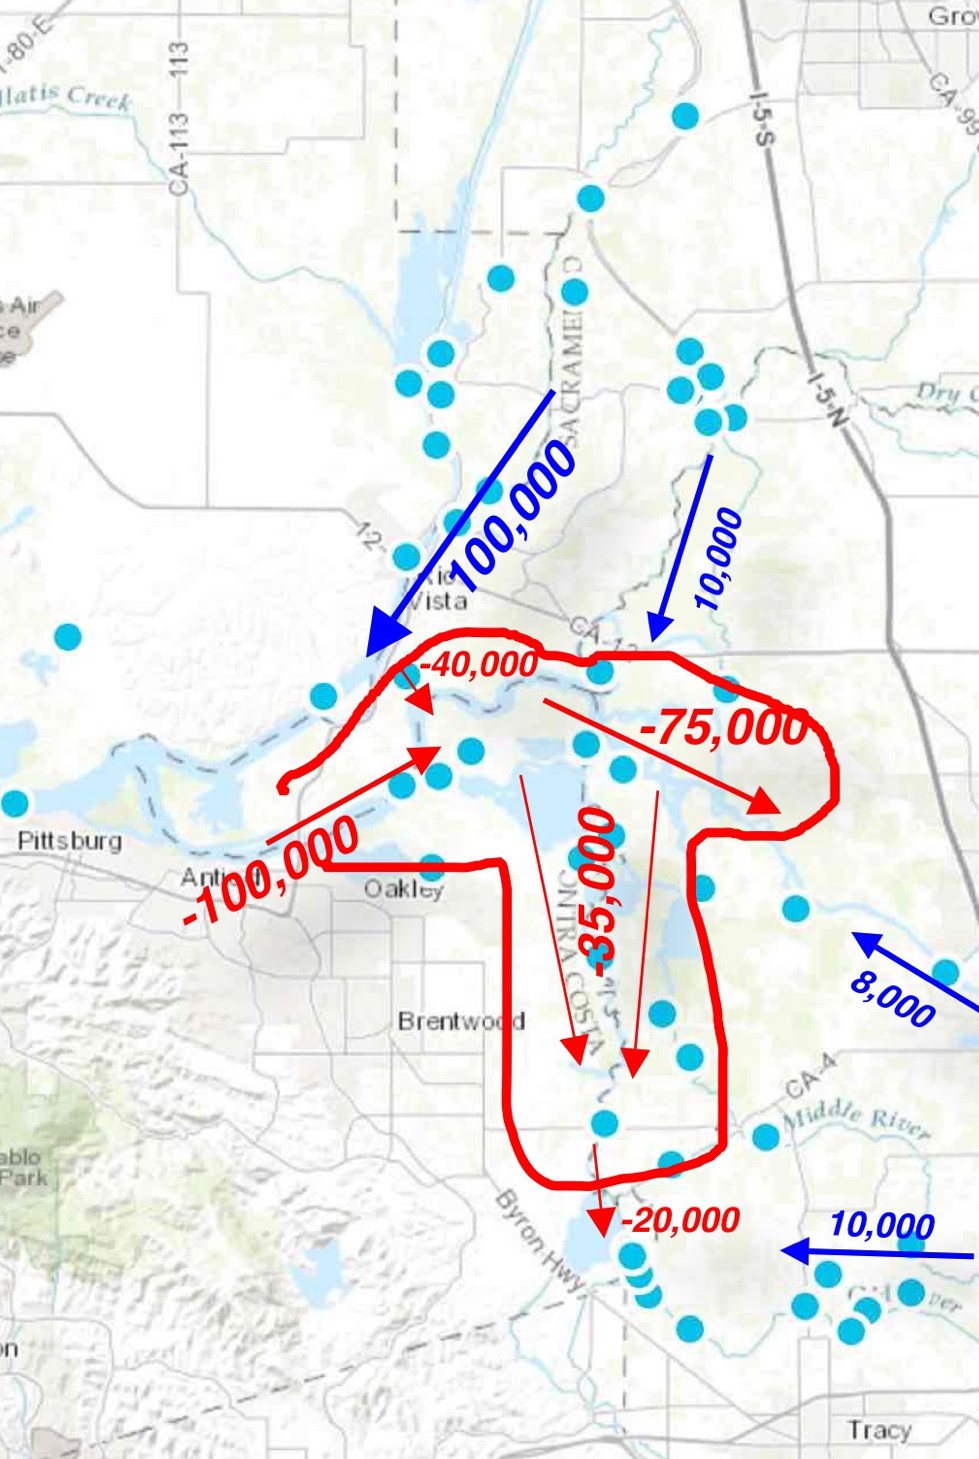
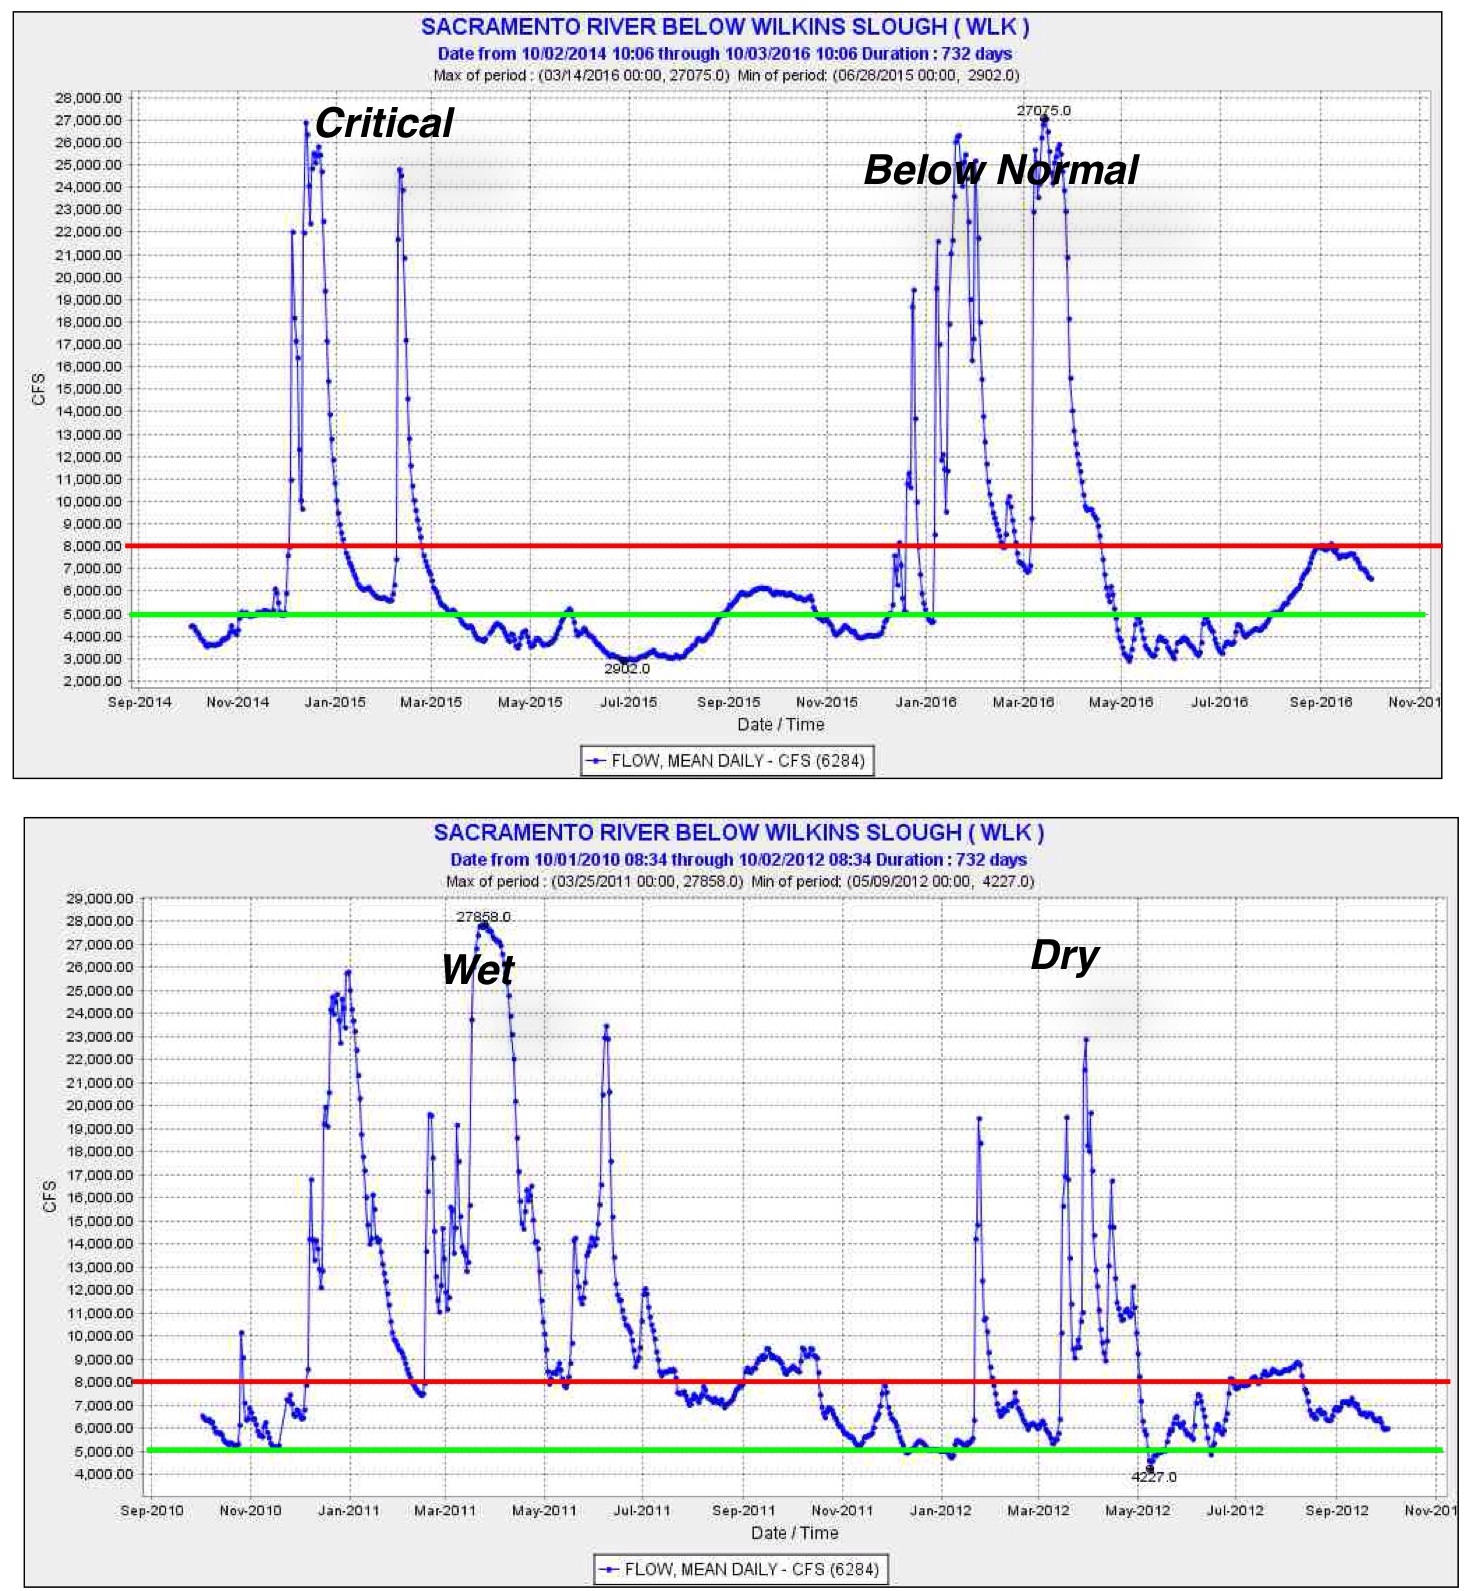
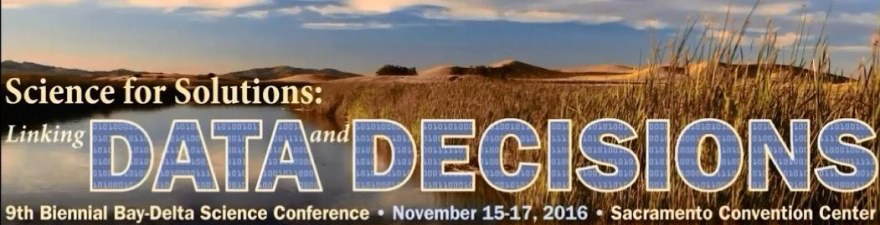
I have written often on Delta science and what has been or could be learned from science to support water management.  Yet another biennial Delta science conference, the 9th, was held this past November.  This year’s conference theme was: “Science for Solutions:  Linking Data and Decisions.”  Another year has passed, and more has been studied and learned.  More dots have joined the dozens of previous dots in data charts from annual surveys of Delta organisms and habitat conditions.  More dots lament the loss of water and habitat.  The huge Delta Science Program has progressed yet another year.

Opening Talk

In Phil Isenberg’s opening talk, “A Guide for the Perplexed”, the former legislator and former chair of the Delta Stewardship Council suggested that scientists learn to smile more.  He asked: “Why should science be involved in policy anyway?”  He talked about how policy makers view science.  (Obviously, many are perplexed.)  He forgot that the universe and Mother Nature are vastly mysterious things, which are often more complicated than human understanding, but sensitive to human actions at the same time.  Yes, science is perplexing.

Mr. Isenberg talked about “independent science” and “combat science,” as though they were two different things.  To borrow a legal term, science is not self-executing.  Then he asked: “How do we know when we are using the best-available science”?  His answer: “When it is good enough to avoid doing something stupid.”  Clearly, we have yet to reach that point.  The problem has been in choosing to do the best thing, not that good choices or unknown or not “available.”  He then quoted Churchill:  “America will always do the right thing after trying everything else first”At least we have gotten past the point where we thought the world is flat.  It is all very perplexing.

Mr. Isenberg concluded by suggesting: “It’s the notion that scientists live looking farther out than the rest of us do with the gift of foresight that if properly utilized, can inform, educate, and ultimately motivate policy makers.”   He forgets that ultimately policy makers must trust scientists to get the job done.  Example: the Trinity Project and the atomic bomb in the 1940’s.  As long as water managers and policy makers lead the science, the Delta’s problems will not be solved.

The Delta Science Program

Clifford Dahm, former lead scientist for the Delta Stewardship Council, spoke on his Delta Science Program, which was forced upon us in the 2009 Delta Reform Act to ensure water and environmental policy are guided by the “highest caliber” science.  He spoke on the program’s Independent Science Board, outsiders who meet once a year to review “our science”.  He spoke on their Adaptive Management Program, which ensures that we evaluate everything and learn nothing.  He spoke on the program’s efforts to coordinate science and inform decision makers, and to develop and implement the Delta Science Plan and promote the Science Action Agenda.  He talked about their modeling efforts: “There’s just a lot of ways that modeling could be moved forward, and I hope that in the next two years, we can actually come back to you and say that some of our modeling efforts have shown greater fruition as time goes on.  We were talking about the idea of potentially a modeling center or a co-laboratory to get modelers together.”  Those would be the two years after which we will have new water quality standards, new biological opinions, and new tunnel-boring machines in the Delta, as well as several newly extinct native fish species.  They would also be the two years after 20 years of effort starting with the CalFed Bay-Delta Program.

A Great Question

U.C. Davis fisheries biologist Peter Moyle then addressed the question:  “How has your research program and the data it has produced over the last 35 years been used to develop solutions for conserving aquatic resources in Delta?”  He quoted the 1998 Strategic Plan:

This strategic plan, if followed, should lead to an orderly and successful program of adaptive ecosystem restoration….  The Strategic Plan Core Team has high expectations for the Ecosystem Restoration Program.  There is no turning back and the team anticipates that in 20-30 years many habitats will be restored, endangered species will become abundant enough to be delisted, and conflicts will be lessened , even in the face of population growth and increasing demands on resources.

In addressing the posed question, he then remarked:

In retrospect, now that almost 20 years has past since that was written, the statement almost seems tongue in cheek because clearly that has not happened.  I continue to help write reports that recommend how to improve the Delta ecosystem and frankly I don’t see much progress being made, as the delta smelt trends so eloquently attests…  the reality is that the Delta has continued to deteriorate as a habitat for native fishes, despite my research and despite many proposals for solutions.

His experience, like that of so many other long-time Delta scientists, is that few if any of the specific recommendations in the Strategic Plan have been implemented or completed.  Science has done its job, and scientists have long awaited action.  Policy makers and managers have failed us, not the science.

The use of science in complex public policy decision making

Chair of the State Water Board Felicia Marcus spoke on the use of science in decision making.  She suggested to scientists:  “Dare to recommend, but don’t decree …  Retain your scientific integrity but dare to make recommendations.  At the same time, own your power and be responsible with it and have empathy for the decision makers who have to balance, even as you would have them respect you.”  This is a very tough sell for scientists who have not been listened to for decades.  What will she and her Board do with two more rounds of recommendations on the Delta tunnels and the Bay-Delta Plan?  Will her Board be as transparent and methodical in their balancing as the scientists are in making their recommendations?

Chair Marcus further stated:

We’re entering the era of adaptive management that requires all of the above as well as integrating social sciences into our work … To make adaptive management work, we all have to learn how to be better ‘egosystem’ managers in order to be better ecosystem managers in the real world over time, versus lurching from sound bite to sound bite or wringing our hands that other players just don’t get it.

Sorry, but that’s not the problem.  It gives the policy makers and the managers too much credit and scientists too little.  Very few scientists think that managerial ignorance or lack of cognition is the biggest problem.  Rather, it’s that scientists have endured decades of adaptive management in which their lessons and caveats have on the whole been subsumed to the social sciences of politics and economics.  There are plenty of scientists throughout the resource agencies and non-profit groups who are extremely articulate and who have great senses of humor and social skills.   That hasn’t changed the outcomes: fish and other parts of the Bay-Delta aquatic ecosystem are in crisis, and the agricultural economy and other values against which the ecosystem is “balanced” are thriving..  And that balance sheet is really nothing to smile about.

Fundamental Needs of Central Valley Fishes – Part 1c: Spring River Flows

In the coming months and years, regulatory processes involving water rights, water quality, and endangered species will determine the future of Central Valley fishes.

To protect and enhance these fish populations, these processes will need to address four fundamental needs:

  1. River Flows
  2. River Water Temperatures
  3. Delta Outflow, Salinity, and Water Temperature
  4. Valley Flood Bypasses

In this post, I summarize a portion of the issues relating to River Flows:  spring flows.  Previous posts covered fall and winter flows.

River Flows – Spring

River flows in spring drive many natural ecological processes in the Central Valley related to Sierra snowmelt.  Winter-run and spring-run salmon, steelhead, Pacific lamprey, and white and green sturgeon ascend the rivers from the ocean during the spring snowmelt season.  Spring-run salmon arre able to migrate upstream in the high water to hold until late summer spawning.  Winter-run salmon and sturgeon spawn in the Sacramento River below Shasta that same spring.  Pacific lamprey spawn in streams throughout the Valley in spring.  Juveniles, and remnant yearlings of all these species spawned in the previous year, head to the ocean in the high flows.  In the Valley, the spring snowmelt and rains swell the rivers for the annual runs of Delta smelt, splittail, American shad, Sacramento suckers, and striped bass.   In the Bay-Delta, spring flows spur annual productivity that sustains juvenile longfin smelt, Delta smelt, fall-run salmon, green and white sturgeon, striped bass, American shad, and splittail, as well as many resident and estuarine fishes and their food supply.

Much of the Valley’s snowmelt is captured in mountain and Valley rim reservoirs, breaking the link between the ocean and mountains.  In the lower Sacramento River below Shasta Reservoir, spring snowmelt flows are markedly reduced by retention of snowmelt in the reservoir (Figure 1).  The Feather River, the main Sacramento River tributary, are similarly affected (Figure 2).  In the San Joaquin River watershed, absence of flows sourced in spring snowmelt is also severe (Figure 3).  The capture of snowmelt not only reduces flow in Valley rivers and the Bay-Delta, but also reduces sediment load, river scour, water depths and velocities.  It raises water temperatures and limits the extent of natural floodplain inundation.  All of these are important ecological processes on which native fishes depend.

Figure 1. Pre-and post-Shasta flows in the lower Sacramento River near Red Bluff (Bend Bridge gage). Note that nearly all the peak spring snowmelt flows have been removed below Shasta in all year types. (USGS gage data)

Figure 1. Pre-and post-Shasta flows in the lower Sacramento River near Red Bluff (Bend Bridge gage). Note that nearly all the peak spring snowmelt flows have been removed below Shasta in all year types. (USGS gage data)

Figure 2. Pre- and post-Oroville Reservoir flows in the lower Feather River. (CDWR data)

Figure 2. Pre- and post-Oroville Reservoir flows in the lower Feather River. (CDWR data)

Figure 3. Spring snowmelt (natural flow – blue line) is retained in New Melones Reservoir except for prescribed irrigation releases and salmon migration flows (orange line – reservoir releases to lower Stanislaus River). (CDEC data)

Figure 3. Spring snowmelt (natural flow – blue line) is retained in New Melones Reservoir except for prescribed irrigation releases and salmon migration flows (orange line – reservoir releases to lower Stanislaus River). (CDEC data)

Under current operations, spring snowmelt into the Valley reservoirs is generally held in storage except for minimum downstream flow requirements, agricultural demands, Delta inflow and outflow to meet water quality standards, and minimum flow specifications for endangered fish in biological opinions.  Flow releases for agriculture and fish are generally re-diverted soon after release, thus resulting in further reduction of downstream flows (this is the case for  the lower Sacramento River in Figure 1, the lower Feather River in Figure 2, and lower Stanislaus River in Figure 3).  Critical conditions often appear below these diversions in the lower Sacramento River (Figure 4), in the lower San Joaquin River, and in outflow from the Delta to the Bay.

What is needed are spring releases (spills) from the major Valley reservoirs to the major rivers below dams that carry at least in part to the Bay, to stimulate and sustain migrations of the adult and juvenile anadromous fish throughout the Valley.  Water releases timed to the natural flow pulses would stimulate migration, providing even more flow and stimulus for young anadromous fish from all the Valley rivers to pass successfully through the Delta and Bay to the ocean.

Figure 4. River flow (cfs) in lower Sacramento River below major irrigation diversions in four recent years representing four water-year types. Green line represents minimum flow needed to maintain a semblance of essential ecological processes in the lower river. Red line represents preferred minimum level protecting ecological processes. May-June flow is generally depressed except in wet years.

Figure 4. River flow (cfs) in lower Sacramento River below major irrigation diversions in four recent years representing four water-year types. Green line represents minimum flow needed to maintain a semblance of essential ecological processes in the lower river. Red line represents preferred minimum level protecting ecological processes. May-June flow is generally depressed except in wet years.