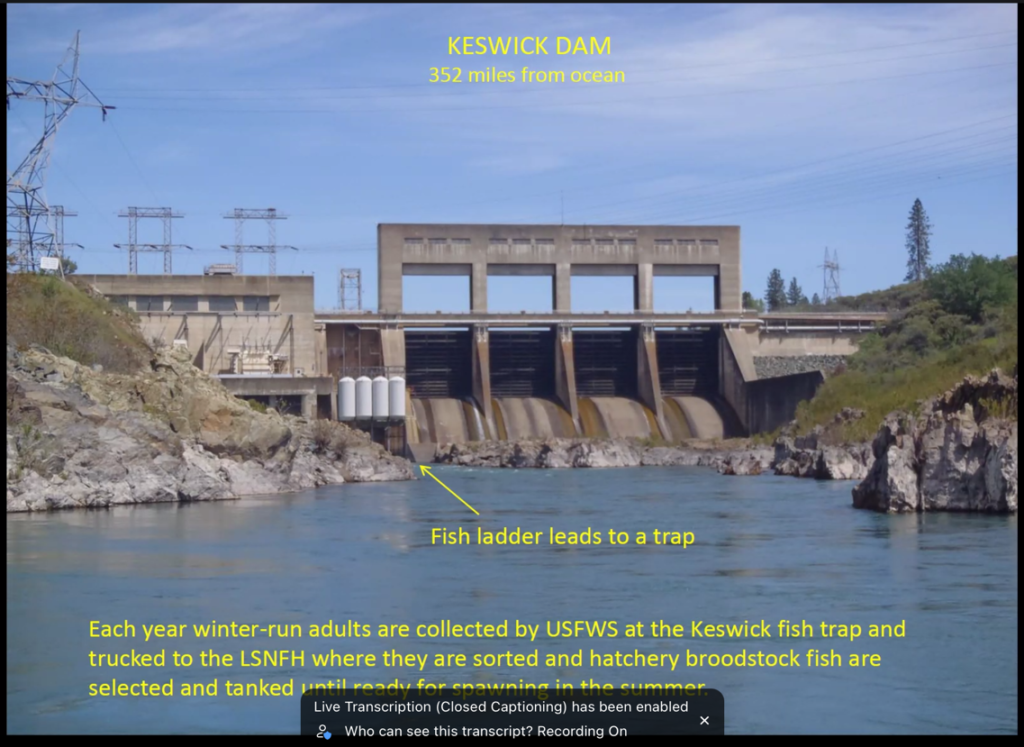
Photo 1. Keswick Dam – the upper extent of salmon in the Sacramento River. Source: USFWS
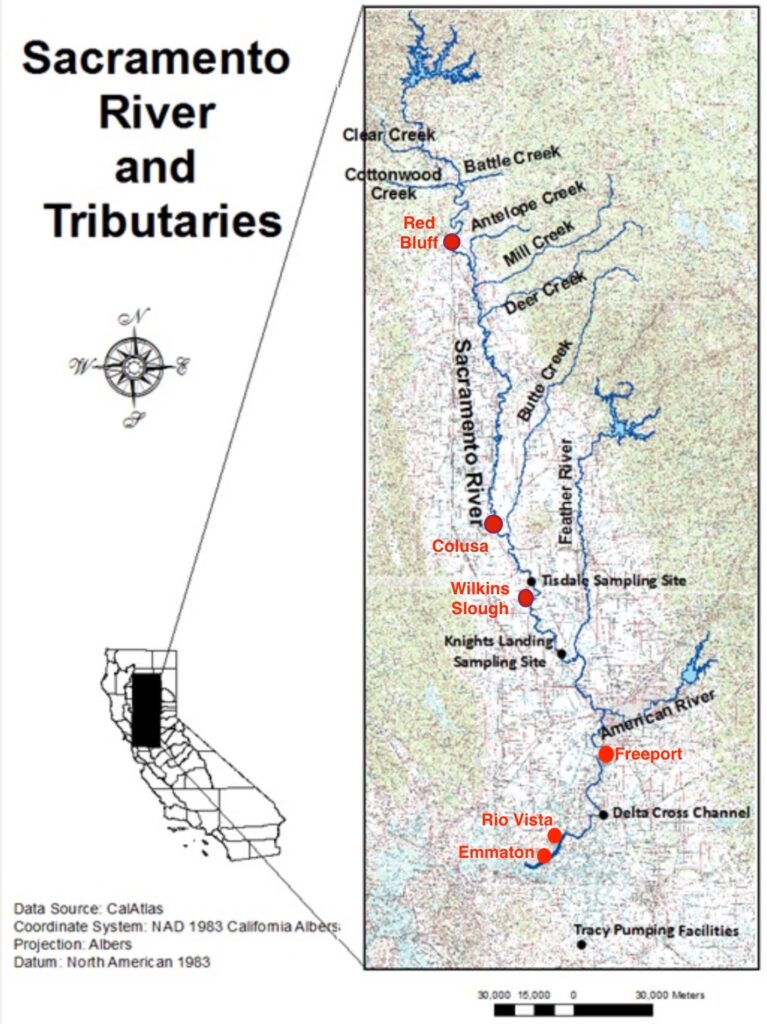
Winter-run Chinook salmon were once found throughout the Upper Sacramento River watershed, including the Sacramento, McCloud, and Pit River drainages, as well as in Battle Creek (Figure 1). Following the construction of the Central Valley Project’s Shasta and Keswick dams in the 1940s, winter-run were confined to the lower Sacramento River below Keswick Dam.
Winter-run are one of four Chinook salmon subspecies found in the Central Valley. As “winter-run,” the historical population took advantage of the Mediterranean climate’s wet winter and spring to migrate to and from the ocean to optimal spawning habitats in the Mount Shasta and Mount Lassen volcanic Cascade watersheds.
Adults returned from the ocean in winter and spring, reaching elevations near 3,000 feet on the west and south flanks of Mount Shasta in the upper Sacramento River, McCloud River, and Pit River. Cold, clear spring waters sustained them until they spawned in late spring and summer. Fry emerged from the gravel redds in early fall. High winter-spring flows transported fry to the Lower Sacramento River, Valley floodplains and the Bay-Delta estuary that provided optimal winter rearing conditions (e.g., water temperatures from 10-15oC), with abundant food and cover in marshes, creeks, and sloughs. The fry grew to ocean-ready smolt size by late winter and early spring and headed to the ocean.
The system was ideal, producing hundreds of thousands if not millions of adult winter-run salmon which many native peoples depended on for centuries.
But that all changed in the mid-20th Century when winter-run salmon populations were decimated by dams that blocked adult salmon access to their historical spawning grounds. Winter-run salmon persisted in the Sacramento Valley below Shasta and Keswick dams in tailwater habitat sustained by cold-water releases from the depths of Shasta Lake, a modicum of spawning and rearing habitat, and – since 1998 – by one conservation hatchery. Much of the remaining spawning, rearing, and migration habitats were lost to mining, water diversions, roads, logging, and urbanization.
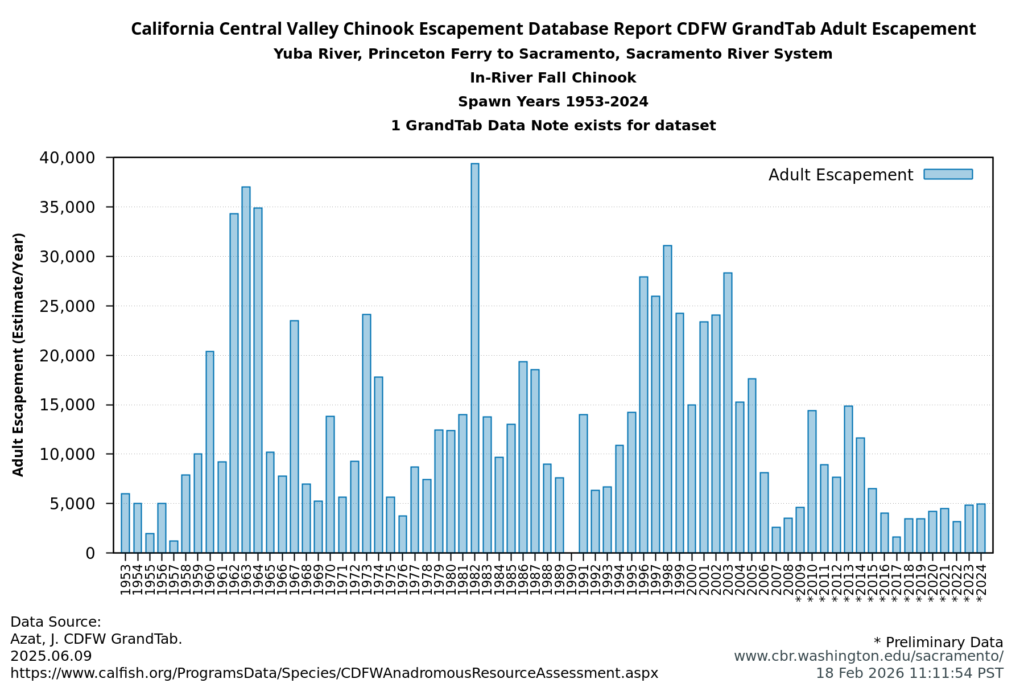
Winter-run salmon were nearly gone from the Sacramento River after the 1976-77 drought. Cold-water habitat was not sustained below Shasta Dam in the drought, and escapement plummeted (Figure 2). The escapement (returns) in 1979 and 1980 from brood years 1976 and 1977 was very low. Brood year 1978, the offspring of brood year 1975 (which had been in the ocean during the drought) did well in wet year 1978 and returned well in 1981. However, because of dry conditions in 1981, survival of brood year 1981 was poor. The failures of brood years 1976, 1977, and 1981 (and their offspring) led to a general population collapse.
The subsequent 1987-92 drought led to the near extinction of the run and its listing as endangered under the federal and state endangered species acts. Protections mandated in the listings, a decade of wetter years (1993-2003), some major improvement in CVP infrastructure and operation, and initial operation of the Livingston Stone Winter Run Conservation Hatchery in 1998 led to a partial recovery from 2001-2006.
The population declined again with the 2007-2009 and 2013-2015 droughts, with only partial recovery after two wetter periods (2010-2012 and 2016-2019).
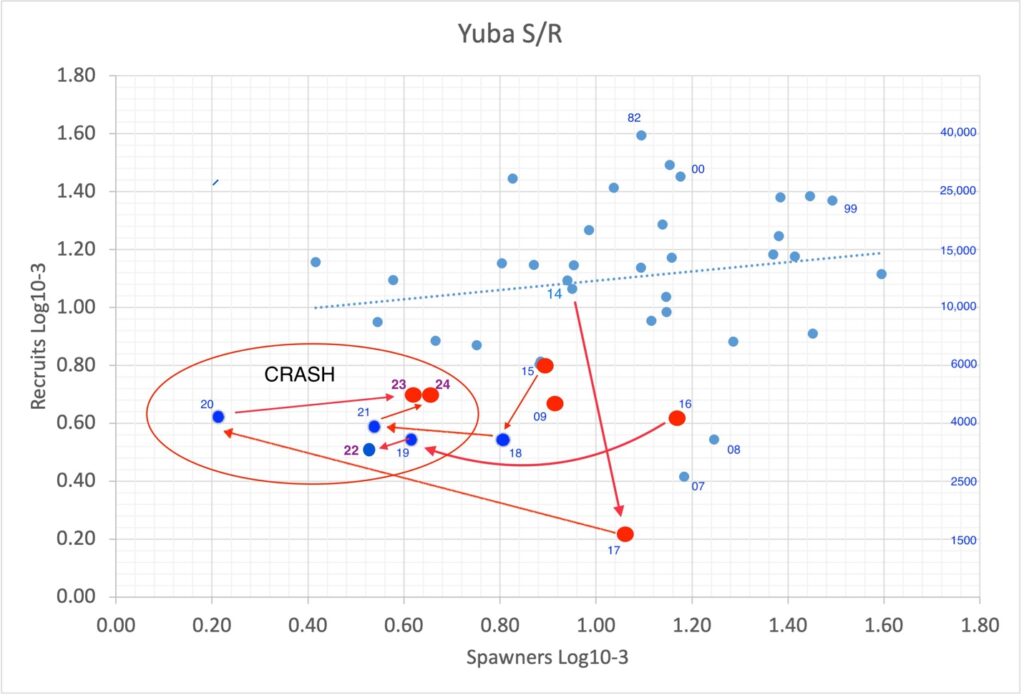
The 2020-2022 drought caused poor brood year 2020 and 2021 fry production (Figure 3) and subsequent poor escapement in 2023 and 2024 (see Figure 2). Emergency management actions in 2022, including the establishment of a new Battle Creek population and increased hatchery production, may have helped ameliorate some of the effects of the 2021-22 drought, leading to an increase in the 2025 returns (based on initial indications). Despite its low fry numbers, brood year 2022 had good juvenile survival conditions in wet winter 2023 and good conditions for returning adults in above-normal water year 2025. Also, closed fisheries from 2023-2025 contributed to strong 2025 escapement. The good 2025 run and the good habitat conditions in 2025 resulted in strong fry production of brood year 2025 (Figure 3).
Many factors contributed to these long-term population trends, including negative factors such as overfishing, degradation and loss of freshwater and estuarine habitat, Shasta-Trinity hydropower operations, poor ocean conditions, disease, and hatchery practices. These include:
- Overfishing – Though winter-run adults in the ocean are partially protected with closure of spring coastal fisheries near the entrance of San Francisco Bay, winter-run immature adults are not explicitly protected in other seasonal fisheries during their two-year period of ocean residence. Regional closures in ocean fisheries based on known ocean movements of winter-run are only partially effective.
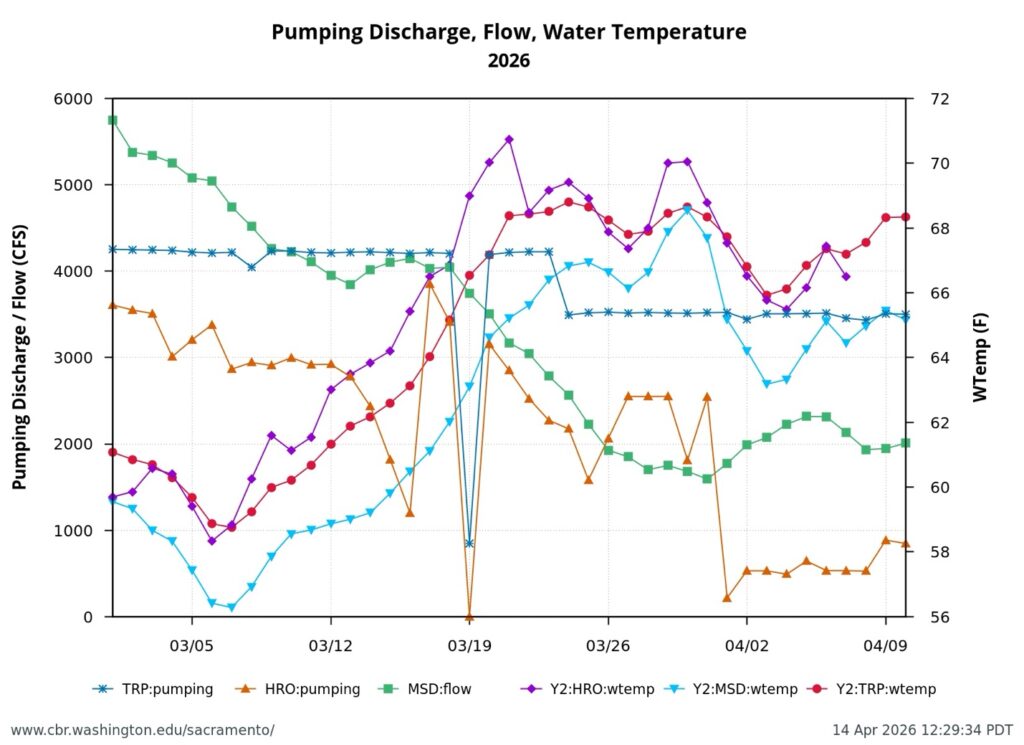
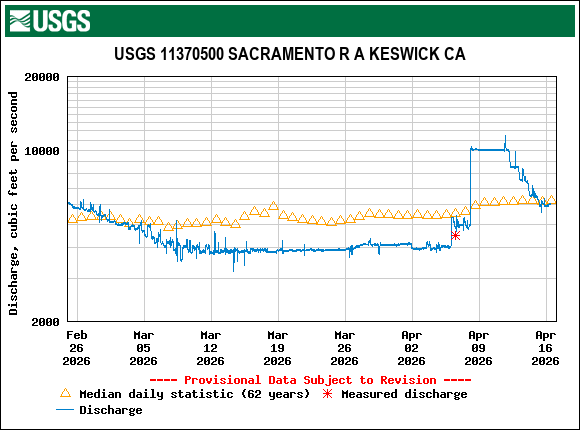
- Fall-winter rearing and out-migration habitat – Fall-winter habitat in the 200 miles of river and Delta habitat between Redding and the Bay are essential for winter-run brood year survival and smolt production to the ocean. Especially important are late fall and early winter movement to and through the Delta that are stimulated by stream flows and sustained by the first river flow pulse. Operation of the Delta’s Cross Channel gates and south Delta diversions restrictions play a very large role in successful outmigration (Figure 4).
- Hydropower Operations – Shasta-Trinity Division hydropower operations affect real-time stream flows and water temperatures in the lower Sacramento River in the summer, fall, and winter seasons. Late-fall reductions in Keswick Dam releases at the end of the irrigation season limit both spawning and incubation habitat and flow-related downstream migration.
- Poor Ocean Conditions – Poor Ocean conditions in 2007-2009 that contributed to the 2008-2009 crash of fall-run salmon also likely contributed to poor winter-run escapement.
- Hatchery Practices – Hatchery practices for the most part have been beneficial to the winter-run population through the release of several hundred thousand sub-yearling smolts per year. However, releases near the hatchery in drier years help minimally because fewer hatchery smolts survive to the ocean. Survival of coded-wire tagged winter-run hatchery smolts in dry years (Table 1) is only about 1/10th of that in wet Survival is improved when hatchery smolt releases are coordinated with natural or prescribed pulse flows.
Recommended Actions
Recovery recommendations are outlined in this section in three categories: habitat, hatcheries, and harvest. The two main themes of the recommendations are (1) the best strategies for dealing with warmer, drier years and (2) improving population recovery after droughts. These themes will require policy improvements for both drought and non-drought years. The recommendations can be reasonably implemented based on the historical range and capabilities of winter-run salmon, but they may prove difficult under present political and social demands for water supply and project operations (e.g., hydropower peaking demands).
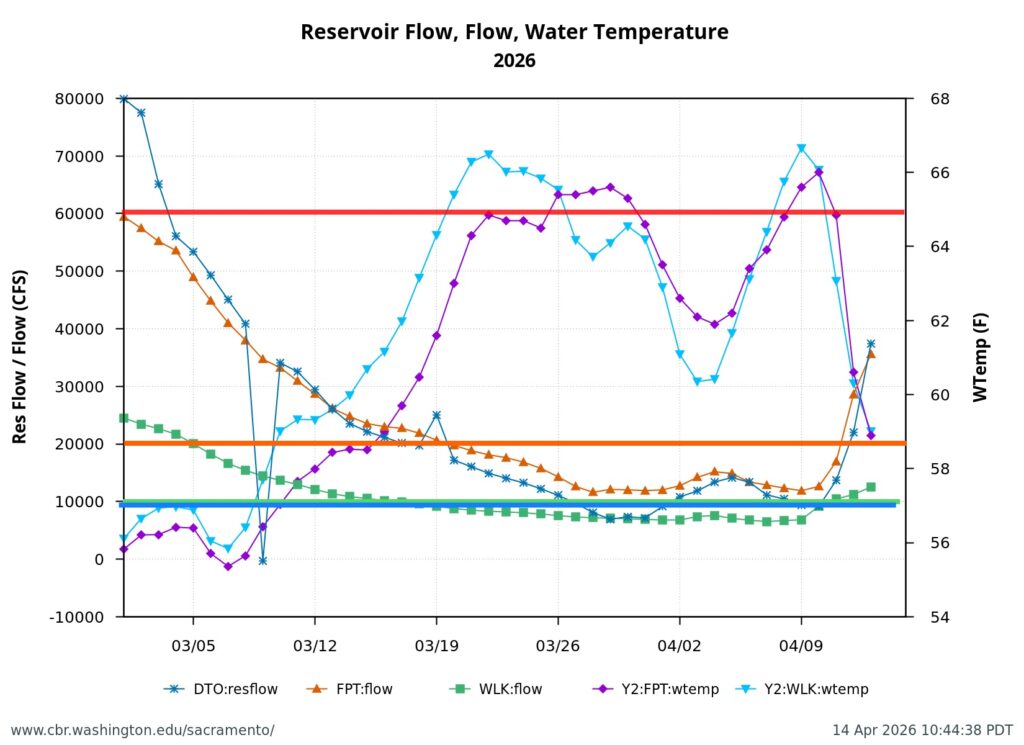
Lower Sacramento River – water temperature: Maintain spring water temperatures in the Lower Sacramento River downstream from Red Bluff to the Delta (Freeport gage) at <65oF. At all other times water temperature should be no higher than 68oF from Red Bluff to the Delta.
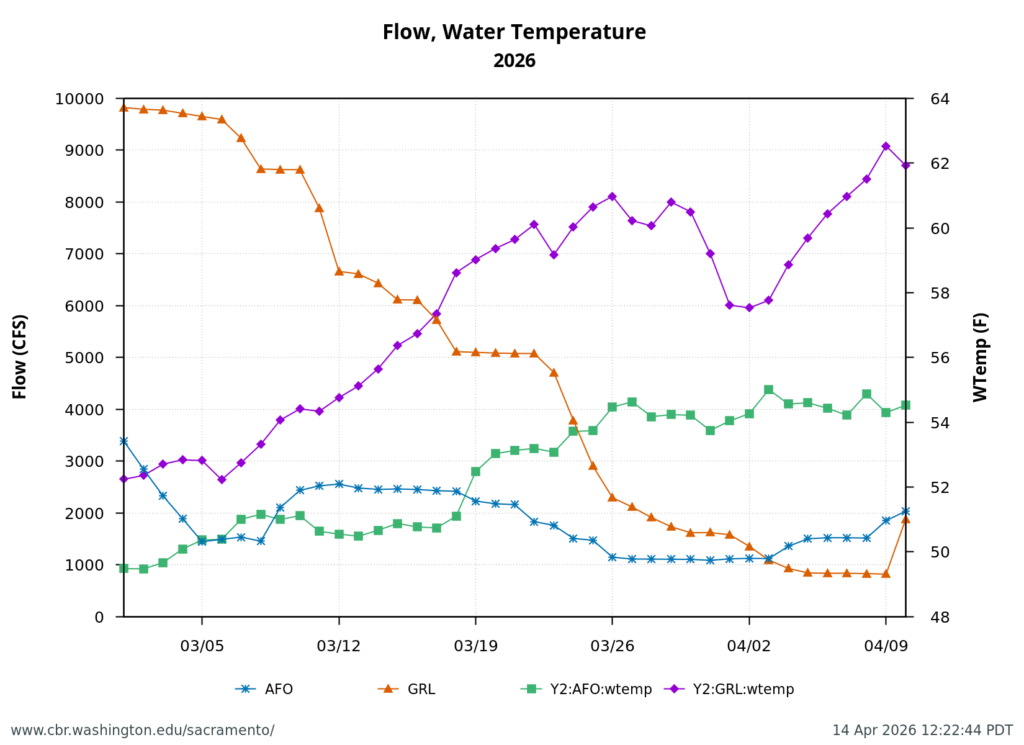
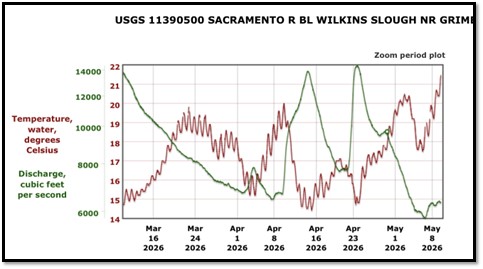
Upper Sacramento River – water temperature: Maintain water temperatures at or below a maximum of 53oF in the Upper Sacramento River below Keswick Dam (river mile or RM 300) downstream to the mouth of Clear Creek (RM 290), and at or below a maximum of 56oF below the mouth of Clear Creek to the mouth of Battle Creek, and at or below 60oF from the mouth of Battle Creek to Red Bluff (RM 240). (See Figure 5 for suggested standard/objective.)
Upper Sacramento River – streamflow: Adaptively manage stream flow in the 6,000-10,000 cfs range depending on available cold-water pool supply and irrigation needs, fall-run salmon spawning, and the need to ensure that a late summer/fall stage drop does not lead to redd stranding for winter-run or fall-run salmon. I recommend, at minimum, two pulse flows, each of 10,000 cfs minimum at Red Bluff, supported as needed by Keswick Dam releases, one in late fall or early winter coinciding with the first seasonal rains, and one around early February.
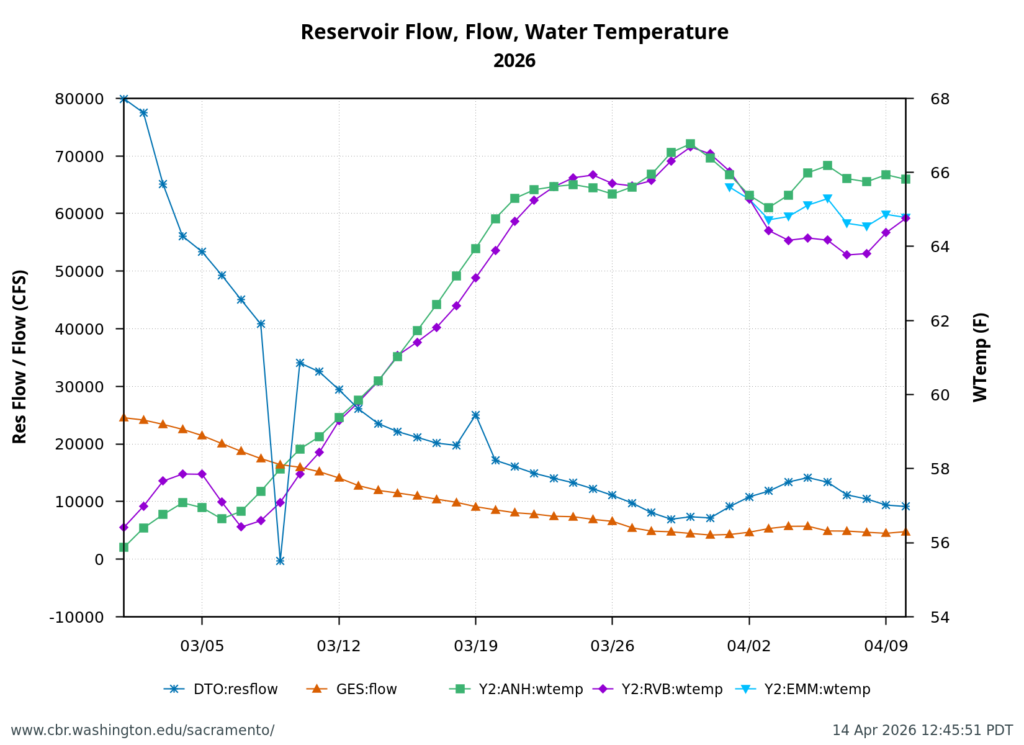
Sacramento River Base Winter Flow: For the Sacramento River through the Delta, I recommend a base minimum flow of at least 5,000 cfs to maintain juvenile salmon transport and rearing habitat.
Delta: The Delta Cross Channel (DCC) should be closed during fall flow pulses. South Delta exports should be kept to a minimum during fall flow pulse. Sacramento River Delta inflow (Freeport gage) should have a minimum daily (tidal) average flow of 20,000 cfs in late fall and winter. Delta outflow should have a minimum daily (tidal) average flow of at least 10,000 cfs in late fall and winter.
Hatchery: Release winter-run hatchery smolts to the Sacramento River and Battle Creek near Redding during flow pulses.
Hatchery: Raise hatchery fry in controlled Lower Sacramento River floodplain habitats for volitional release during flow pulses.
Above Shasta Reservoir Trap-and-Haul: More fully develop the trap-and-haul program to establish winter-run salmon subpopulations in (1) the spring-fed reach of the upper McCloud River above McCloud Falls, where stable water temperatures and stream flows are best for the logistical requirements of such a program; and (2) Ripley Creek, the South Fork Battle Creek tributary historically fed by Hazen Spring. Offspring from such efforts can be readily trapped from these controlled flow spring creeks and returned to the hatchery for further rearing or release.
Fishery Harvest: Mark-selective fishery harvest rules could limit harvest of natural-born winter-run salmon. Incidental catch (bycatch mortality) should be minimized in fishery areas frequented by adult immature and mature winter-run salmon through fishery restrictions. Mark-selective harvest would involve large-scale investment in more complete hatchery marking throughout the Central Valley hatchery system, most of which currently marks only one quarter of hatchery production.
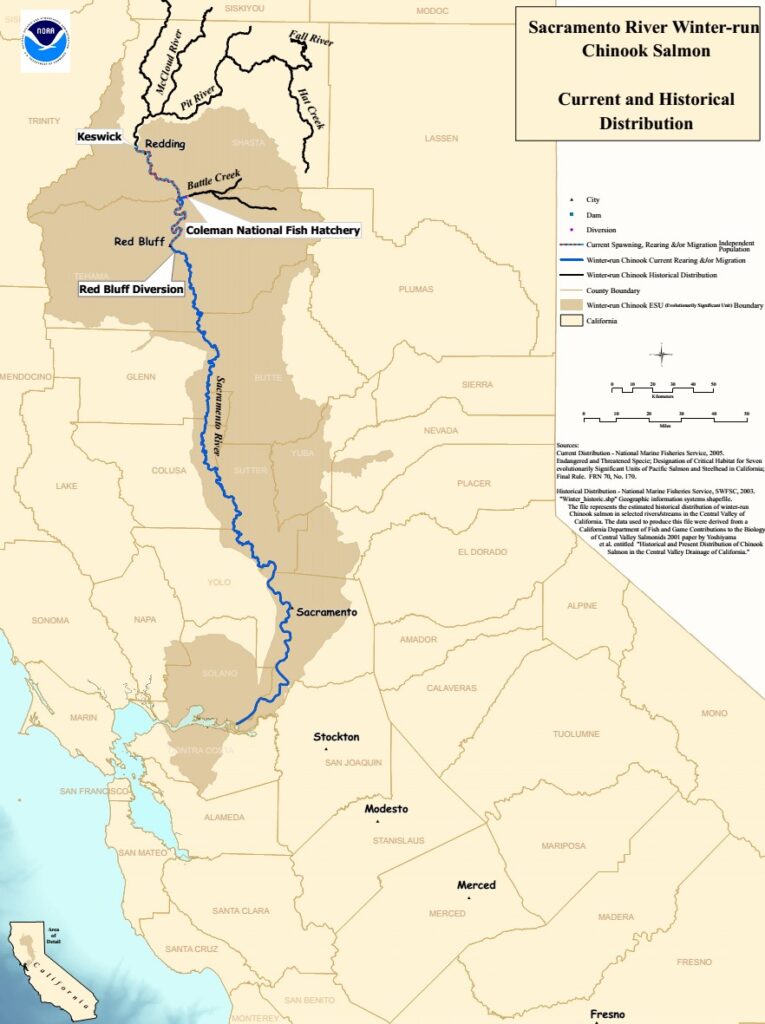
Figure 1. Winter-Run Chinook salmon Streams of the Central Valley. Source: NMFS.
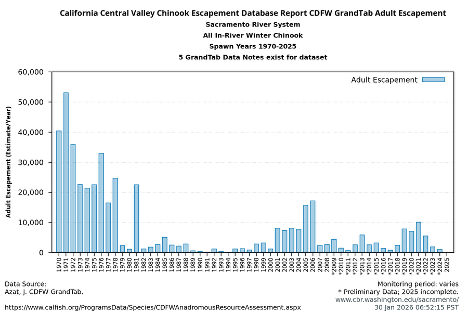
Figure 2. Winter-run Chinook salmon escapement in the Sacramento River mainstem, 1970 to 2024. Note: Winter-run escapement is made up of the total of these components: (a) Winter in-river Battle Creek – upstream of CNFH: Fish passed upstream of Coleman Weir; (b) Winter in-river Clear Creek: not a stable breeding population; (c) Winter in-river mainstem Sacramento – downstream of Red Bluff Diversion Dam (RBDD): downstream mainstem numbers based on upstream estimates and redd distribution; (d) Winter in-river mainstem Sacramento – upstream of RBDD: upstream mainstem in-river estimates prior to 2001 were based on RBDD counts. Subsequent estimates are based on carcass surveys. Numbers using RBDD data are adjusted for angler harvest.
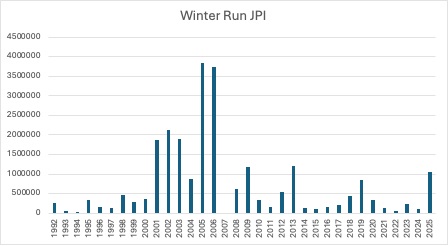
Figure 3. Winter-run juvenile production index (JPI) from Red Bluff trap collections 1992-2025. Data source: USFWS Red Bluff.
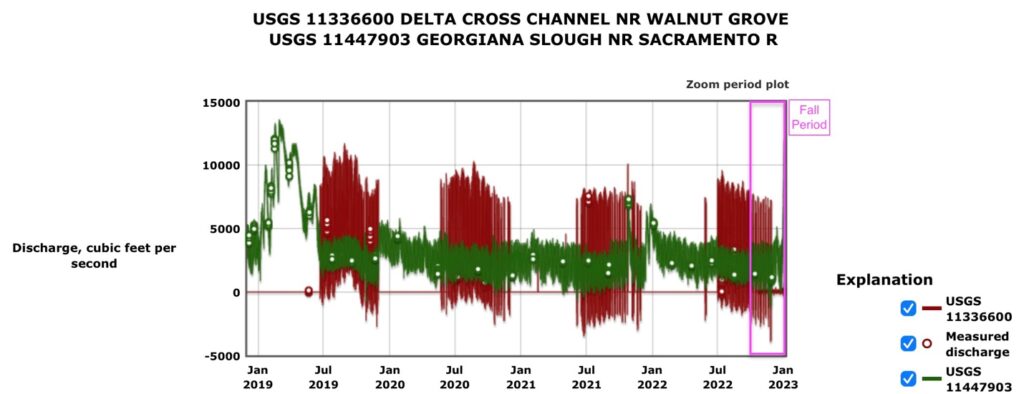
Figure 4. Hourly streamflow in the Delta Cross Channel and Georgiana Slough in the northern Delta, 2019-2022. Note that zero discharge at the Delta Cross Channel gage indicates the gates were closed.
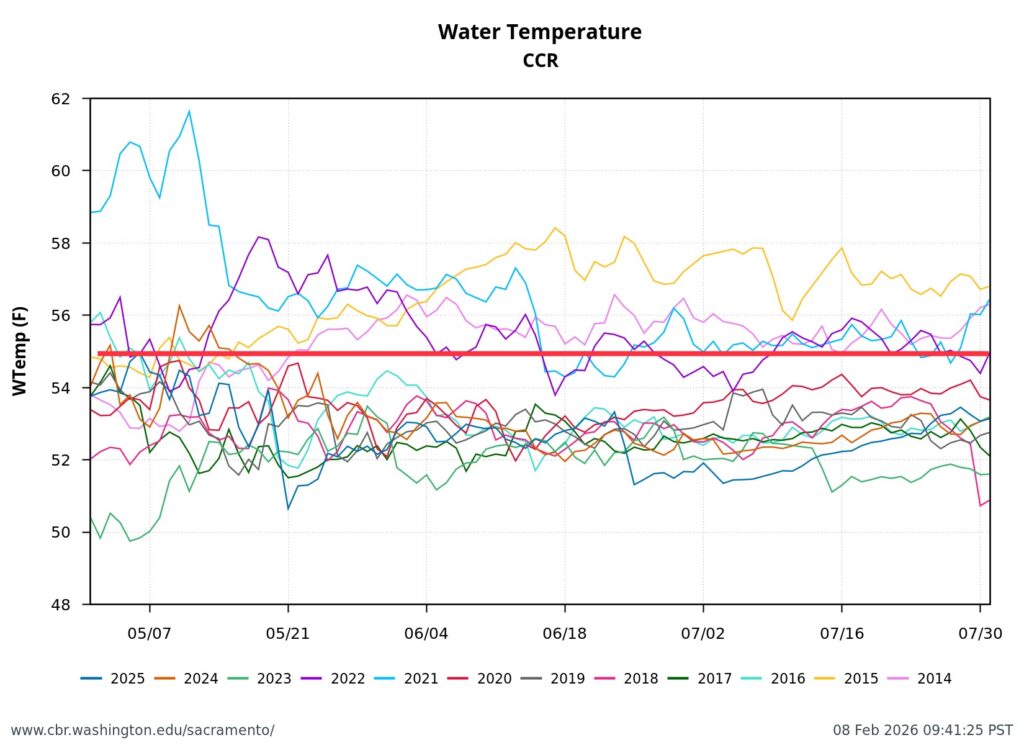
Figure 5. Hourly water temperature in the upper Sacramento River above the mouth of Clear Creek (rm 290) in the May-July spawning season of winter-run salmon. Red line is the upper end of safe spawning water temperature for salmon.
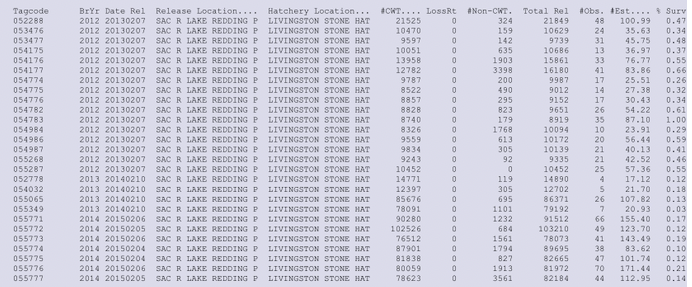
Table 1. Tag returns for winter-run hatchery smolt release groups for brood year 2012-2014, with date released, release location, and estimated percent survival (escapement plus fishery catch). Note there were significantly higher survival rates for brood year 2012 (2013 release date) than brood years 2013 and 2014.