A lot has been said about the drought’s effect on water supplies for cities and farms, but little is said about how Delta fish are faring. Freshwater inflow to the Delta was about half of normal in April through June 2022 because of the State Water Board Order approving the Department of Water Resources (DWR) and the Bureau of Reclamation’s Temporary Urgency Change Petition (TUCP) for Delta operations. With some of this limited Delta inflow going to water users during April, May and June, little was going to the fish.
The State Water Board granted the TUCP because Central Valley reservoir storage was so low at the end of winter in this third year of drought. During drought, most of the Delta’s late spring and summer inflow comes from releases from storage in Shasta, Oroville, and Folsom reservoirs.
The TUCP has ended, and the normal operating rules for the Delta under Water Rights Decision 1641 have gone back into effect as of July 1. It is now a good moment to review the effects of this most recent TUCP.
Conditions Under TUCP (April-June 2022)
Delta inflow from the Sacramento River and tributaries averaged about 7500 cfs while the TUCP was in effect (Figure 1). Releases from Folsom Reservoir averaged 1000-2000 cfs of this inflow. Releases from Oroville Reservoir varied widely, but averaged about 2500 cfs over the period. Other inflow came from the Sacramento River (Shasta Reservoir) and its tributaries, which during the TUCP period averaged about 3000-4000 cfs. The San Joaquin River and its tributaries contributed on average another 1000 cfs to Delta inflow.
There are three main uses of Delta inflow when inflow is low: repelling salt water, south Delta exports, and in-Delta use. South Delta exports were about 1300 cfs while the TUCP was in effect. Delta outflow, holding back the salt water, required roughly 4000 or more depending on tides. Net in-delta use (water diversions other than south Delta exports) accounted for the rest.
Salinity (EC, mS/cm) at Emmaton (west Delta Figure 2) , normally kept near 500 per the state standard for agriculture, increased to levels ranging from 500 to 8000 (Figure 2), with daily average of 2000 to 4000, four to eight times the standard.
At Jersey Point, where the standard is 450-750 EC, salinity ranged from 1200 to 2300 in June (Figure 3).
Conditions After TUCP (Early July 2022)
After the TUCP expired, conditions changed as regulatory requirements returned requirements under Decision 1641. Delta inflow increased to 12,500 cfs (Figure 1). At this date, salinity has fallen toward the appropriate salinity standards (Figures 3 and 4).
What does this mean for the Delta and its Fish?
- The agricultural salinity standard of 500 mmhos at Emmaton near Sherman Island in the Sacramento River channel was “relaxed” under the TUCP (Figure 3). Salt water was able to push further upstream and mix to a further extent with inflow. The daily salinity (EC) range of approximately 500-8500 mmhos, an increased level of spring salinity not seen since the 2014 and 2015 drought under earlier TUCPs.
- Likewise, the average daily salinity (EC) standard at Jersey Point near Sherman Island in the San Joaquin River channel (Figure 4) was also not being met.
- Salinity was managed under the TUCP to meet the minimum drinking water standards (<800 mmhos) near municipal water supply diversions in the central Delta (Figure 5). (I would not drink this water or put it on plants.)
- Throughout June, net flows in the Old and Middle River channels in the central Delta were southward toward the South Delta export pumps (Figures 2 and 6).
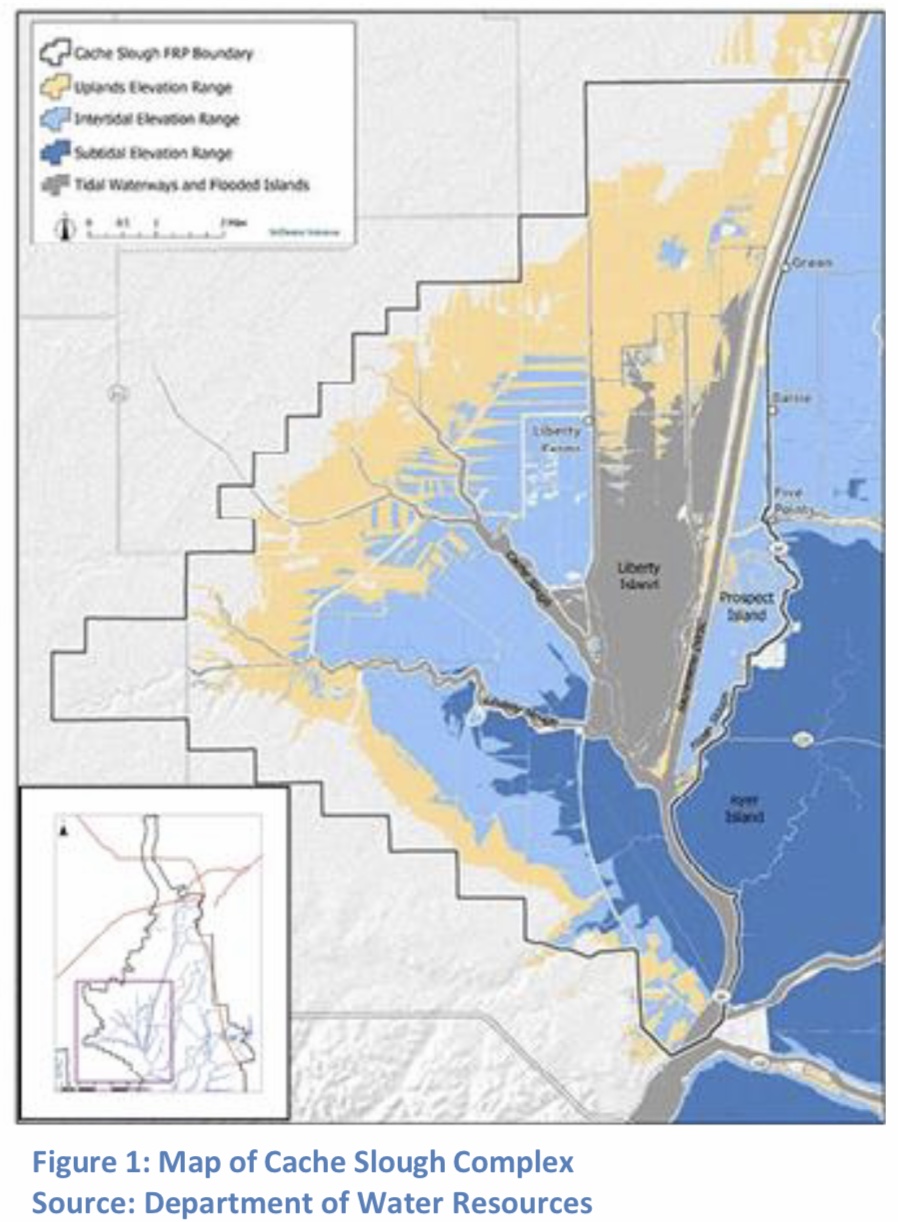
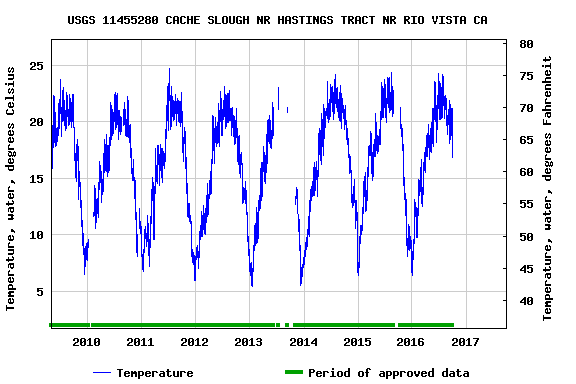
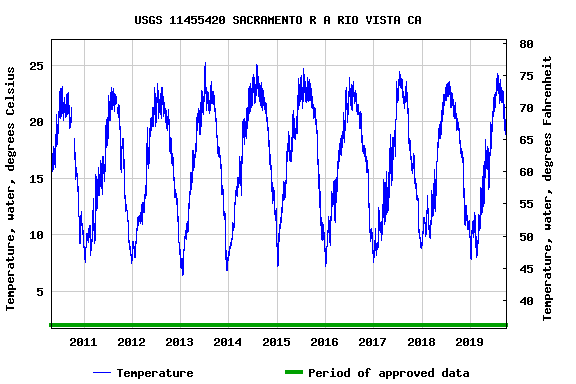
- While the TUCP was in effect, salt water moved upstream in the Sacramento River channel near Rio Vista and into Cache Slough (Figure 7). Within the Cache Slough Complex, water moved upstream (Figure 8) in part due to water diversions in the north Delta.
- Delta inflows from the Sacramento River at Freeport fell below 10,000 cfs from April through June 2022 as allowed under the TUCP (Figure 1). This drop led to the increases in salinity noted in Figures 2-8.
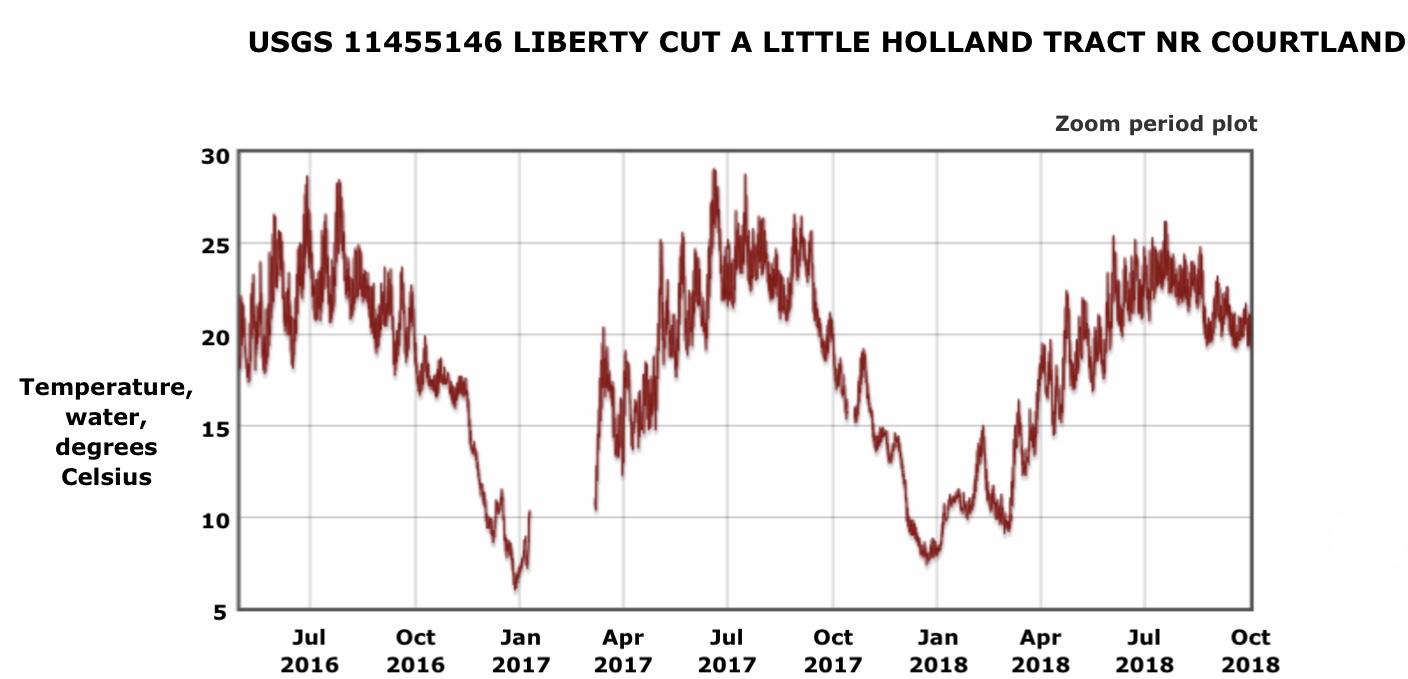
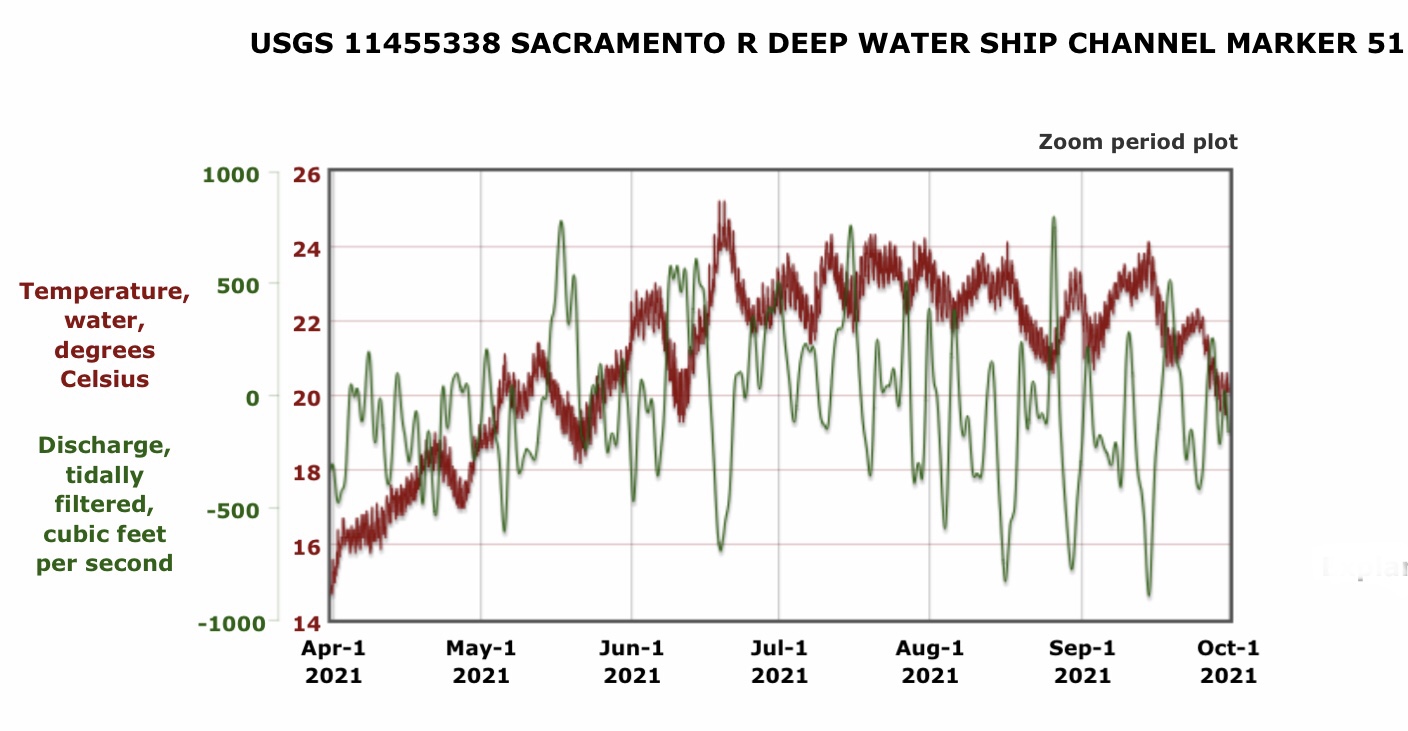
- Low Delta inflows also contributed to higher water temperatures throughout the Delta during and after the TUCP period (Figures 9 and 10). Water temperatures above 72 degrees are detrimental to most of the native Delta fish.
Conclusions:
- The TUCP allowed reduced Delta inflows that preserved some reservoir storage in critical drought year 2022.
- Inflows dropped below the normal 10,000-12,000 range that keep Delta salinity at Emmaton and Jersey Pt below the 500 mmhos agricultural salinity standard.
- Central and north Delta water diversions from the Delta’s pool of freshwater contributed to upstream movement and loss in quality and quantity of the low-salinity zone, a critical nursery habitat of Delta native fishes.
- The shift in the location of these important habitats into the north and central Delta, and the associated warming from the more-eastward position and lower net flows represent a serious impact on Delta native fishes including Delta smelt, longfin smelt, green and white sturgeon, winter-run, fall-run, and spring-run salmon, and steelhead, which use these habitats through the spring and summer for rearing and migration.
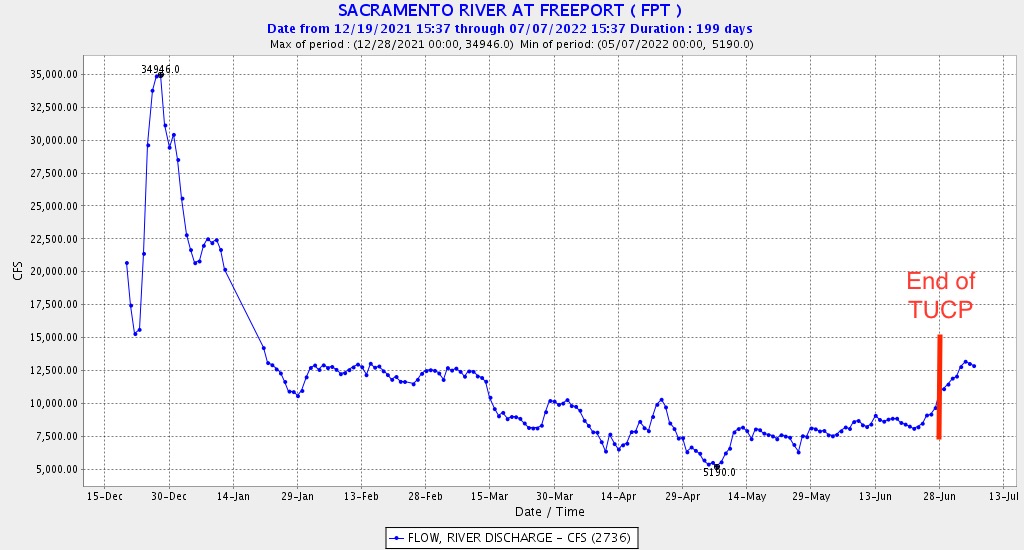
Figure 1. Delta inflow (cfs) from the Sacramento River as measured at Freeport in 2022. Note the TUCP allows streamflow at Freeport to be reduced below the 10,000-12,000 cfs range that is normally necessary to meet Delta salinity standards at Emmaton and Jersey Pt.
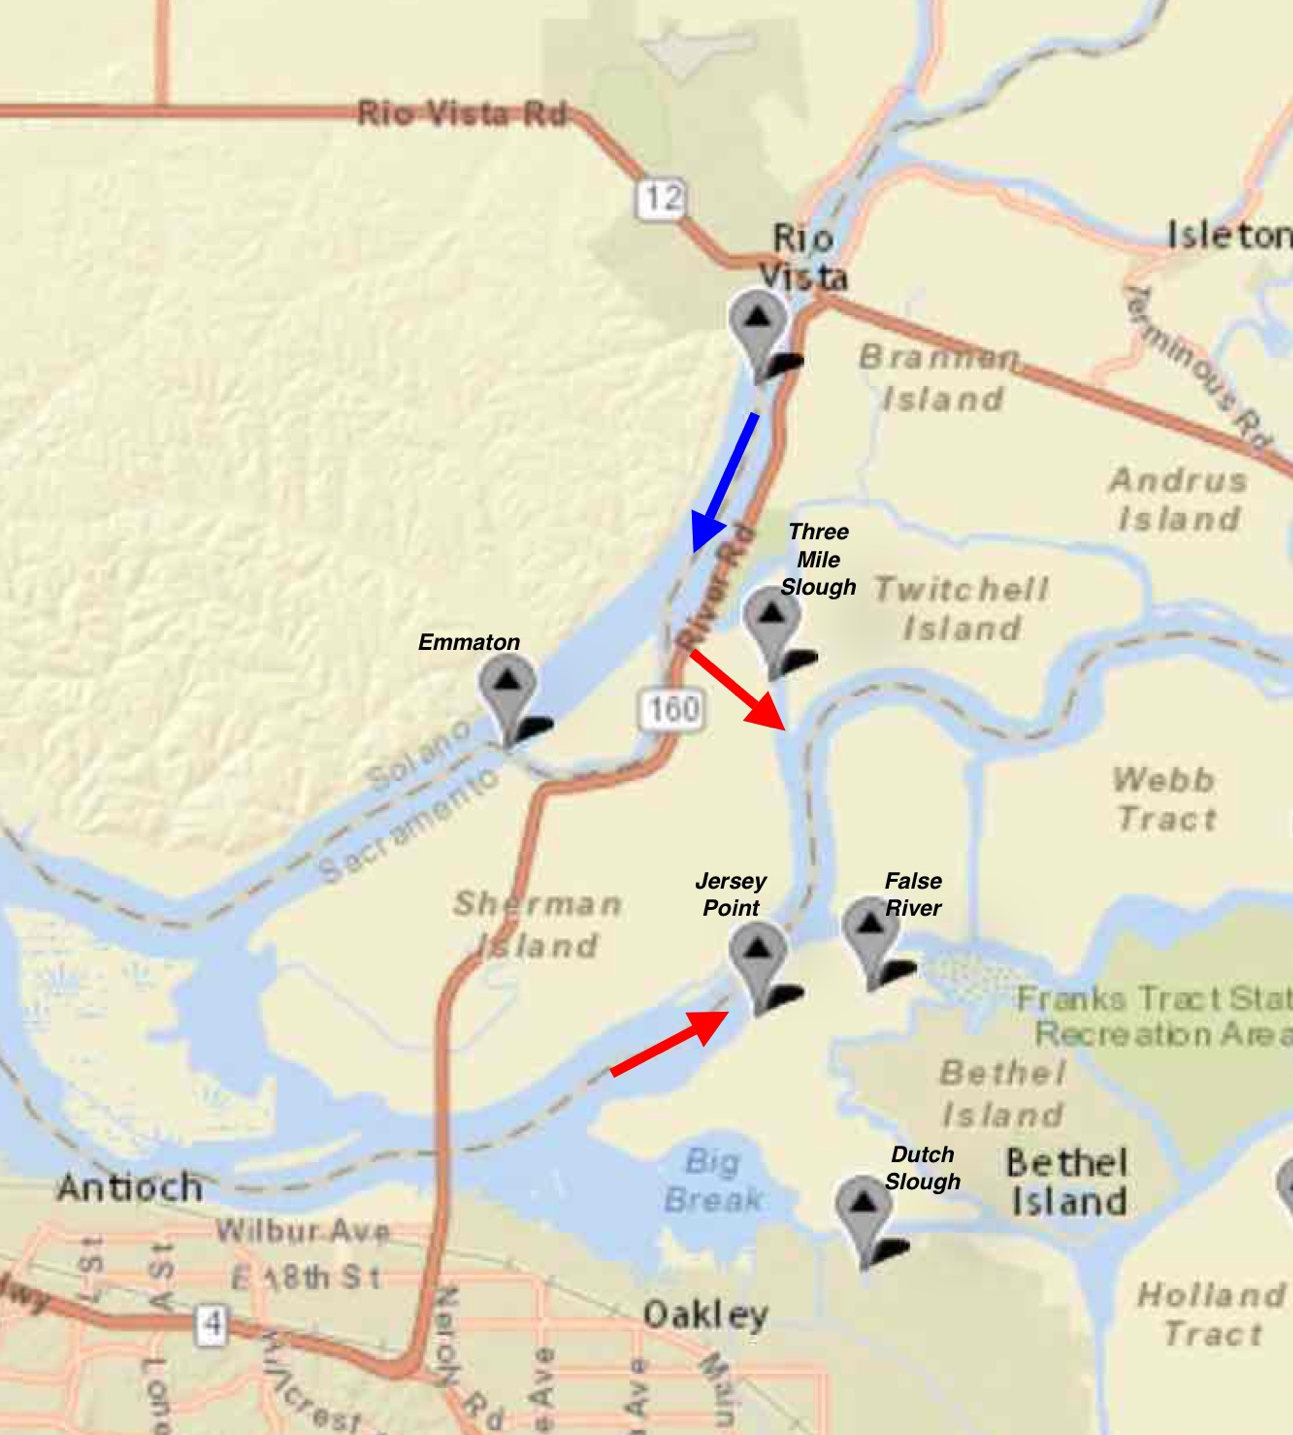
Figure 2. West Delta salinity gage locations with net flow direction during TUCP period April-June 2022.
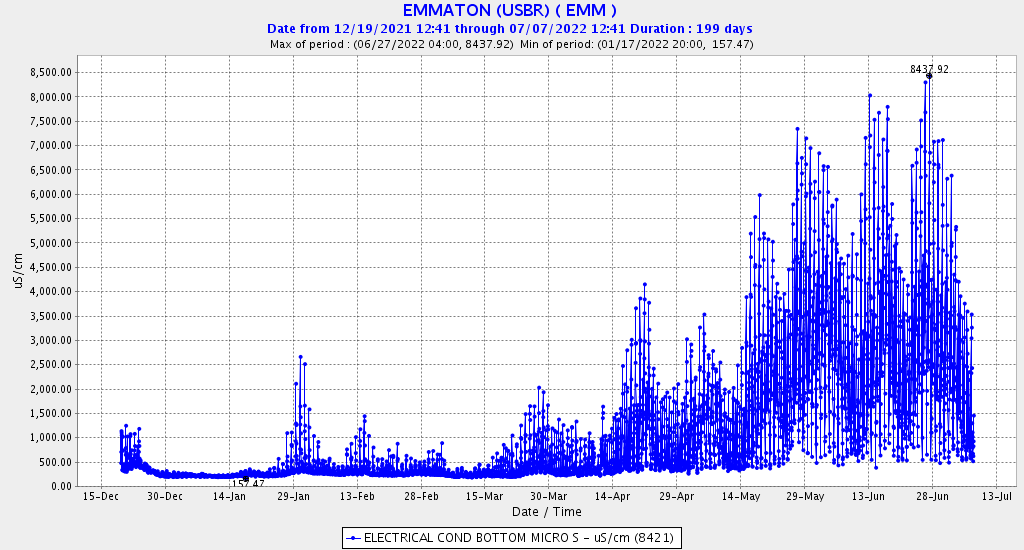
Figure 3. Salinity (EC) range at Emmaton in west Delta in 2022.
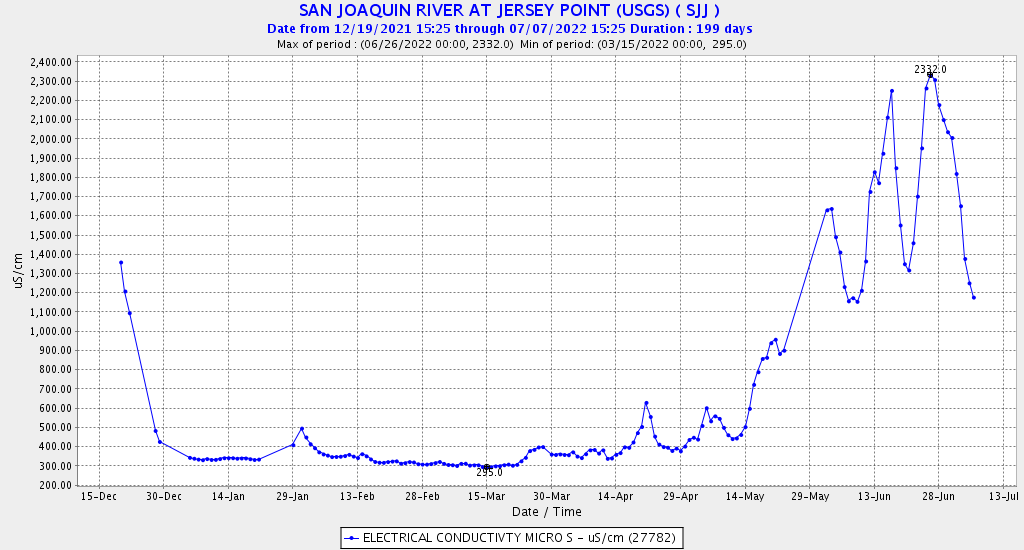
Figure 4. Salinity (EC) at Jersey Point in west Delta in 2022.
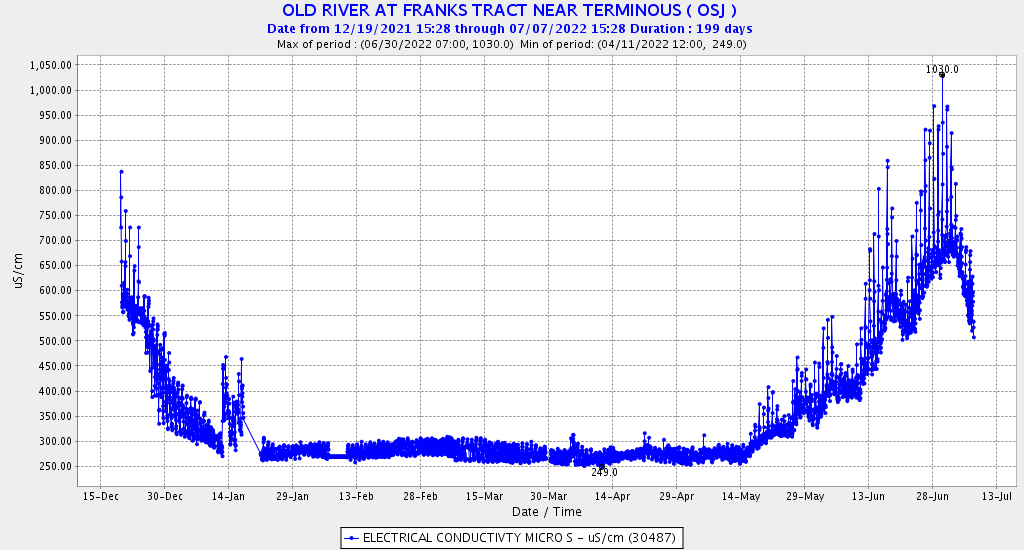
Figure 5. Salinity (EC) in the central Delta in Old River channel in 2022.
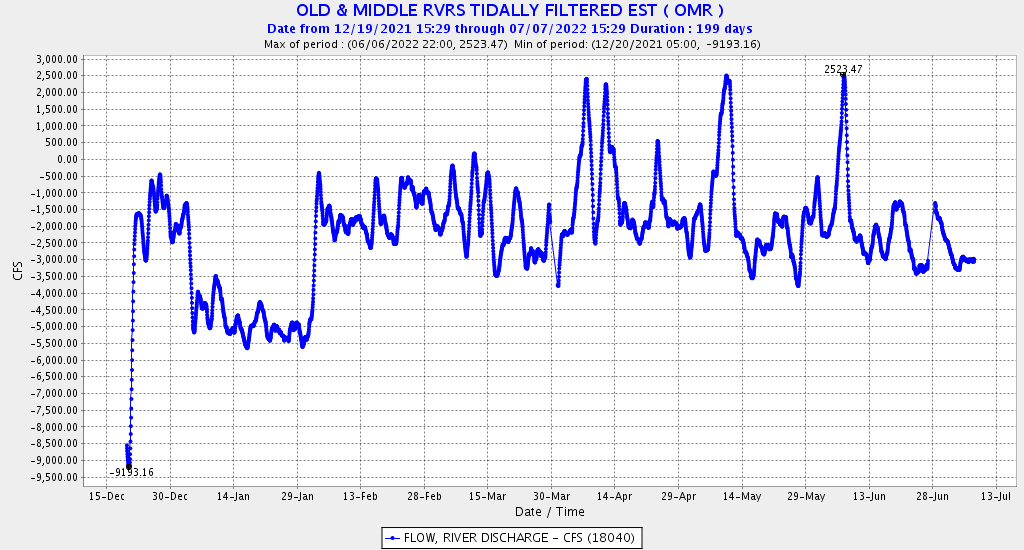
Figure 6. Net flows in central Delta Old River and Middle River channels in 2022.
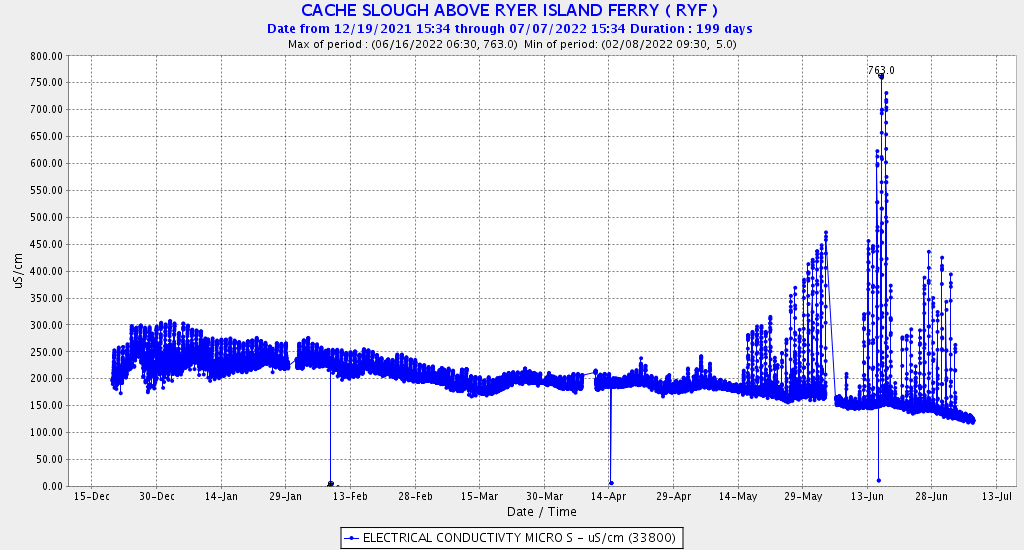
Figure 7. Salinity (EC) in Cache Slough channel of north Delta near Rio Vista in 2022.
Figure 8. Net flows in Cache Slough near Liberty Island in 2022.
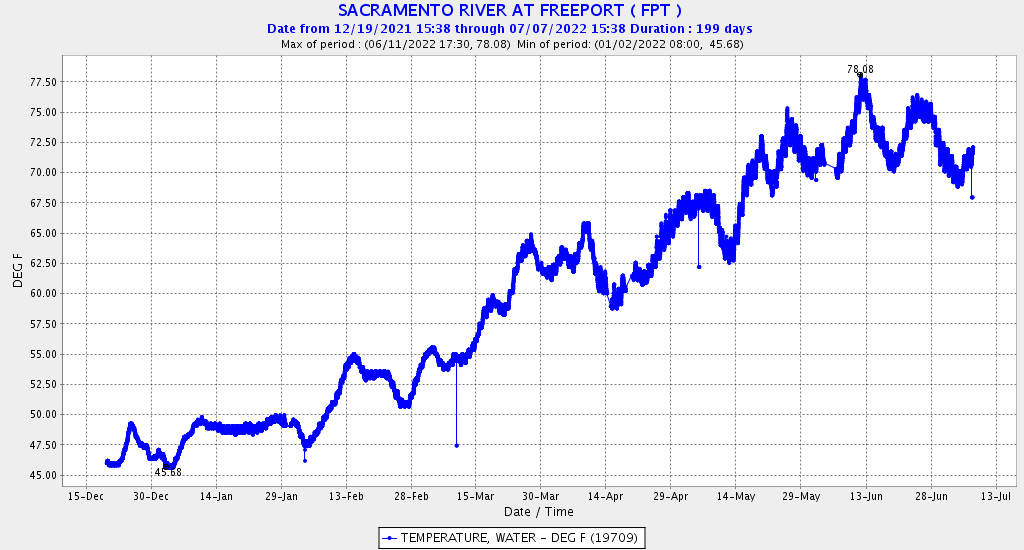
Figure 9. Water temperature of the Sacramento River near Freeport in 2022.
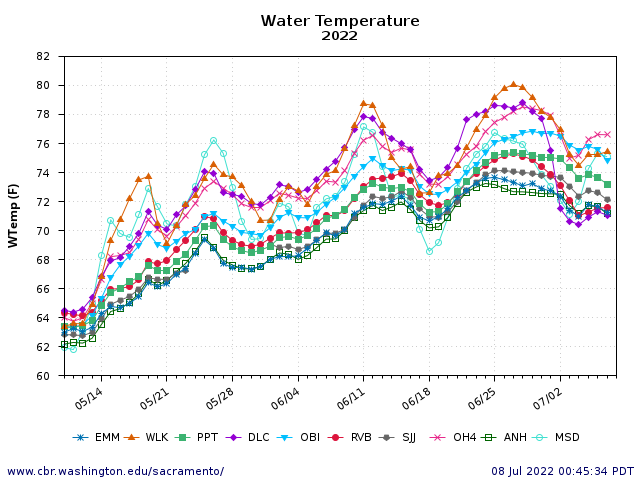
Figure 10. Water temperatures in the Delta and Delta inflows May-July 2022.
EMM – Emmaton on the Sacramento River channel in west Delta.
WLK – Lower Sacramento River below Wilkins Slough above the mouth of the Feather River.
PPT – Prisoners Pt in the central Delta channel of the San Joaquin River.
DLC – Sacramento River channel in the north Delta at the Delta Cross Channel.
OBI – Old River in central Delta.
RVB – Rio Vista Bridge in west Delta channel of the Sacramento River.
SJJ – San Joaquin channel in west Delta at Jersey Pt.
OH4 – Old River in central Delta.
ANH – San Joaquin River channel of west Delta at Antioch.
MSD – San Joaquin River channel at entrance to Delta at Mossdale.