Poor First Indicators of 2021 Winter-Run Salmon Fry Production

The first indicators of winter-run salmon spawning survival in the Sacramento River in 2021 indicate poor production, as expected.1 The drought and Reclamation’s operations in 2021 have provided production levels on par with 2014 and 2015, the last two critical drought years.

Red Bluff screw-trap collections since August 1, 2021 have been very low (Figure 1). The spawning delay in 2021 due to high spring water temperatures and low flows may be delaying downstream movement. However, outmigration patterns are similar to 2014 and 2015 (Figures 2 and 3). Even 2020, a dry year with poor production, had numbers five times higher than 2021 to date (Figure 4). Historical wet years with good production like 2006 had collection numbers ten times higher (Figure 5). There is a slim chance that the spawning delays and low flows of 2021 will provide screw-trap collection patterns similar to 2018, a dry year with a later collection peak (Figure 6).

Regardless of the low fry production, the young winter-run salmon must still make it 300 miles to the ocean this fall and winter, a phenomenal hurdle under the best of circumstances. Low fall flows will make the journey difficult. The class of 2021 will get no help from storage releases. Like almost every other user of California water in the beginning of water year 2022, outmigrating winter-run salmon are wholly dependent on future rain to provide the water they need.

Figure 1. Late summer 2021 catch of salmon fry at Red Bluff traps with water temperature, streamflow, and water turbidity.

Figure 2. The 2014 catch of salmon fry at Red Bluff traps with water temperature, streamflow, and water turbidity.

Figure 3. The 2015 catch of salmon fry at Red Bluff traps with water temperature, streamflow, and water turbidity.

Figure 4. The 2020 catch of salmon fry at Red Bluff traps with water temperature, streamflow, and water turbidity.

Figure 5. The 2006 catch of salmon fry at Red Bluff traps with water temperature, streamflow, and water turbidity.

Figure 6. The 2018 catch of salmon fry at Red Bluff traps with water temperature, streamflow, and water turbidity.

A Possible Chance to Save Some Sacramento River Salmon in 2021

The Problem

The 2021 target upper water temperature limit for salmon spawning and gravel-bed egg incubation below Shasta/Keswick dams on the Sacramento River near Redding was 55oF.  It is a little late for that now.  Since September 1, Keswick releases have been greater than 56.5ºF, and are now approaching 58ºF.  That’s too warm for the winter-run salmon who have finished spawning (Figures 1 and 2).

But what about the far larger run of fall-run salmon during their peak October spawning?  Can water temperatures downstream of Keswick be lowered back to 55oF in October?  The answer is a qualified yes.

Figure 1. Daily average water temperature of Sacramento River near Redding (SAC gage), September 1-21, 2021.

Figure 2. Daily average water temperatures from Shasta Dam powerhouse (TCD), immediately below Shasta Dam (SHD), and from Keswick Dam (KWK) to Sacramento River, September 1-21, 2021.

The Solution

A “qualified yes” means it would be a complex undertaking involving two actions possible under Reclamation’s operation of its Shasta/Trinity Division:

  1. Switching most or all of Shasta releases to the cold-water lower river outlets of the dam and ceasing warm-water hydropower releases from the dam’s powerhouse.
  2. Minimizing warm-water hydropower releases from Whiskeytown Lake to Keswick Reservoir.

Much of the remaining cold-water pool in Shasta Reservoir is being used to overcome warm-water hydropower releases into Keswick Reservoir (~60oF or higher) before water is released to the Sacramento River below Keswick Dam.  Cutting hydropower releases and rationing the available cold-water-pool supply through Shasta Dam’s lower river outlets is therefore a potential solution to warm water releases to the river.  Though this would reduce hydropower in the short-term, it would save storage in the long-term.

The solution would require a substantial reduction in Shasta Reservoir releases to ensure the cold-water-pool is not exhausted over the next month or more.  However, reducing releases would lower river water levels and strand salmon redds or reduce egg-embryo survival of remaining active winter-run redds or any newly spawned spring-run and fall-run redds.

A possible resolution is to drop flows after the vast majority of winter-run fry have left their redds and before most of the fall-run salmon have spawned.  This has been the standard management approach in many years to save storage – sometime in late September or in October.

Further Context

Under present conditions in late September 2021, access to the cold-water pool in Shasta Reservoir occurs primarily during the afternoon/evening, during peaking-power releases (Figures 3-5) from the penstocks via the Temperature Control Device (TCD) on the face of the dam.  Side-gate openings on the TCD (Figure 6) are able to pull cold water from below only during peak releases.  This pattern indicates that a modified solution might be to reduce warm-water power releases during non-peak operations, while retaining some peaking power releases from Shasta Dam in combination with lower level dam outlet releases.

Figure 3. Hourly flow releases from Shasta Dam September 18-23, 2021.

Figure 4. Hourly water temperature of water releases from Shasta Dam September18-23, 2021.

Figure 5. Hourly water temperature of water releases from a Shasta Dam penstock September18-23, 2021.

Figure 6. Shasta Dam conditions and operation on September 15, 2021.


Addendum to the State Drought Plan – August 31, 2021, Part 2: This Is a Test(?)

The California Department of Water Resources (DWR) and the U.S. Bureau of Reclamation (Reclamation) released a Central Valley Drought Contingency Plan Update on August 31, 2021. Part of the Addendum’s section on Sacramento River Temperature Management describes bypassing Shasta Dam’s hydropower generating facilities in order to cool Shasta Reservoir releases to the lower Sacramento River:

Reclamation performed a cold water power bypass test on August 29 to determine the feasibility of using the bypass to cool Sacramento River temperatures in the late summer and early fall. The results of this test and any potential future partial bypass will be discussed with the fishery agencies through the Sacramento River Temperature Task Group to determine the potential benefits and impacts of taking the action and ultimately whether the group recommends a partial power bypass for consideration.

The Test

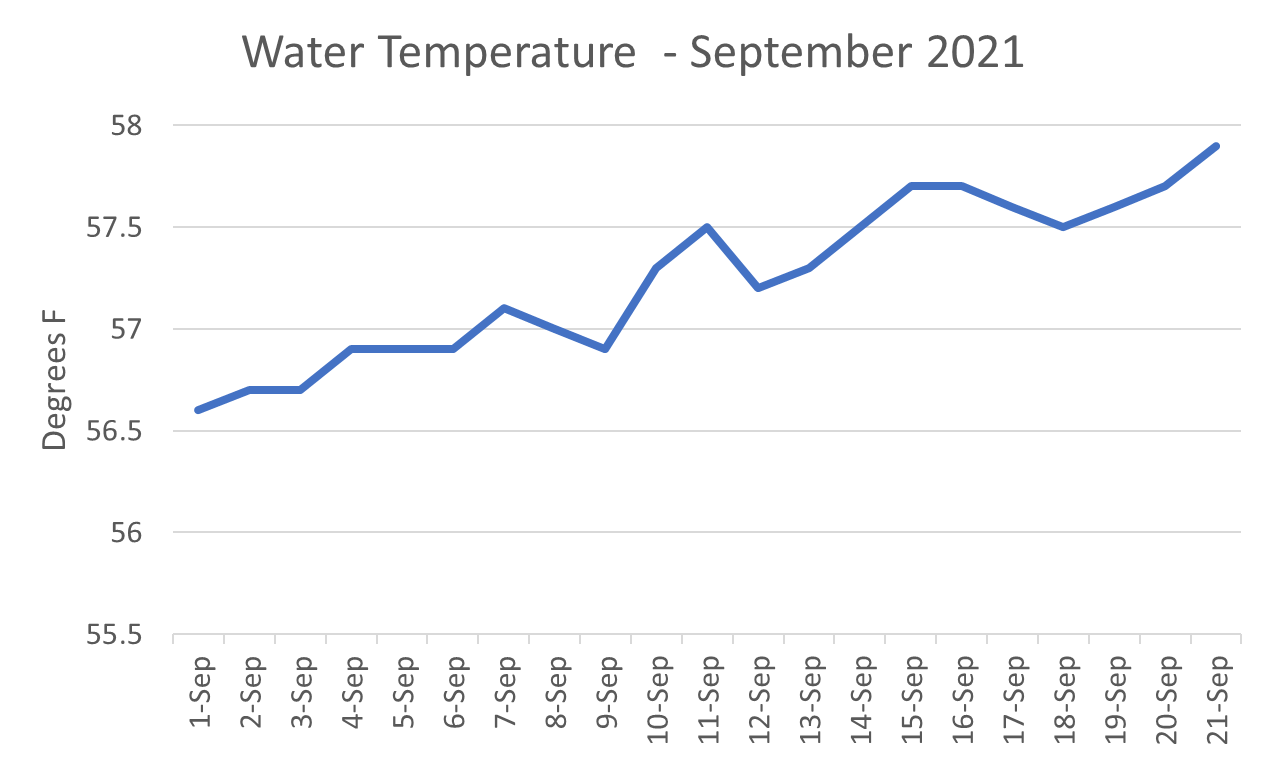
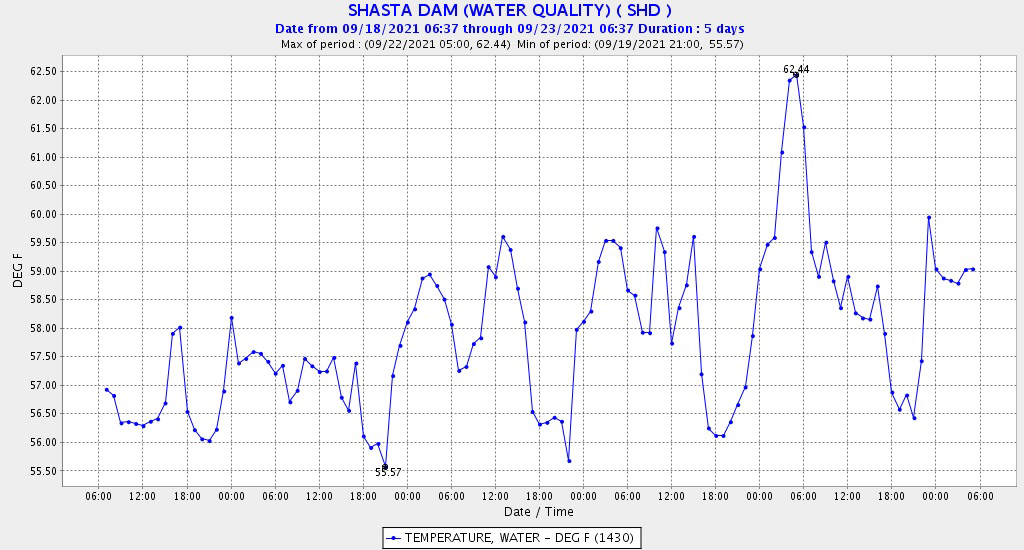
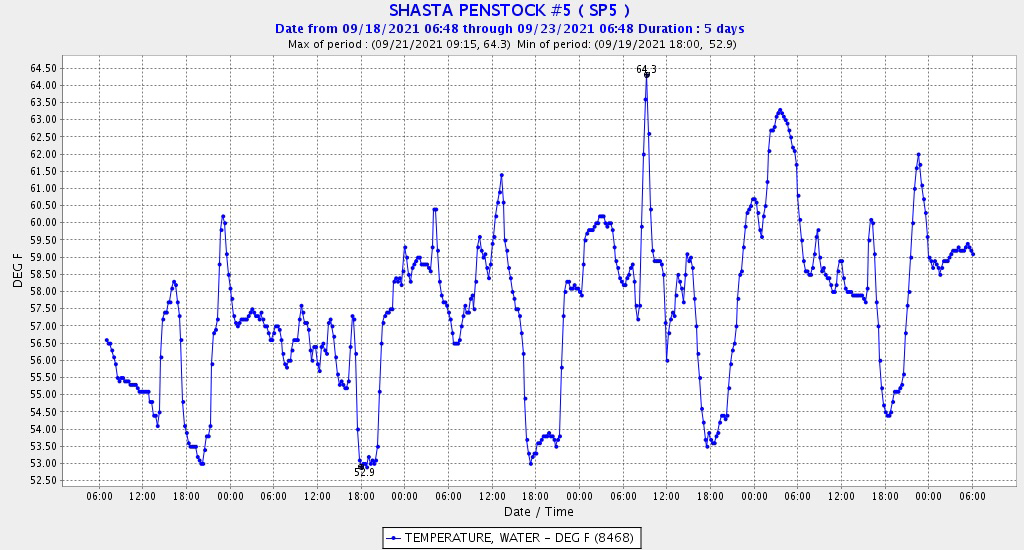
As summarized in the quote above, Reclamation conducted a test on August 29. The test involved releasing cold water from near the bottom of the dam rather than from the power penstock through the Temperature Control Device (TCD) tower on the inside face of the dam. Water temperatures of releases from the TCD steadily increased through late August as the water level in the reservoir continued to fall (Figure 1). Side gate intakes on the TCD were taking in increasing amounts of warmer water from near the surface each day (Figure 2).

Results

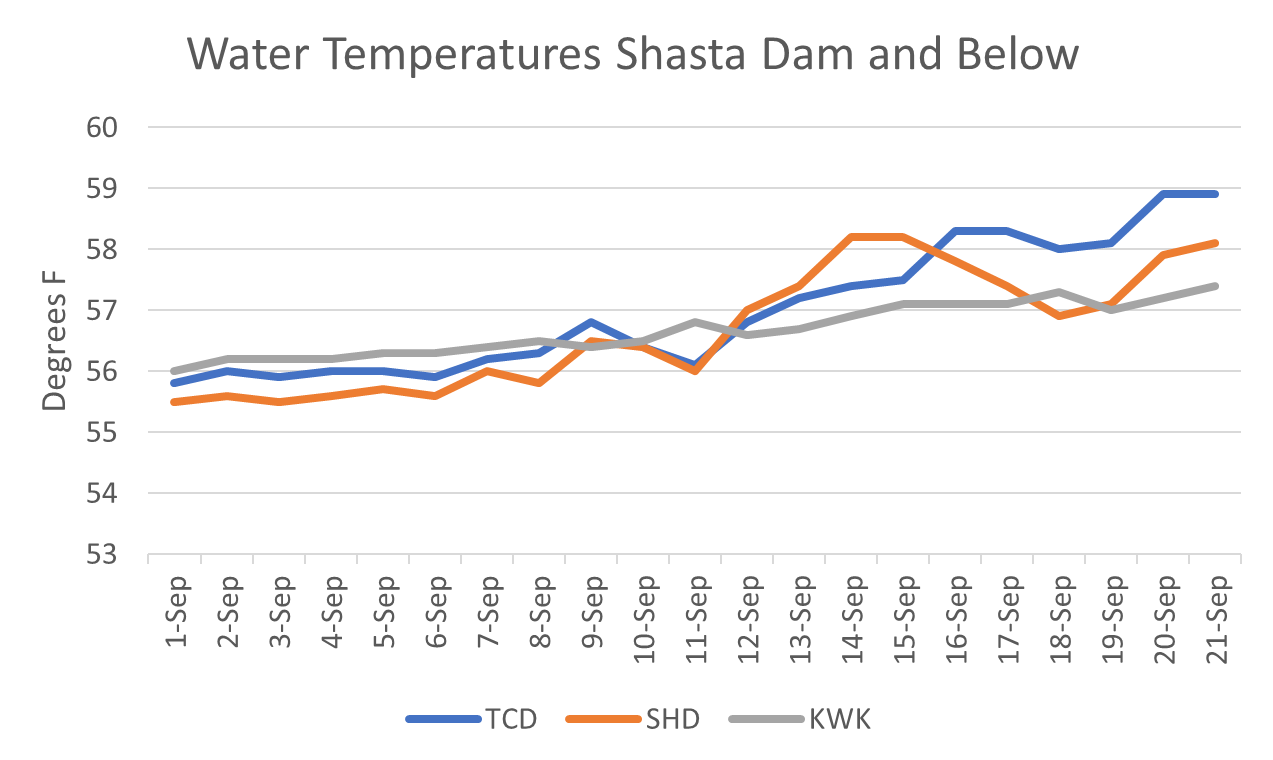
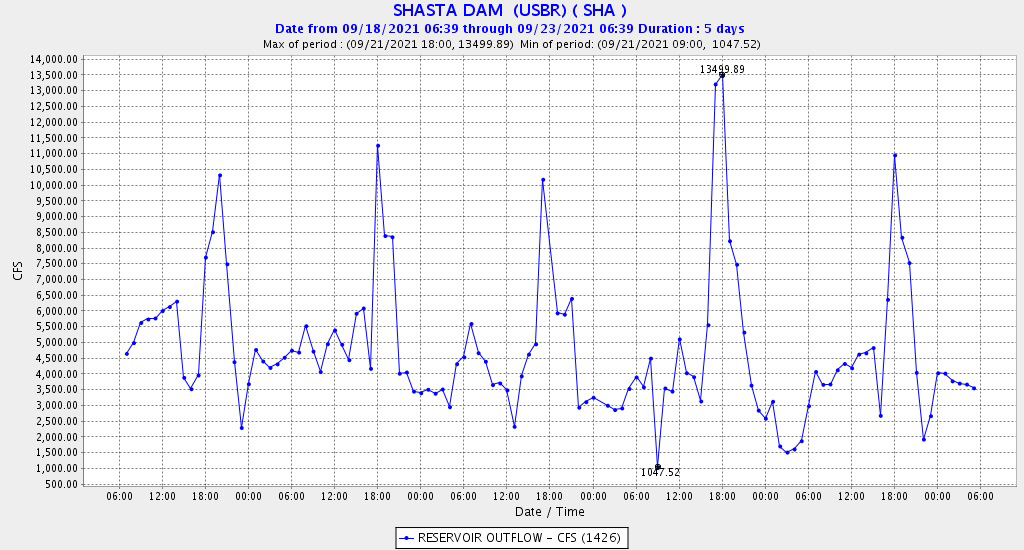
The August 29 morning test involved releasing cold water from the bottom of Shasta Reservoir (with minimum TCD release). As expected, it dramatically reduced water temperatures (about 4º F), at the head of Keswick Reservoir immediately downstream of Shasta Dam, while the test was going on (Figure 3). The test was followed by the normal afternoon peaking-power, warmer releases from the TCD, penstocks, and turbines/powerhouse (Figure 4). It was difficult to determine the proportion of releases from the two sources (the blend) in the morning, but it was obvious that water released during the morning of August 29 was cooler than water released at other times during that day or other days that week. The effect of the August 29 test on the Sacramento River below Keswick Dam was barely noticeable (Figure 5).

Analysis

Releasing cold water from Shasta Dam’s bottom outlet reduces river water temperature below Shasta Dam compared to release through the TCD. However, the Addendum leaves options for a “potential future partial bypass” of Shasta Dam’s power facilities a complete black box.

The prospective objective of a partial power bypass would be to cool the Sacramento River downstream of Keswick Dam, where the salmon are. So many more factors affect release temperatures from Keswick. The release from Shasta of 1000 acre-feet of water over a six-hour period, in a day when the total Shasta release was close to 14,000 acre-feet, offers little insight into a two or three-month strategy for managing the already-diminished cold-water pool that remains in Shasta Reservoir following a spring and summer of excessive releases by Reclamation.

Setting aside the element of time for a moment, Keswick release temperatures depend on the ratio of the colder water released from Shasta Dam to the warmer power releases from both Shasta Dam and Whiskeytown Dam (through the Spring Creek Powerhouse) to Keswick Reservoir. An immediate measure Reclamation can take to reduce the temperature of the Keswick release is to cease the 1000+ cfs it is releasing to Keswick from Whiskeytown.1 In the short term, this could bring the Keswick release close or closer to the 55º target maximum for the 10-mile reach downstream of Keswick.

Increasing the proportion of releases from Shasta’s bottom outlet would reduce water temperatures in the short-term. However, how long this benefit would last, and whether there would be a net improvement or the opposite over one month or two months, involves calculus of how much cold water the change in operations would drain from the cold-water pool, and how quickly. In this regard, the description in the August Addendum says nothing at all about “the action” or potential actions that “will be discussed” by the Sacramento River Temperature Task Group.

Reclamation has put itself in a position where deciding which fish to save is inseparably deciding which fish to sacrifice. Those may be the same fish: the fish saved now by decreasing water temperatures to protect eggs in the redds may die later when Reclamation runs out of accessible cold water to keep the alevin from those eggs alive in a month. About this, the breezy report of a test says nothing at all.

Then there is the unknown but potentially even more severe consequence of depleting Shasta storage this year in the face of looming disaster if water year 2022 is dry.

This post is part 2 in a series on DWR and Reclamation’s August Addendum to the 2021 Drought Plan.

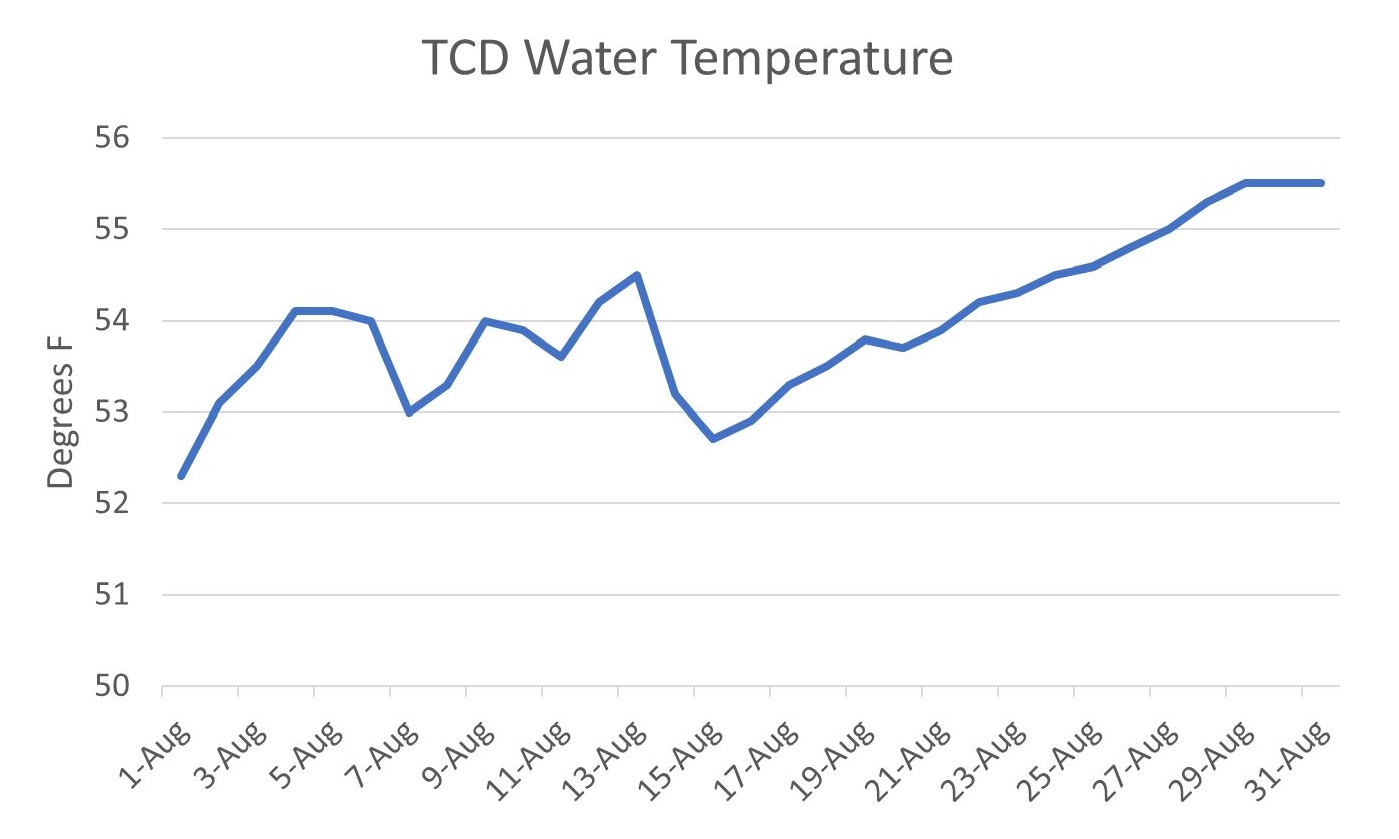
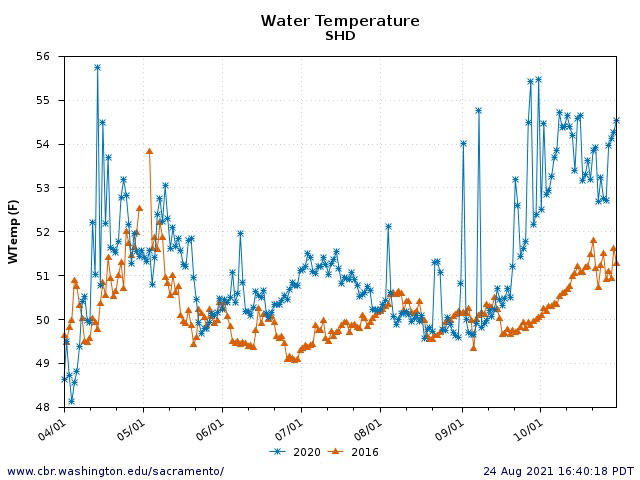
Figure 1. Water temperature of Shasta powerhouse releases in August 2021.

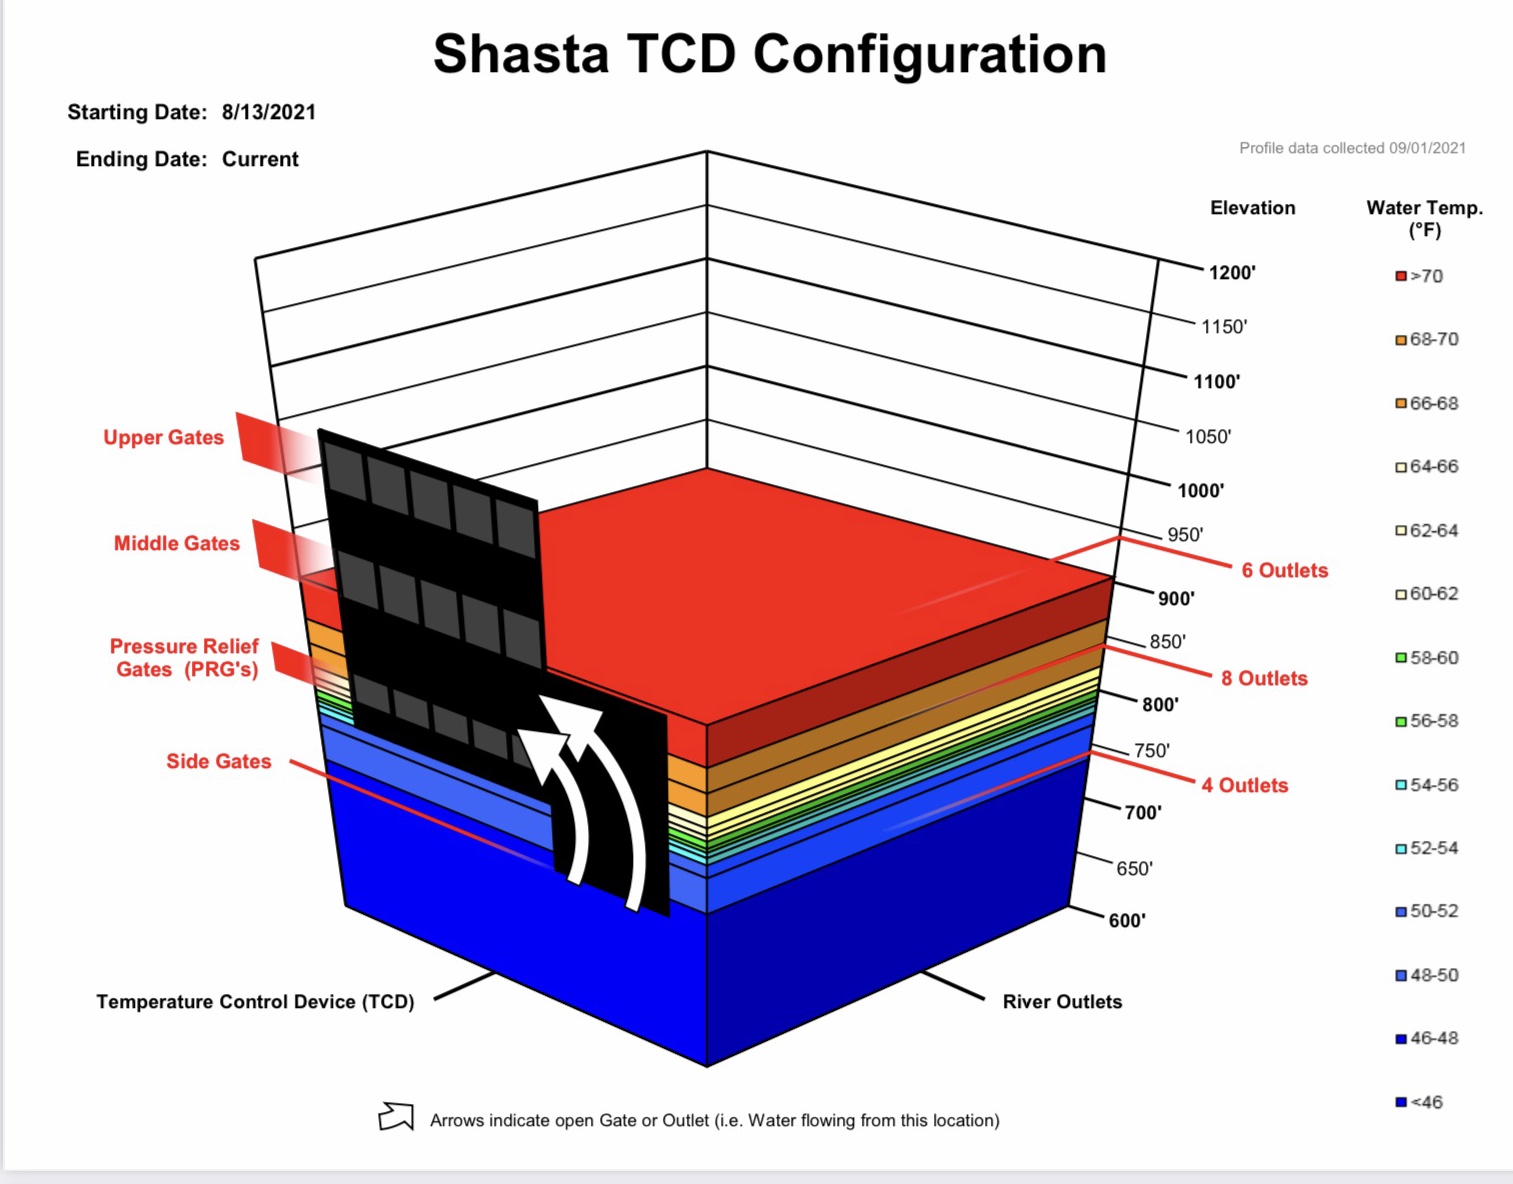
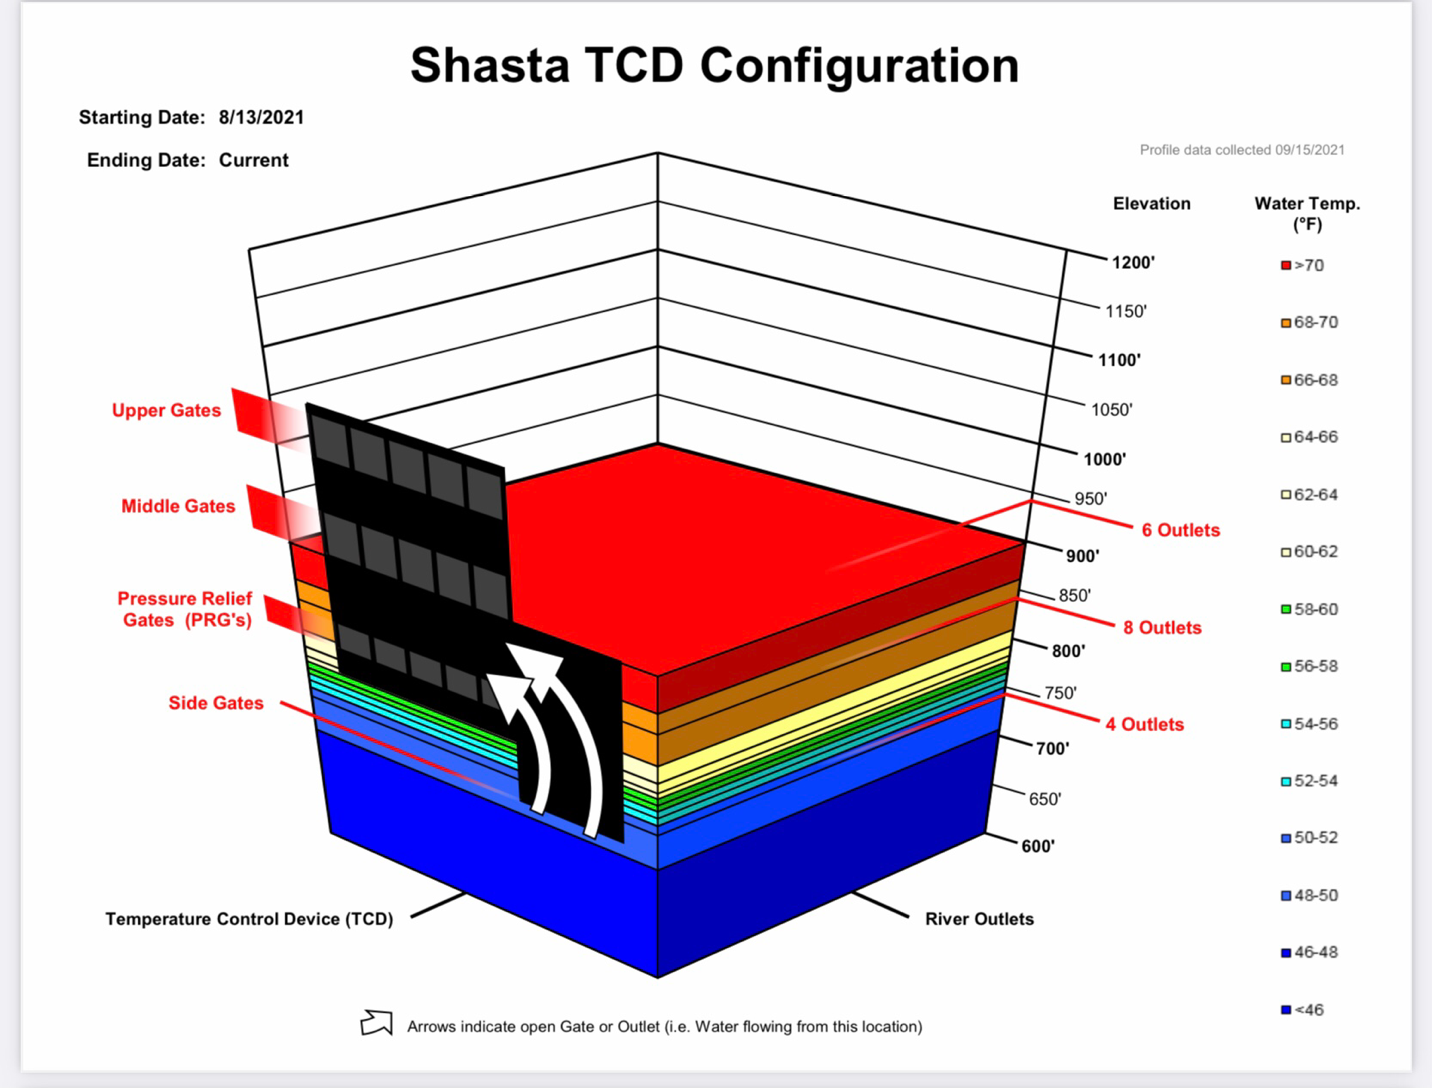
Figure 2. Shasta Reservoir water temperature profile and TCD intake operation configuration at end of August 2021.

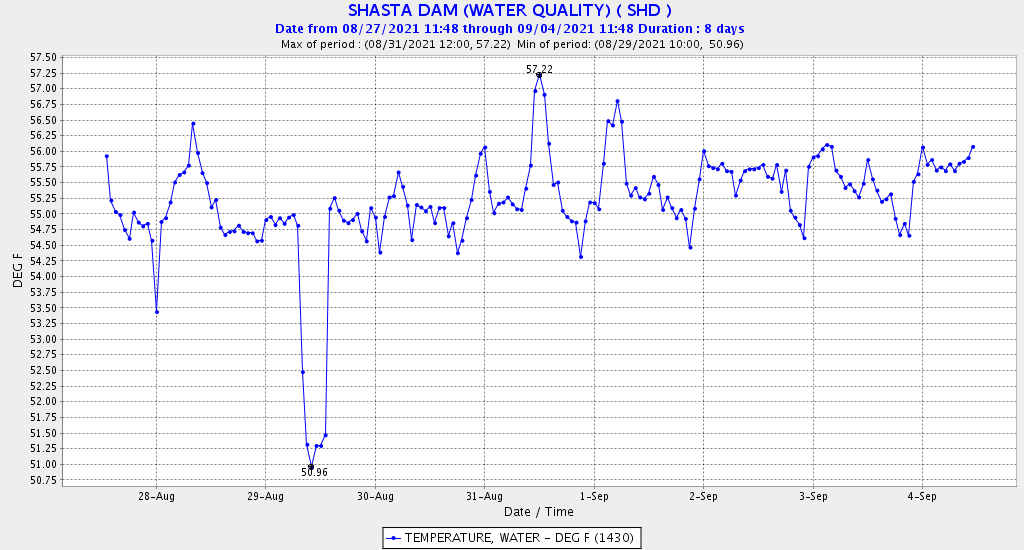
Figure 3. Water temperature of Shasta Dam releases 8/27-9/4 2021. Note August 29 morning power bypass test.

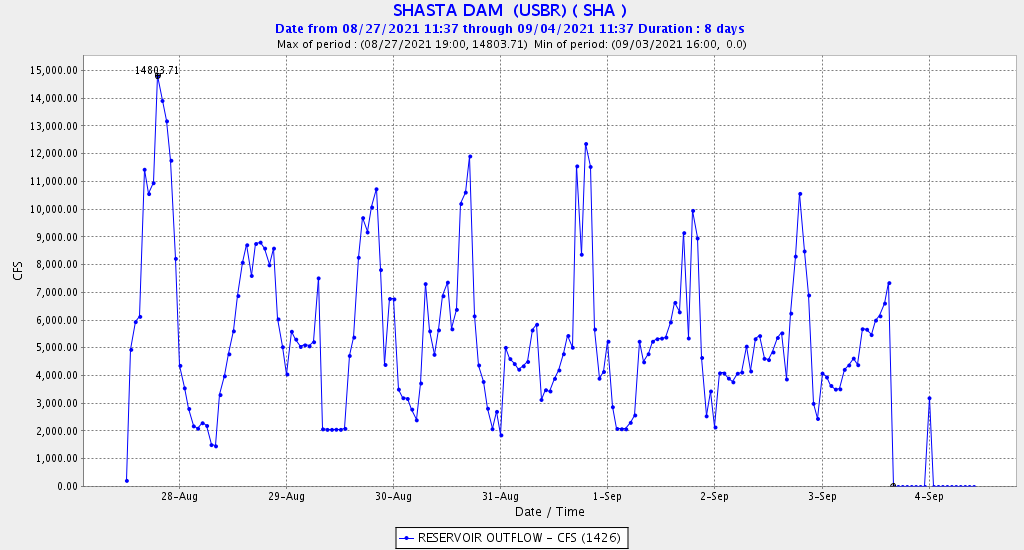
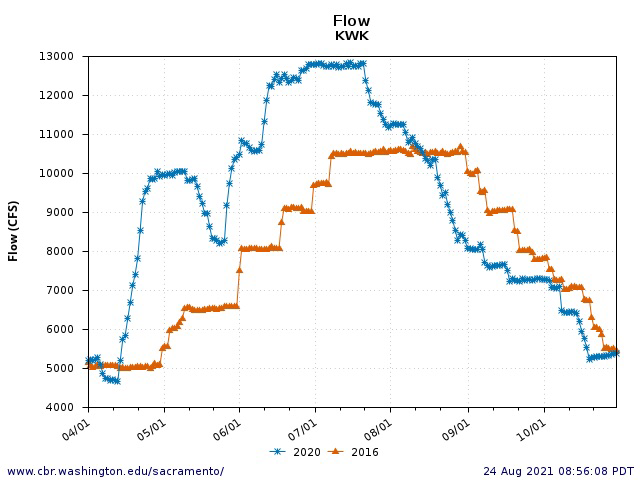
Figure 4. Flow from Shasta Dam August 27 – September 4, 2021.

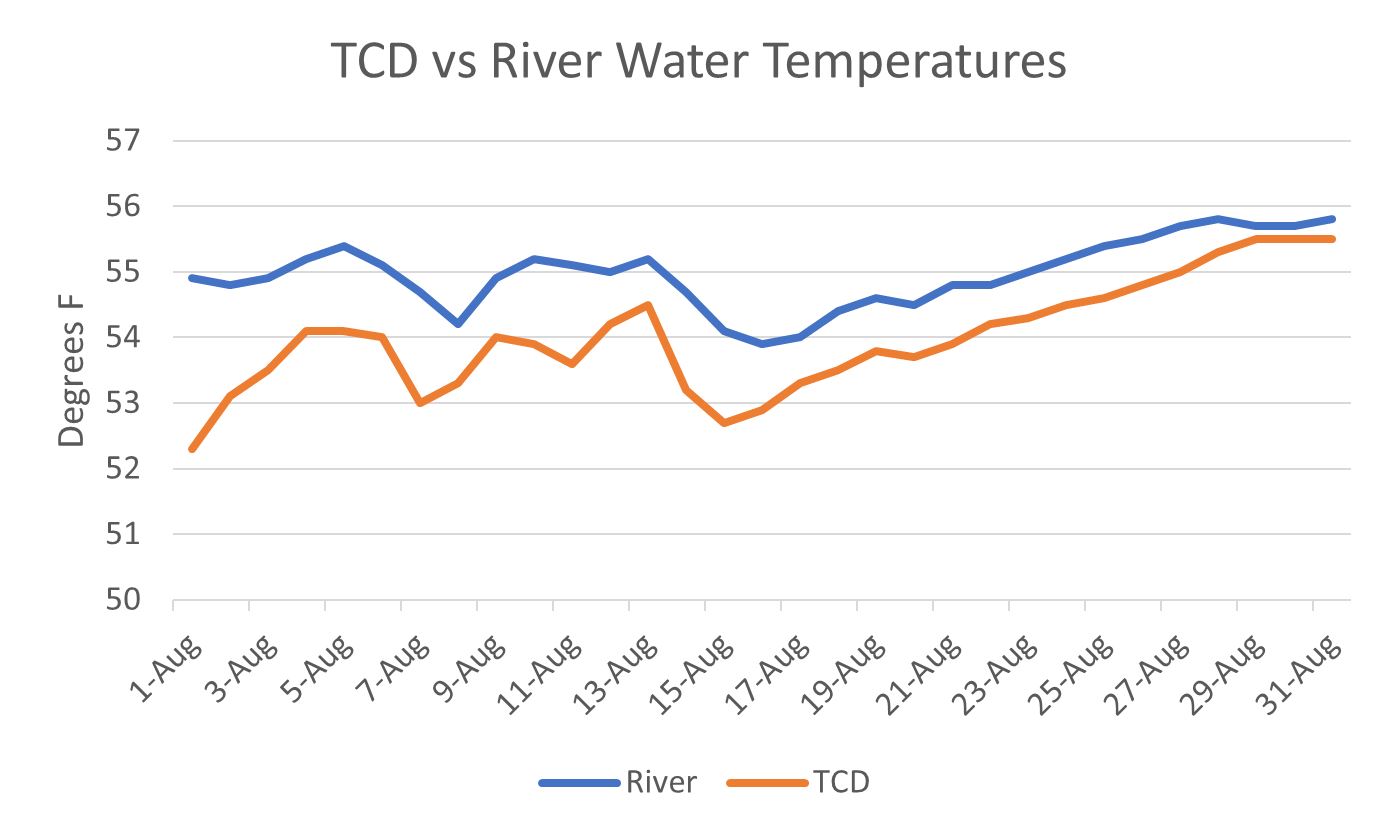
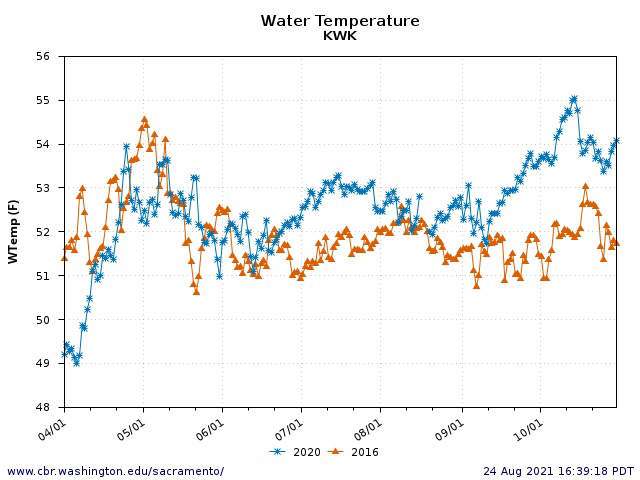
Figure 5. Comparison of daily average water temperatures of Shasta and Keswick Dam releases in August 2021. Most of the difference is caused by warm water releases from Whiskeytown Reservoir (Trinity water) via Spring Creek power to Keswick Reservoir. Note the apparent small effect of August 29 power-bypass test on both river and TCD water temperature: water temperature leveled off rather continuing upward trend over previous 12 days.

  1. Spring Creek Powerhouse temperature had steadily increased to 57º by July 15, when the CDEC gage stopped reporting data.  The August Addendum says that Reclamation plans to reduce by half the Spring Creek Powerhouses releases it predicted in it July Drought update; Reclamation should finish the job and shut it down completely until the water is sufficiently cool.

A Tale of Two Below-Normal Water Years – 2016 and 2020 More Shasta Reservoir Solutions to Save Salmon

Water years 2016 and 2020 were below-normal water years in the Central Valley. Water year 2016 followed three critically dry, drought years, whereas 2020 followed two wet years (2017 and 2019) and one normal (2018) year. So one might assume that 2020 would have been better for Sacramento River salmon than 2016. But it ain’t so – because two different federal administrations were managing Shasta operations. The Trump administration’s policy to “maximize deliveries” of water that began in 2020 had consequences that turned deadly for salmon in critically dry 2021.

First and foremost, Shasta Reservoir storage in 2016 was surprisingly about 500,000 acre-feet or more higher than it was in 2020 after the first of April (Figure 1). Although water year 2020 started out nearly 2 million acre-feet (MAF) higher after a wet year, Shasta storage rose sharply in 2016, nearly filling (4.6 MAF capacity) with winter rain. But the real question is why reservoir storage did not recover in spring 2020. The reason is simply that in 2020, high spring and early summer reservoir releases for water deliveries released water from Shasta almost as fast as it was coming in (Figure 2). If in mid-March, when the reservoir storage was at 3.5 MAF in both years, similar storage-release constraints were in place in 2020 as in 2016, then 2020 would have ended the summer about 500,000 acre-feet higher than it did, near the 2016 storage level (Figure 3).

As a consequence of the storage difference and summer reservoir management, water temperatures downstream of Shasta Reservoir were significantly higher in 2020 than they were in 2016 (Figures 4 and 5). One reason for this was a much reduced volume of the Shasta Reservoir cold-water pool in 2020 compared to 2016 (Figure 6).

In conclusion, the Bureau of Reclamation managed water for winter-run salmon in normal water year 2016 much better than it did in normal water year 2020. Knowing the reservoir would likely not fill in 2020, Reclamation should have deployed a more conservative spring and summer release pattern, similar to what it did in 2016, to sustain cold-water releases from the reservoir through the summer and fall.

Figure 1. Shasta Reservoir water storage (AF) in 2016 and 2020.

Figure 2. Keswick Reservoir to the lower Sacramento River from April-October in 2016 and 2020.

Figure 3. Shasta Reservoir storage in 2016 and 2020 along with author-calculated adjusted release for 2020 if flow release pattern in 2016 (Figure 2) had been employed.

Figure 4. Water temperature below Shasta Dam April-October 2016 and 2020.

 Figure 5. Water temperature below Keswick Dam April-October 2016 and 2020. Note target safe water temperature for salmon spawning and egg incubation is 53ºF.

Figure 5. Water temperature below Keswick Dam April-October 2016 and 2020. Note target safe water temperature for salmon spawning and egg incubation is 53ºF.

Figure 6. Coldwater pool volume (TAF) in Shasta Reservoir in 2016 and 2020, and other years.

Classification of Water Year Types

At the 2021 Bay-Delta Science Conference, Department of Water Resources (DWR) engineers discussed the results of their modeling study on classification of Central Valley water-year types that define operations of state and federal water projects.1 The study recognized the need to adjust the rules because of climate change and associated changes in human and environmental demands on water supplies. “Iterations of the model become a water system stress test under different incremental changes of climate.”

The study focused on the classification of water years for the Sacramento and San Joaquin rivers: currently, these are critically dry, dry, below normal, above normal, and wet. The study suggests there is likely to be a higher frequency of critical and below normal years, and a lower frequency of wet and above normal years, because of rising temperatures. The study suggests adjusting the year type criteria downward to increase the frequency of drier year-type designations. Sensitive parameters in the model included Delta inflows and outflows, Delta exports, and Delta salinity.

The study suggested that changing the classification criteria would generally result in higher Delta inflows and outflows, which would help reduce the salinity effects of sea-level rise due to climate change. The theory was evidently that DWR and the Bureau of Reclamation set export levels lower in drier water-year types. If DWR and Reclamation actually set lower exports and north-of-Delta deliveries in drier water years, there could actually be some benefit. But right now, most of those levels are discretionary and not enforceable criteria. And under existing rules, Delta inflow and outflow requirements also become progressively lower with drier water year types.

The logic behind supposed aquatic benefits to increasing the relative frequency of drier water year types is tortuous at best. The real outcomes would depend on the implementation of the other variables that are the legs of the water management stool: flow, storage, and deliveries. Those outcomes will be measured indirectly by such metrics as water temperature and salinity, and more directly by the quality of the fisheries produced.

The State Water Board’s update of the Bay-Delta Water Quality Control Plan proposes to severely limit reliance on water year types. On the other hand, the Bay-Delta Plan to date has not addressed the specifics of droughts and dry year sequences. Whether called water year types or something different, managing water is dependent on annual and inter-annual conditions.

One example of a different approach to watershed-specific water-year-type criteria is modification of reservoir storage requirements according to various year-type conditions. In a recent post, I suggested a sliding scale of minimum end-of-year (end of November or December) storage criteria for Folsom Reservoir on the American River (Figure 1). Similar criteria are relevant to Oroville Reservoir on the Feather River (Figure 2). Maintaining minimum reservoir storage criteria would go a long way toward protecting all beneficial uses. To date, both DWR and Reclamation have doggedly resisted such criteria.

Figure 1. Folsom Reservoir daily-average storage (acre-feet) 2000-2021. Recommended minimum storage criteria (end of November) are shown by circles: blue for high-storage years; light blue for intermediate-storage years; yellow for low-storage years. Red arrows are years that grossly exceeded such criteria.

Figure 2. Oroville Reservoir daily-average storage (acre-feet) 2012-2021. Recommended minimum storage criteria for end of November are shown by red circles.