Summer Reservoir Releases – Lessons Learned #2

Following an introductory post, this is the third post in a series on the lessons learned by the National Marine Fisheries Service (NMFS) from the 2013-2015 drought that devastated Sacramento River salmon populations.  This post addresses Lesson #2.

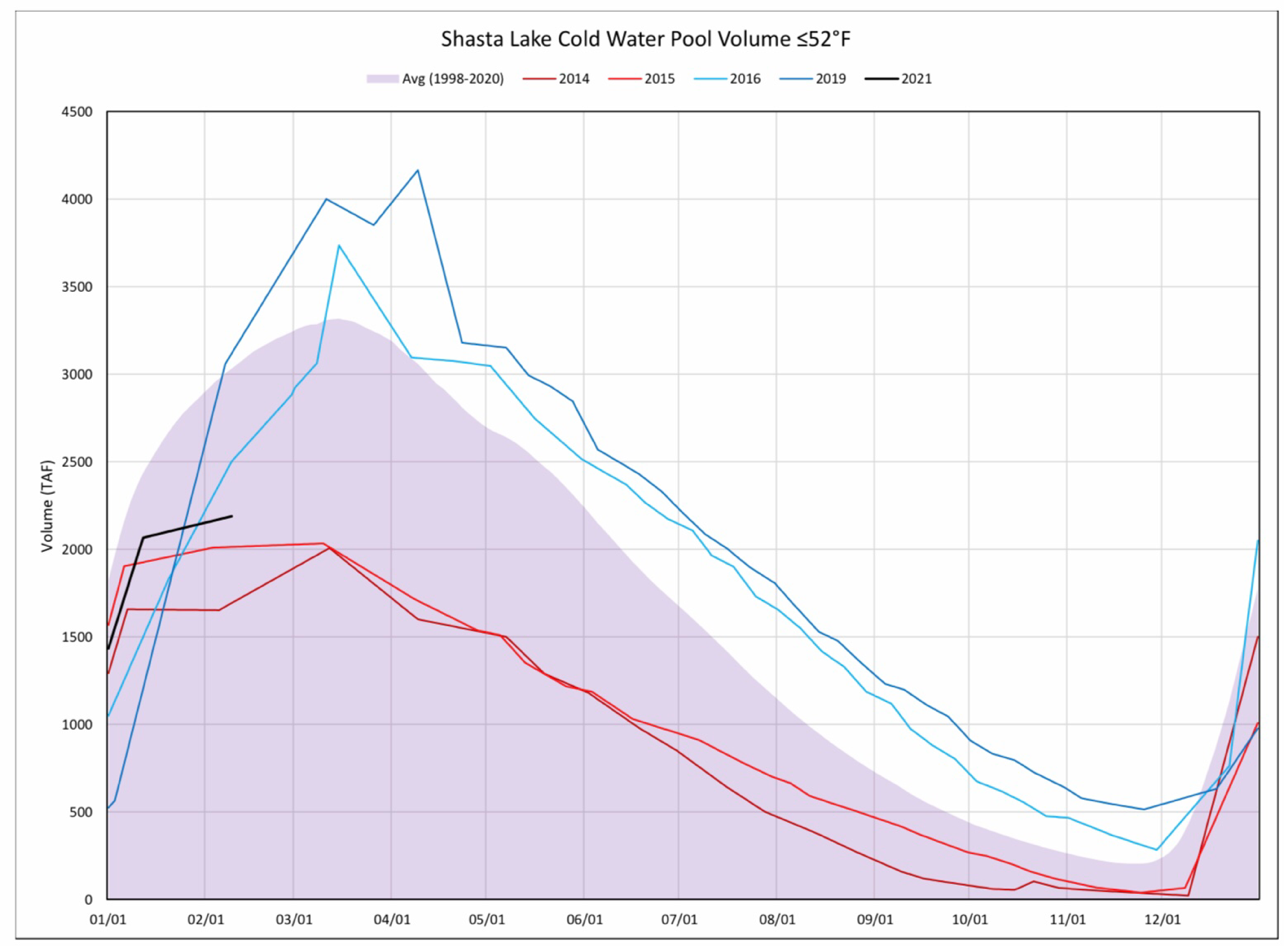
In 2014 and nearly again in 2015, Reclamation ran out of cold water in Lake Shasta available for release to maintain downstream salmon in late summer and early fall (Figure 1).  Cutting late spring and early summer water deliveries to contractors from reservoir releases in most cases would preserve cold-water pool through to fall.  In critical drought years 2014 and 2015, cold-water-pool volume on June 1 was about 1.2 million acre-ft.  In wetter 2016 and 2019 cold-water-pool volume on June 1 was more than double that.

In late summer 2014, the available cold-water-pool ran out.  Lower gates of the reservoir outlet tower began taking warmer surface water (Figures 2 and 3).  Even the lowest “river outlets” water was over 60oF by early October.  Water releases in June and July 2014 were near 10,000 cfs (Figure 4).  That level of release was already being capped from the wet year level of 15,000 cfs.  Dropping to 8,000 cfs could have saved another 4,000 acre-ft per day, or about 240,000 acre-ft, which may have sustained cold water releases through early October.

In June-July 2015, releases were dropped to near 7,000 cfs (Figure 4), but even then, water temperature in release water had to be compromised (Figure 5) to sustain some cold water into the fall (Figure 6).  Subsequently, research indicated that the 2015 water temperature limit of 56oF for release water proved insufficient, and that a 53oF limit was necessary to protect eggs and embryo of salmon.  Water temperatures were sustained near or below 53oF from 2016 to 2020 (Figure 6) by limiting June-July releases (see Figure 4).

In summary, capping releases in June-July, in combination with selectively drawing release water from reservoir water layers, was the normal procedure in preserving cold-water-pool release capability through the summer.  However, despite highly restricted releases in critical drought years 2014 and 2015, the cold water ran out and salmon reproduction severely suffered.  The lessons learned were that Reclamation’s temperature target for release water was too high, and that Reclamation’s predictive ability for preserving cold-water releases through the summer was ineffective and could not be trusted.

Figure 1. Cold-water pool volume in Shasta Reservoir in 2014, 2015, 2016, 2019, and 2021 with 1998-2020 average. Source: https://www.usbr.gov/mp/cvo/.

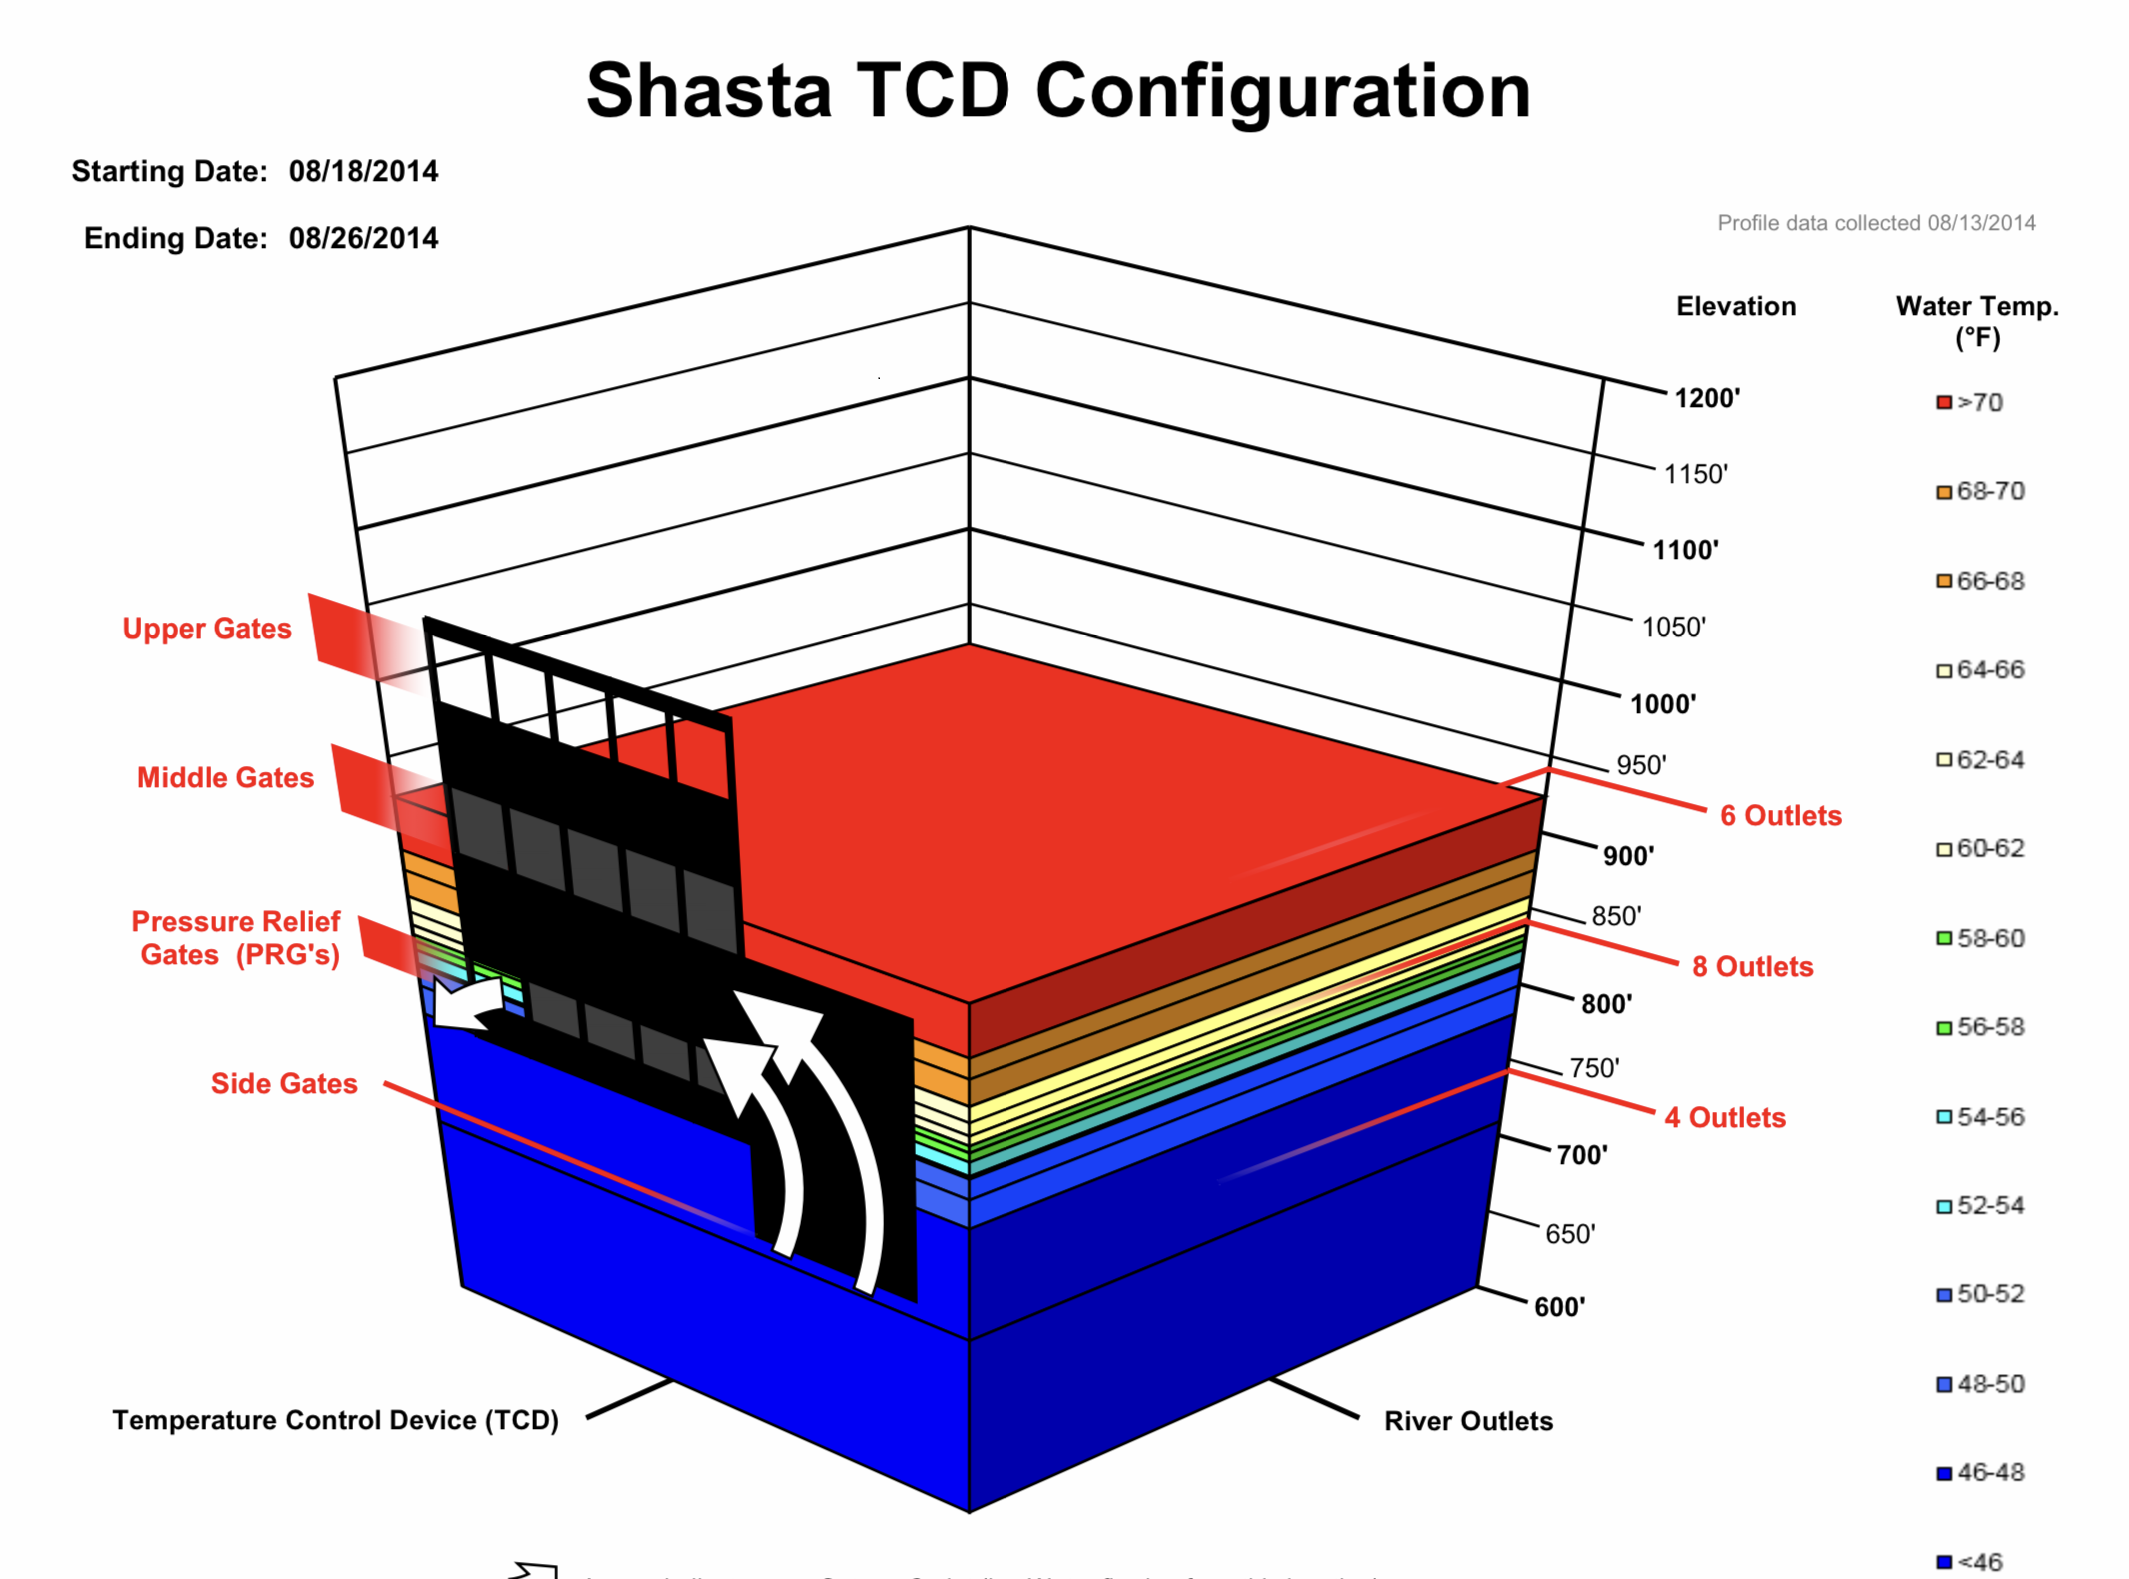
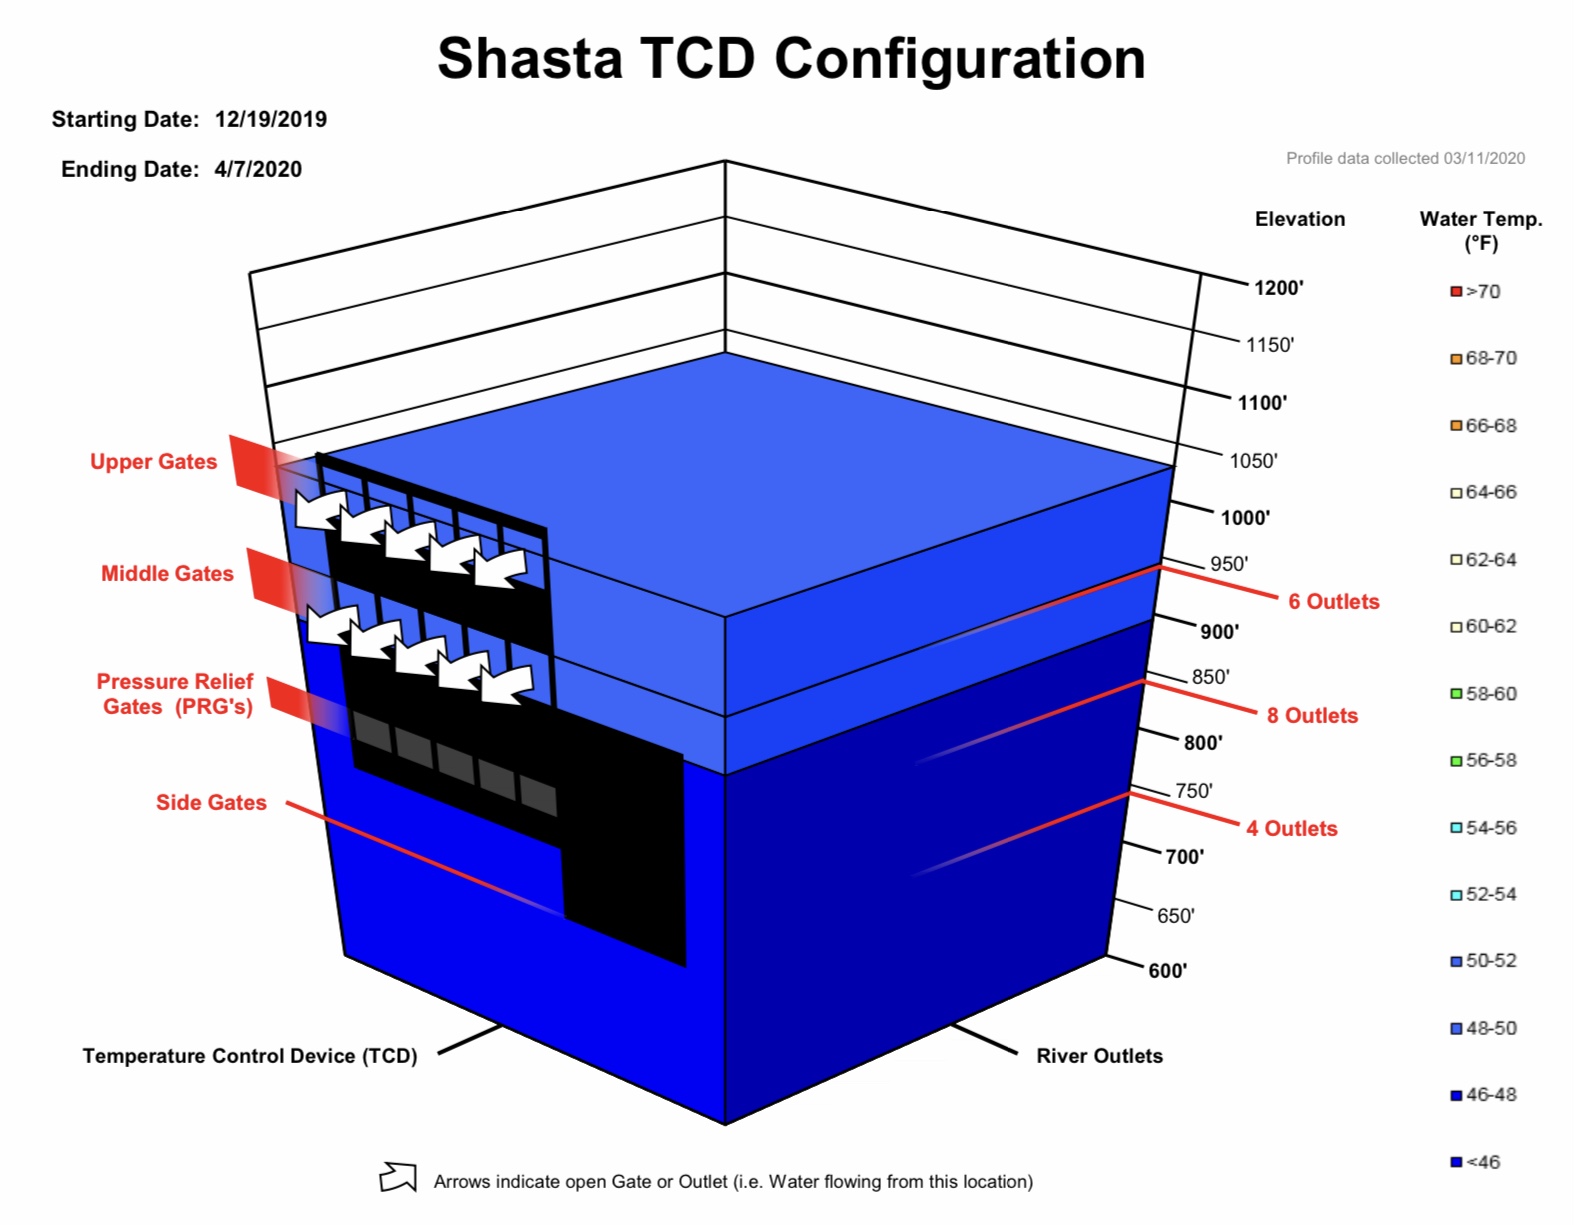
Figure 2. Water temperature profile in Shasta Reservoir and outlet tower Temperature Control Device configuration in August 2014.

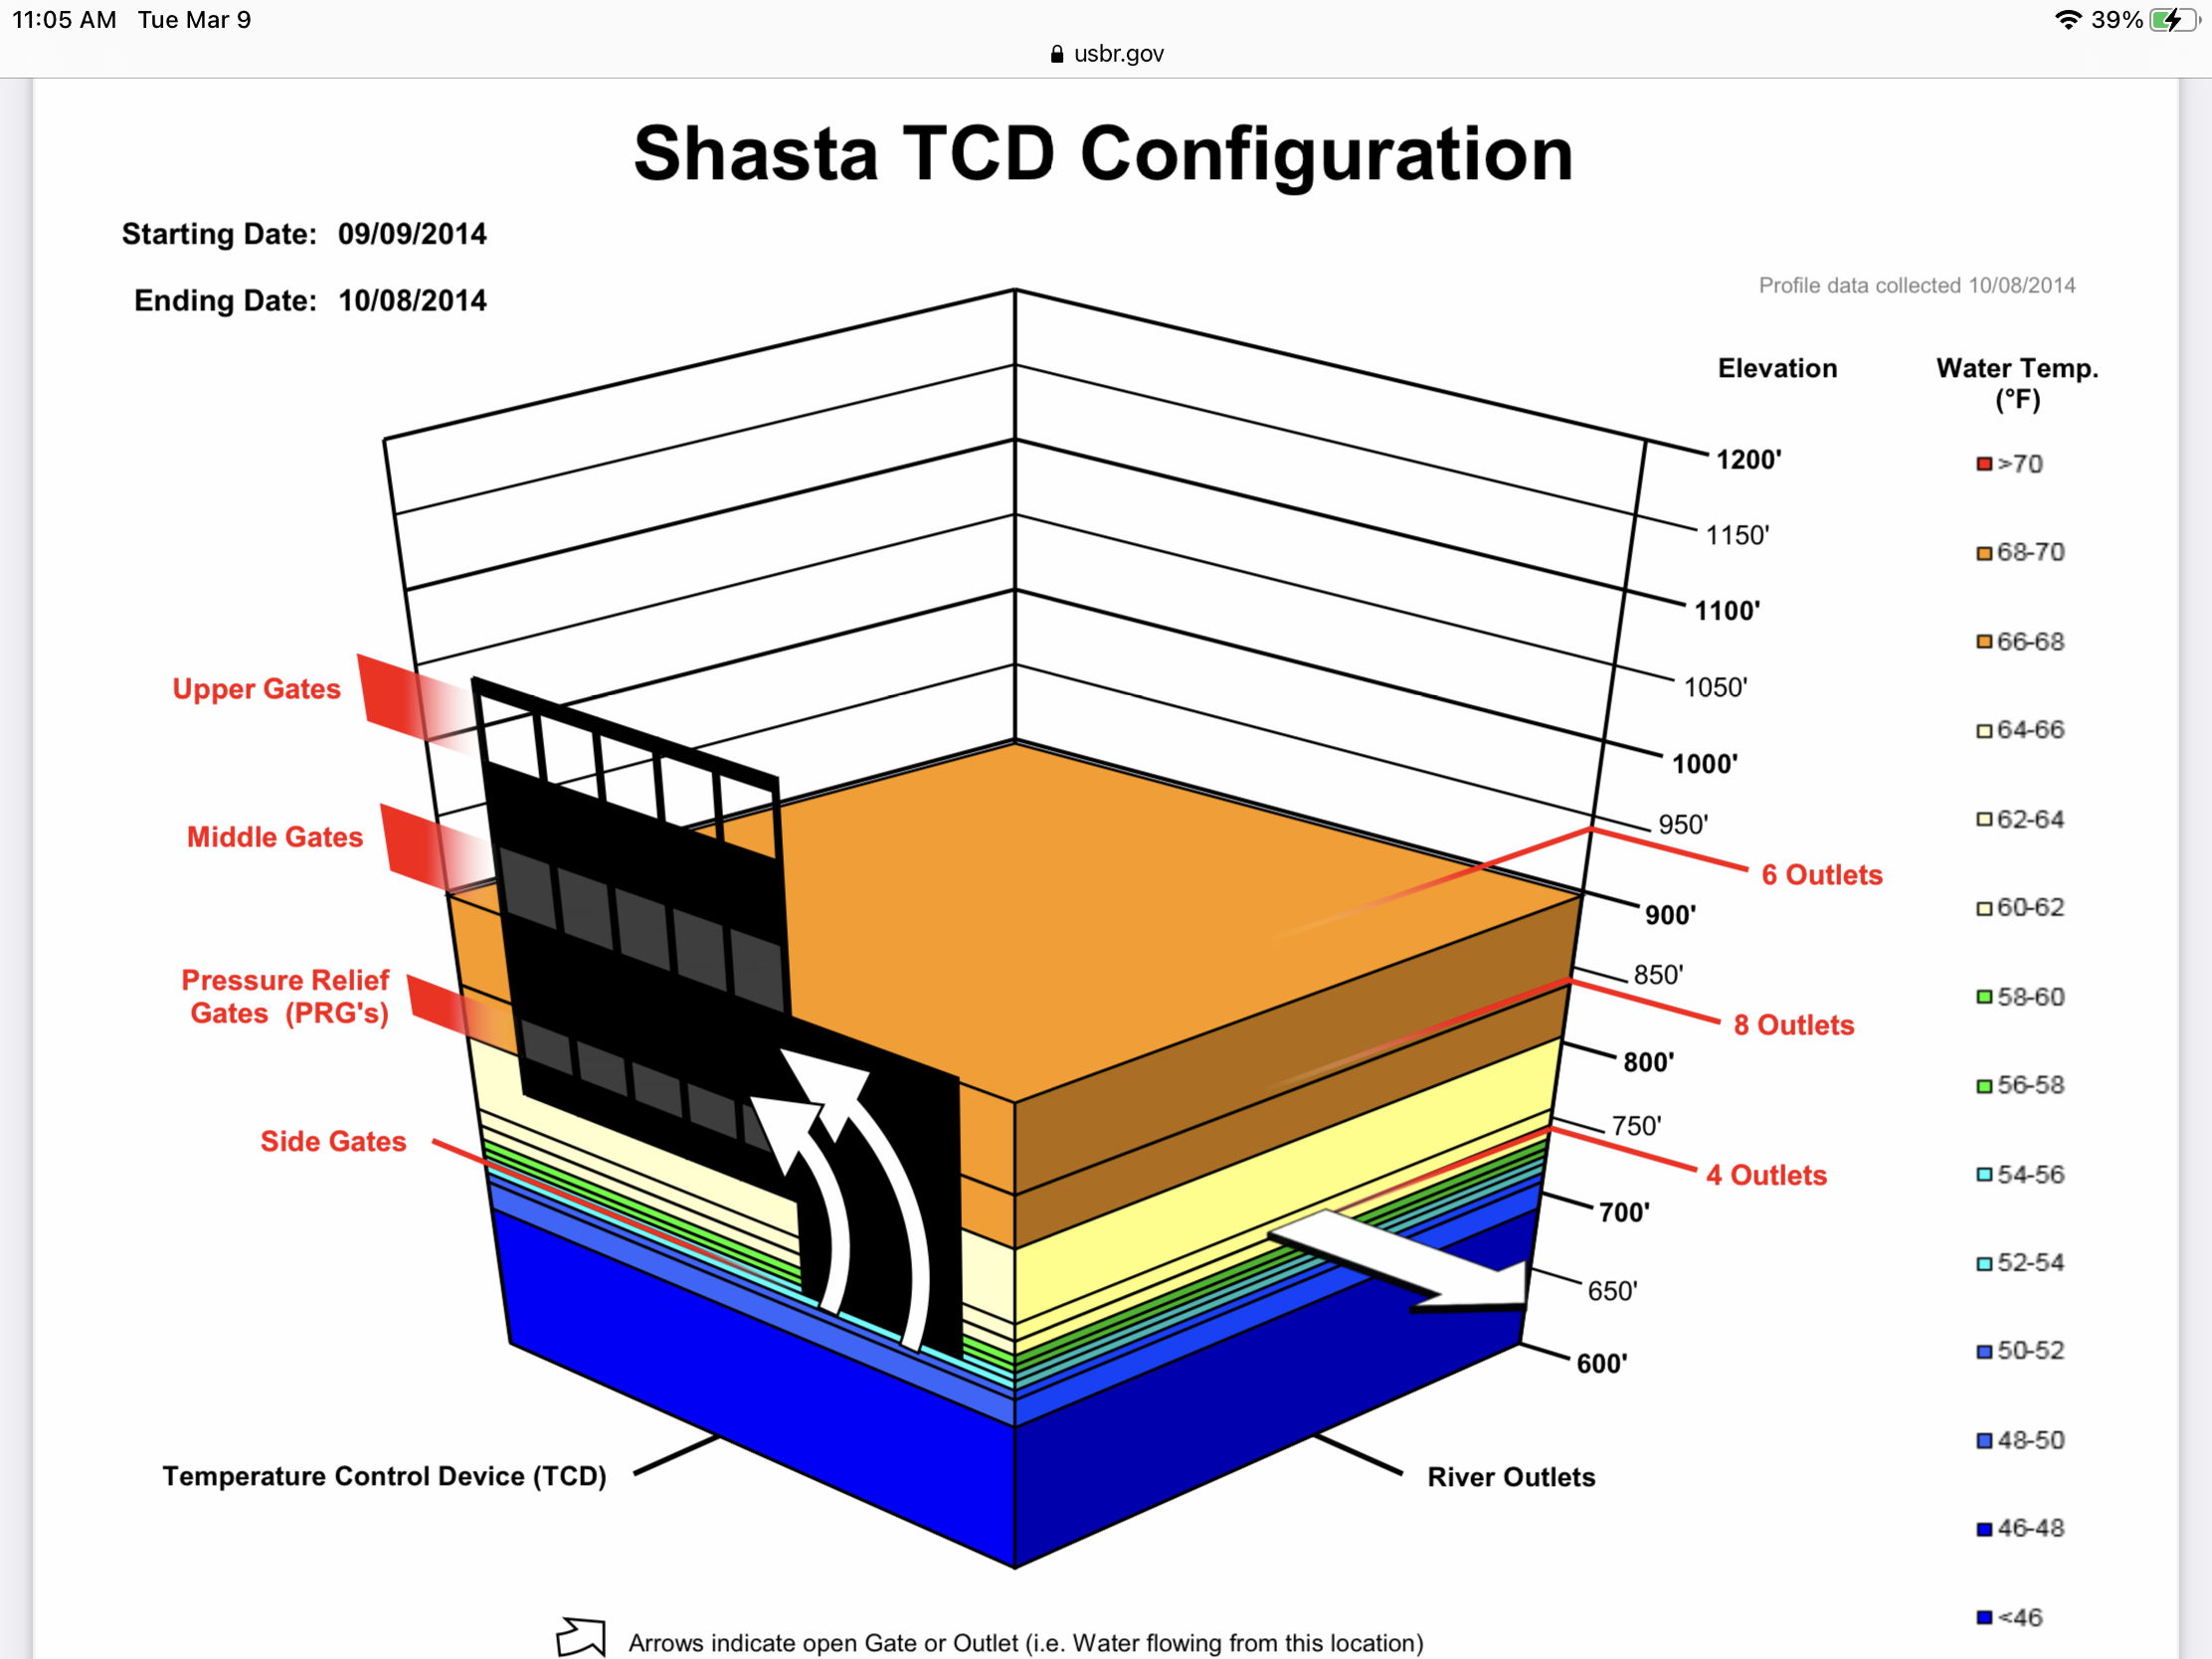
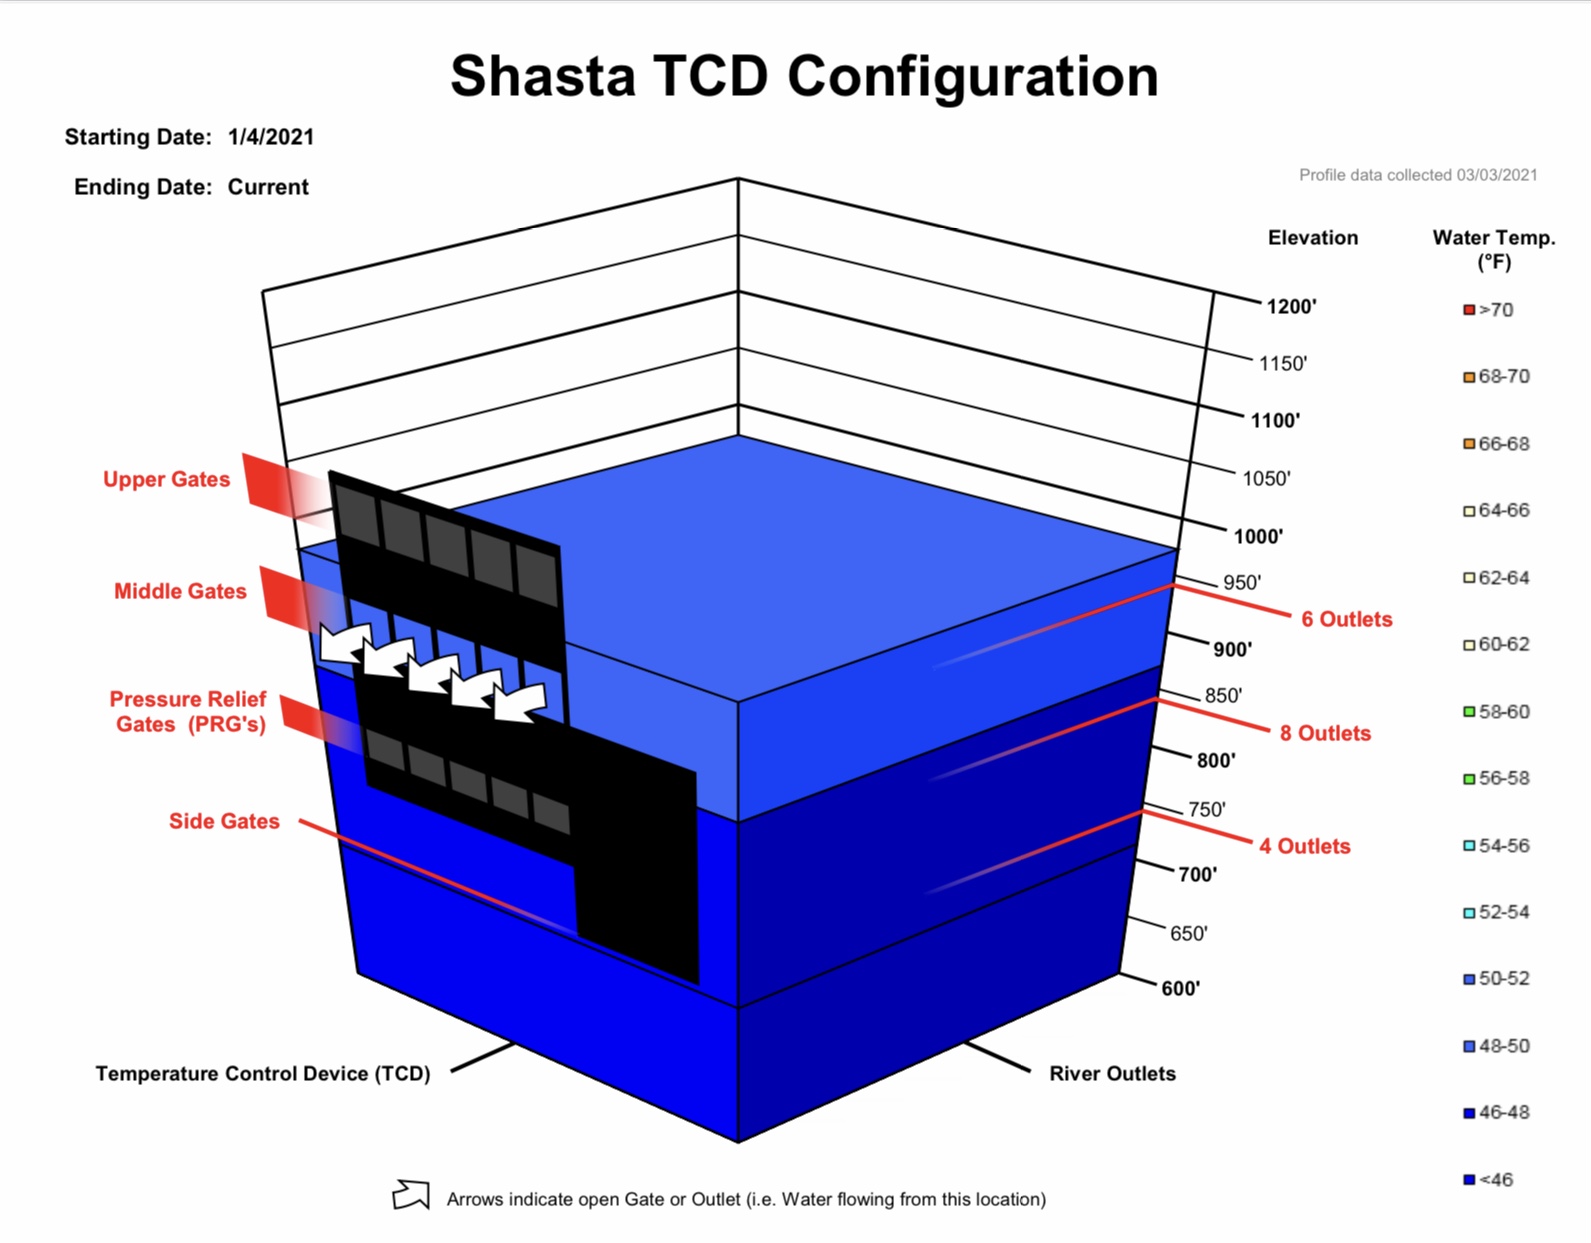
Figure 3. Water temperature profile in Shasta Reservoir and outlet tower Temperature Control Device configuration in October 2014.

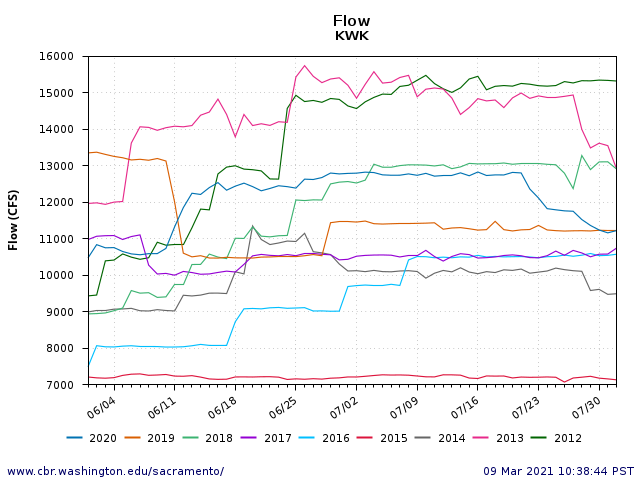
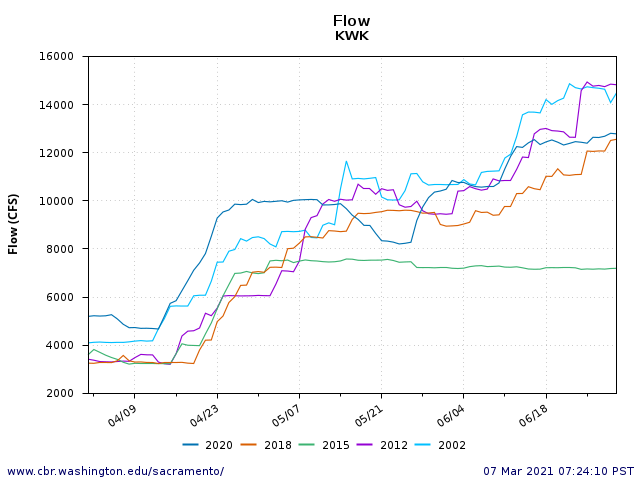
Figure 4. Shasta/Keswick reservoir water release rate in June-July 2012-2020.

Figure 5. Water temperature profile in Shasta Reservoir and outlet tower Temperature Control Device configuration in August 2015. Note some water was being released from middle gates to preserve cold water pool supply.

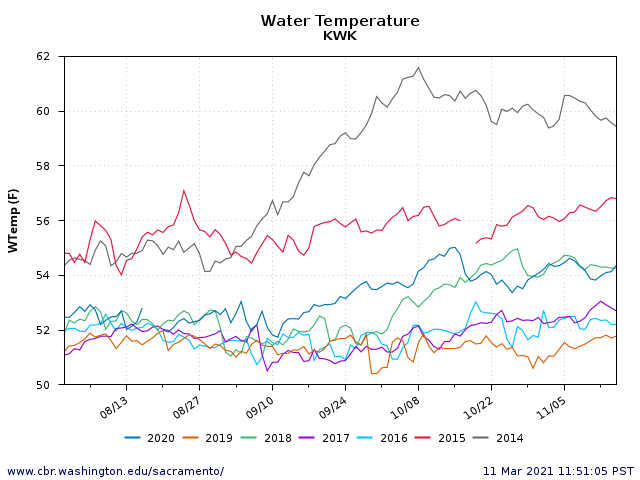
Figure 6. Water temperature below Keswick Dam Aug-Nov 2014-2020. Note higher water temperatures in 2014 and 2015.


Sacramento River Fall Run Chinook Salmon – 2020 Update

When I last updated the status of the mainstem Sacramento River fall-run salmon below Shasta in a July 2019 post, I expected 2019 in-river escapement to improve from the 2017 record low run (Figure 1). The record low 2017 run had been the consequence of extreme drought conditions during 2015, the third year of a major drought. In contrast, the 2019 run was largely the progeny of water year 2017, a wet year with good spawning, rearing, and migrating conditions for the 2016 salmon brood year. A potential negative ingredient to the 2019 escapement was the poor number of spawners returning in the fall of 2016 that spawned brood year 2016 (Figure 2). Likewise, 2020 escapement ingredients included the record low number of spawners in 2017, as well as poor rearing and migrating conditions in winter-spring of below-normal water year 2018.

In an April 2017 post, I presented the status of the overall fall-run salmon for the Sacramento River basin that included escapement to the mainstem, tributaries, and hatcheries. Updates of those numbers are shown in Figure 3. The total river escapement, like the upper Sacramento in-river escapement, was depressed from 2015 through 2018. Escapement in 2019 improved, but it declined again in 2020. The 2019 and 2020 Sacramento salmon runs were improved over the 2015-2018 drought-influenced runs, but were lower that returns from other wetter years, because their parental spawner numbers were depressed in 2016 and 2017 (Figure 4). Note in Figure 4 the 2019 run is shown by blue-17 to represent the wet year rearing and emigrating conditions for the 2019 run. The figure depicts the positive spawner-recruit relationship and the strong water-year type influence from two years earlier on the adult escapement (run size).

The prognosis for the 2021 and future runs is poor because of the low number of spawners in recent years and drier water year winter conditions in 2018, 2020, and 2021. Restrictions on the 2021 fishery are likely1 despite wet year 2019 conditions. Hopefully, the 2021 run will show improvement with the restricted fishery and better production from wet year 2019.

Figure 1. Fall-run Chinook salmon escapement (run size) in the mainstem in-river Sacramento River 1978-2019. Source: https://nrm.dfg.ca.gov/FileHandler.ashx?DocumentID=84381

Figure 2. Spawner-Recruit relationship for upper Sacramento River mainstem fall run Chinook salmon. Number is recruitment year (escapement). Spawners are recruits from three years prior. Numbers are log minus 3 transformed. Red is for dry water year two years prior during rearing and emigration. Blue is for wet year. Green is for normal water year. For example: red 17 represents 2017 run that reared in drought year 2015, with spawners (parents) being 2014 run green number.

Figure 4. Sacramento River spawners versus recruits three years later from escapement estimates (Log10X – 4 transformed). Note that some variability likely occurs from a low number of 2- and 4-year-old spawners in the escapement estimates. Numbers are sum of hatchery, mainstem, and tributary estimates from CDFW GrandTab database. Number shown is rearing year (winter-spring) following fall spawning year. For example: “88” represents rearing year for 1987 spawning or brood year. These fish returned to spawn (recruits) in 1990. The red “07” represents the record low run in fall 2009. Red years are critical or dry water years. Blue years are wet water years. Green years are normal water years. Red circles represent adult return years being drier water years. Blue circles represent return years being wet water years. Green circles represent return years being normal water years. Orange square denotes outlier years influenced poor ocean conditions, floods, or hatchery management factors. Note that runs from wet years are up to ten times higher (1 log number) than the drought influenced years, particularly 87-90, 07-08, and 12-15.


Lake Shasta and Sacramento River Operations: Lessons Learned – #1, Part 1

Following an introductory post, this is the first post in a series on the lessons learned by the National Marine Fisheries Service (NMFS) from the 2013-2015 drought that devastated Sacramento River salmon populations.  This post addresses Lesson #1 and how it was not applied in 2020.Water and fisheries managers have known for many years that both the Lake Shasta storage level on April 1 and spring releases from Shasta determine how much cold water will be available in the lower Sacramento River through the summer. The Central Valley Project’s (CVP) decades-old state-water-right permits require that the Project maintain cold-water releases through the summer and fall. The Bureau of Reclamation’s CVP water managers know that their contractors need to make planting decisions in the spring based on available and allocated water supply. Finally, CVP water managers know that water temperature management is necessary in the spring as a condition of water right permits and state water quality standards.

The cold-water storage in Lake Shasta going into the April-September irrigation season is in part a consequence of carryover storage from the previous September and of winter reservoir inflows and releases. After April 1, new inflows from spring rainfall and snowmelt, and outflows from irrigation releases, further change the amount of cold-water storage available for salmon into the fall. Spring releases are varyingly limited in drier, low-storage years, depending on the willingness of irrigators to defer planting and of CVP managers to limit allocations. In past drought years, some contractors have voluntarily delayed spring planting to save cold-water storage.

Based on the low supply of cold water on March 1, 2021 (Figure 1), management must be conservative and reactive to changing conditions. In March 2020, the cold-water pool was relatively high (Figure 2) after wet year 2019. In March 2021, the cold-water pool (Figure 3) is slightly less than it was in March 2020, a below normal water year.

Controversy surrounded Reclamation’s 2020 Temperature Management Plan (TMP; draft presented April 23, 2020; final presented May 20, 2020). The State Water Resources Control Board (State Board) refused to accept and objected to final TMP in a June 1, 2020 letter. Reclamation’s release pattern in spring 2020, when compared to prior years, clearly showed that Reclamation did not heed the “lesson learned:” 2020 Shasta Reservoir releases in spring were actually significantly higher than normal (Figure 4).

Reclamation never resolved the issues that the State Board raised in its June 1, 2020 letter. The State Board largely dropped the immediate issues, since it was too late to improve the cold-water pool after the high spring releases from Shasta. How developments between Reclamation and the State Board over the summer of 2020 affect decision making in the spring of 2021 will be the subject of the next post.

In the summer and fall of 2020, the State Board apparently decided to look forward to 2021. However, there has been no apparent positive movement toward better decision making for 2021 either. The lesson learned has not changed: temperature management plans need to be finalized in early April.

Here we are at the beginning of March in 2021, a drier than normal water year to date. Reclamation has allocated the Sacramento River Settlement (SRS) contractors 75% of their normal supply.1 Reclamation has not released even a preliminary Sacramento River Temperature Management Plan. How much water will Reclamation release from Shasta in April and May? What will likely happen this summer and fall? Will the Bureau of Reclamation under the Biden Administration cooperate with the State Board and issue an early TMP? Will the State Board enforce its requirements, or will it once again back down?

Stay tuned.

Figure 1. Cold-water pool storage in Shasta Reservoir on the Sacramento River as of March 1, 2021, along with patterns in recent years and long-term average. Of note is that the 2021 level is only slightly above that of critical drought years 2014 and 2015, whose limited supply by fall led to very poor survival of winter-run salmon.

Figure 2. Shasta Lake temperature profile and configuration of Temperature Control Device (TCD) release points in March 2020.

Figure 3. Shasta Lake temperature profile and configuration of Temperature Control Device (TCD) release points in March 2021.

Figure 4. Shasta/Keswick dam releases to the upper Sacramento River in spring of five examples of drier than normal years. Note the higher releases in below-normal water year 2020.

Lessons Learned from the 2013-2015 Drought

After the 2013-2015 drought, the National Marine Fisheries Service (NMFS) took a deep dive into “lessons learned” to help guide future regulatory permit processes, especially those that address the effects of future Shasta Reservoir operations on endangered winter-run Chinook salmon.  The drought proved to be a comprehensive adaptive management experiment on the effects of the US Bureau of Reclamation’s (Reclamation) operation of its Shasta-Trinity Division on Sacramento River and Bay-Delta fish populations.  Though the specific lessons learned focused primarily on one listed species, winter-run salmon, the effects manifested in different ways on other listed or special-status native fish species in the Central Valley and Klamath-Trinity rivers, including other runs of salmon, steelhead, sturgeon, and smelt, and even orca in the ocean.

In upcoming posts, I will discuss the ramifications of the “lessons” and their relevance to fish populations and water supply issues.  The focus will be on Sacramento Valley salmon and how Reclamation can adjust the operations of the Shasta-Trinity Division to help salmon and other fish populations recover.

March 2021 is a critical stage of decision making in managing resource allocation during what could be another dry year like water year 2020.  Reservoir storage levels are low (Figures 1-3), and Shasta’s cold-water supply (Figure 4) is low after a dry year.  Water year 2021 is dry so far.  The lessons learned need to be applied to avoid the fisheries disasters of the last drought.  Will the warnings and lessons be heeded?

Figure 1. Shasta Reservoir water storage for water years 2018-2021. Note reservoir refilled in wet year 2019 but not in below normal 2020, and storage enters 2021 at a low level.

Figure 2. Folsom Reservoir water storage for water years 2018-2021. Note storage entered water years 2020 and 2021 at lower levels, which does not bode well if water year 2021 is dry.

Figure 3. Oroville Reservoir water storage for water years 2018-2021. Note reservoir storage was poor after wet water year 2017 because of 2017 spillway failure.

Figure 4. Shasta Reservoir cold-water pool supply in calendar years 2014-16, 19, and 21. Note 2021 (black line) is beginning to trend toward drier year levels.

Scott River Coho 2020 Run Improves

I last updated the status of Coho salmon in the Scott River, a major Klamath River tributary in northern California east of Yreka (Figures 1 and 2), in a January 2020 post. At that time, I lamented on the decline of the strongest distinct population subgroup, 2013-2016-2019, exemplified by the weak run in 2016 caused by the 2013-2016 drought. In this post, I am happy to report on the strong 2020 run and the surprise improvement of the 2014-2017-2020 subgroup (Figure 3).

The improvement in the 2020 run, despite a sparse spawning run in late-fall 2017, is likely a consequence of good water conditions in early water year 2018 (Oct 2017-Sep 2018, Figure 4) after wet water year 2017. The run had good access to spawning habitat and early rearing conditions from fall 2017 through the spring of 2018. The young coho were sustained though the dry summer of 2018 in spring-fed reaches of the upper river and its tributaries. Spring-fed habitats likely benefitted from the abundant winter 2017 snowpack. The Scott watershed had also benefitted from significant restoration of its over-summering habitat over the past decade.1

The yearlings of brood year 2017 then had good wet year emigrating conditions in late fall 2018 and early winter 2019 (Figures 4 and 5). There were multiple winter flow pulses to help the yearling coho smolts emigrate from Scott Valley and on down the Klamath to the ocean.

In summary, the spawning run in fall 2020 (from brood year 2017) was exceptional, benefitting from conditions that were a consequence of wet years 2017 and 2019. Over-summering survival in dry year 2018 was likely good because of good spring-fed flows and habitat in the upper watershed, a carryover from the good 2017 snowpack and restoration of beaver-pond habitat by Scott Valley stakeholder groups. This one small success bodes well for recovering other salmon and steelhead populations throughout the Klamath watershed, especially in a future dominated by climate change.2

Figure 1. Klamath River watershed with the Scott River west of Yreka, CA. (Source DOI.)

Figure 2. Google Earth view of the Scott River watershed with its snow-covered Marble Mtns to the west and the Trinity Alps to the south. Scott Valley, with its green hay fields from Etna to Fort Jones, was once called “beaver valley” due to its abundance of spring-fed beaver ponds and meadow streams ideal for over-summering salmon and steelhead.

Figure 3. Spawner-recruit relationship for Scott River Coho salmon. The number represents recruits (spawner counts) for that year versus spawners counts from three years earlier. For example: “13” represents spawner counts (recruits) in fall 2013 versus spawner numbers three years earlier in 2010. Number color represents different spawner subgroups (blue=subgroup 10-13-16-19). The Red circle highlights the significant outlier in 2016. The Yellow line is trend-line for years other than 2016 and 2020. Data source: CDFW weir counts.

Figure 4. Scott River streamflow measured downstream of Fort Jones as the river leaves Scott Valley, September 2017 to April 2019. Note the near average wet winters in 2018 and 2019, and dry summer in 2018 typical of the Mediterranean climate of northern California. The drier-than-average summer 2018 is indicative of water use for hay-pasture irrigation.

Figure 5. Klamath River streamflow measured downstream of the mouth of the Scott River, October 2018 to June 2019. Note the near average wet winter-spring with five distinct flow pulses typical of wetter years. of the Mediterranean climate of northern California. The flow pulses helped yearling coho from brood year 2017 emigrate to the ocean. The adults from brood year 2017 returned in late fall of 2020.