A summer pulse flow through the Yolo Bypass via the Colusa Basin Drain (Figure 1) was implemented in September per the Delta Smelt Resilience Strategy’s North Delta Food Web Action (Figure 2). I reviewed the initial application of the action in July 2016, concluding then there was no evidence that the action would meet its overall goals, but that the approach had potential.
The basic concept is this:
– By routing agricultural drain water through Yolo Bypass instead of the Sacramento River, DWR scientists predicted that a flush of plankton-rich water would provide a “seed” for the downstream Delta, enhancing food resources for Smelt. (Note: Historically, summer drain water from Colusa Basin rice fields was discharged into the Sacramento River at Knights Landing.)
– A similar managed flow pulse was generated in July 2016 with the help of Sacramento Valley water users, which helped transport plankton to the Delta. (Note: additional Sacramento River water was diverted near Red Bluff to the Colusa Basin Drain to supplement rice field drainage. There was no evidence that plankton blooms in the Yolo Bypass reach the Delta in meaningful amounts.)
– The action is designed to maximize the environmental benefits of water. Water isn’t “consumed” by the action–it is directed down a different and more productive path to the Delta. (Note: The basic concept is simple. The nutrient-laden drain water stimulates Yolo Bypass productivity, and the added river water flushes it through to the north Delta. Taking some of the Sacramento River at Red Bluff and routing it through the Colusa Basin irrigation and drainage system, then on to the Yolo Bypass tidal channels, should stimulate biological productivity and flush it, along with excess nutrients and organic debris from rice fields into the Delta at the end of the Bypass (Cache Slough – Rio Vista area). The Delta (and smelt) would benefit from the added biological productivity (phyto-zoo plankton) and nutrients (nitrogen, phosphorous, and organic carbon).
Does the concept work, and does it come without complications?
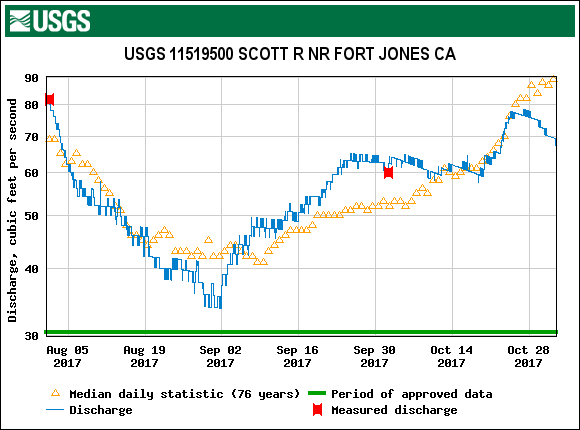
- During implementation in 2018, there was an 60% uptick in aquatic plant productivity in the lower Yolo Bypass (Figure 3).
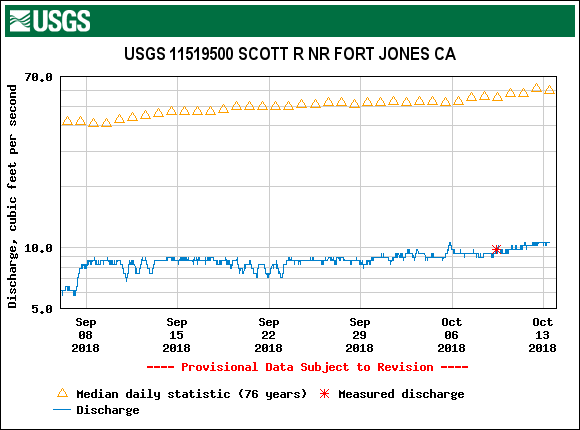
- There was no increase in productivity as of early October in the north Delta at Rio Vista (Figure 4).
- The water routed through the Bypass was initially warm (>70oF, Figure 5), high in salts (Figure 6), lower in turbidity (Figure 7), and low in dissolved oxygen (Figure 8).
- Warm water and the high organic load resulted in poor dissolved oxygen levels (3-5 milligrams-per-liter) that violate state standards and are potentially lethal to salmon migrating through the Bypass.
On a positive note, routing drain water to the Bypass does keep the poor quality drain water out of the Sacramento River below Knights Landing.
In sum, the benefits of the action remain questionable. Waiting to conduct the action until fall when waters are cooler could alleviate high water temperatures and low dissolved oxygen in the water. It might also create more Delta benefits by delaying nutrient use until nutrients reach the Delta. Further research is warranted into the water quality of the drain water, especially its oxygen-depriving, high-organic load and its chemical constituents (salts, herbicides, and pesticides). Otherwise, it may be that the action is little more than an augmentation of the current practice of dumping what might be described as polluted agricultural drain water into Central Valley rivers and the Delta.
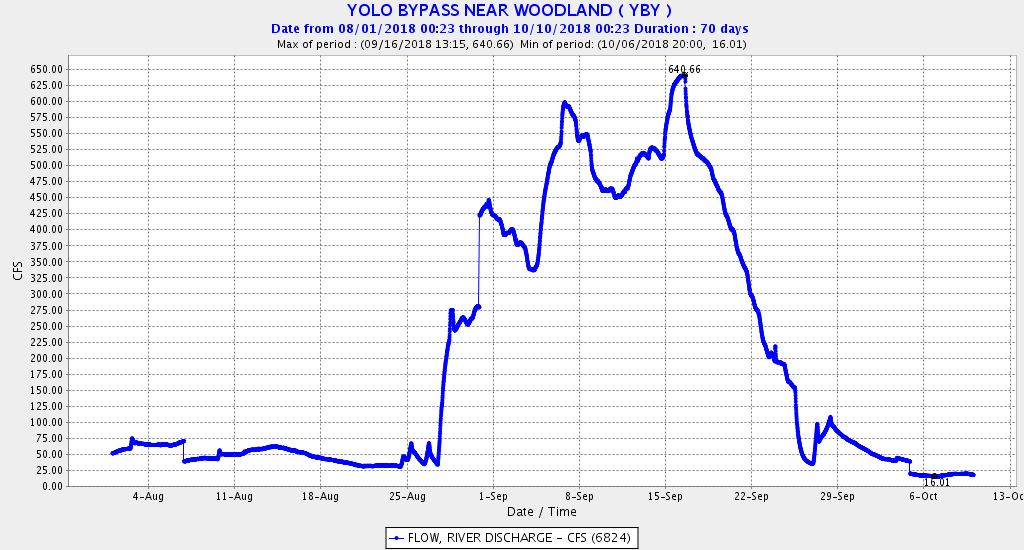
Figure 1. Stream flow (cfs) in Yolo Bypass below Colusa Basin Drain outlet. The pulse flow reached the Yolo Bypass on or about August 28 and ended on September 25.
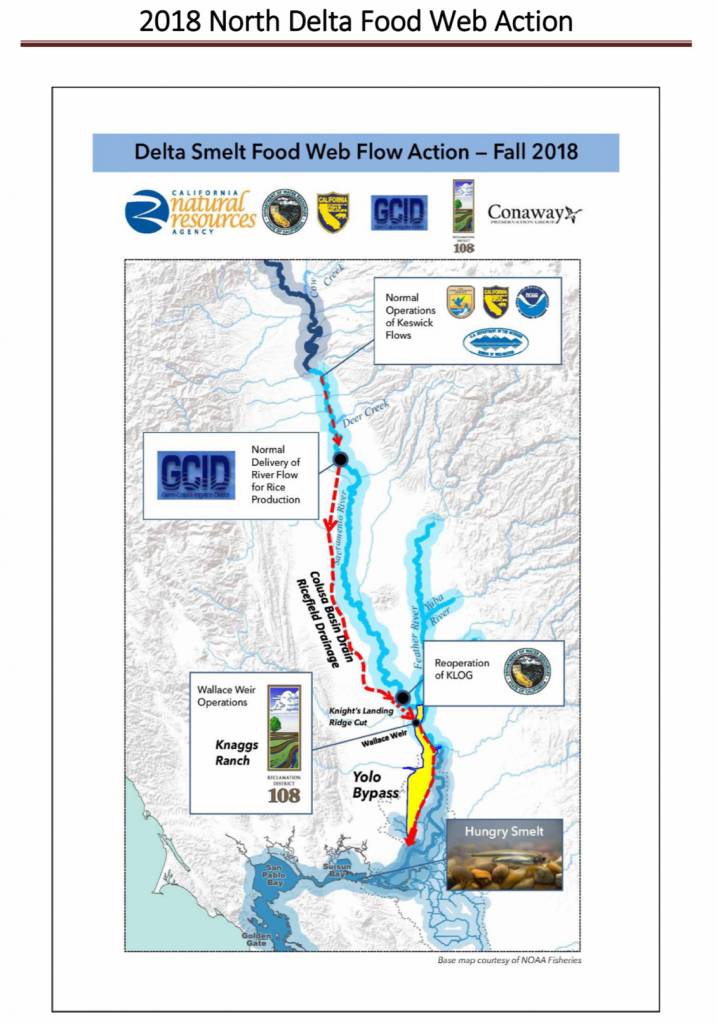
Figure 2. Project scheme and map of key features.
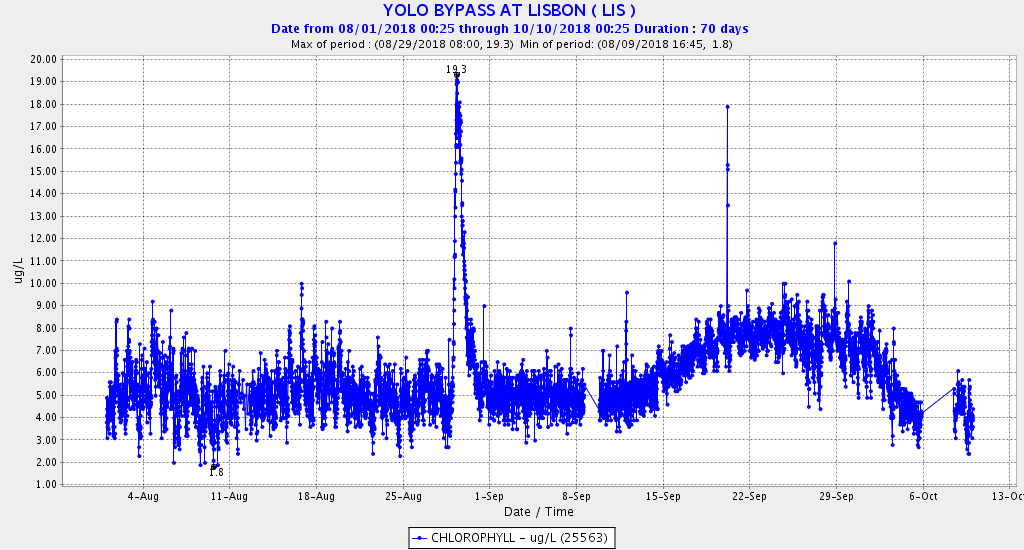
Figure 3. Chlorophyll concentration in lower Yolo Bypass at Lisbon in late summer 2018. There was a 50% increase in late September to about 8 micrograms per liter, although below the target of 10 or higher.
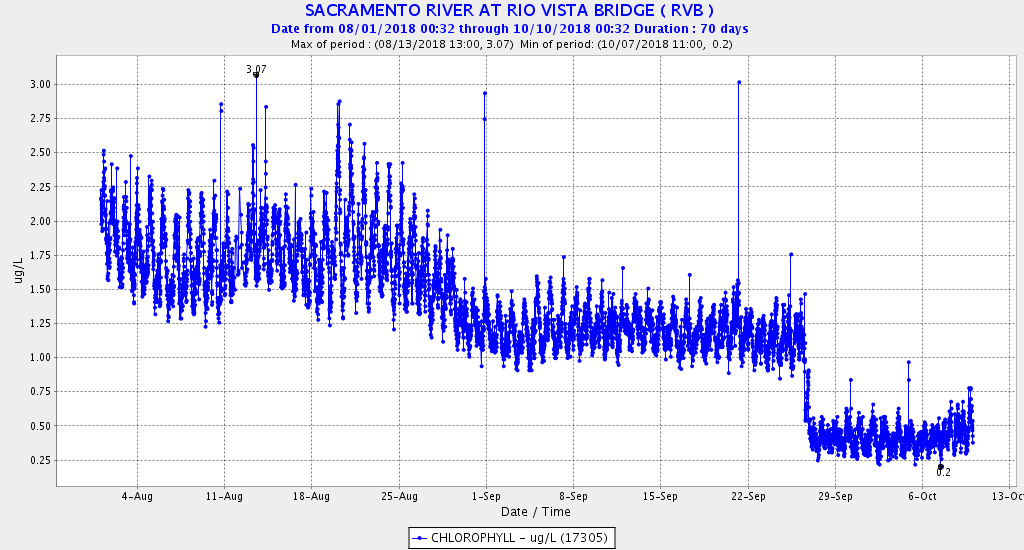
Figure 4. Chlorophyll concentration in north Delta at Rio Vista in late summer 2018. There was a slight decline after September 1 to about 1.25 micrograms per liter, well below the target of 10 or higher.
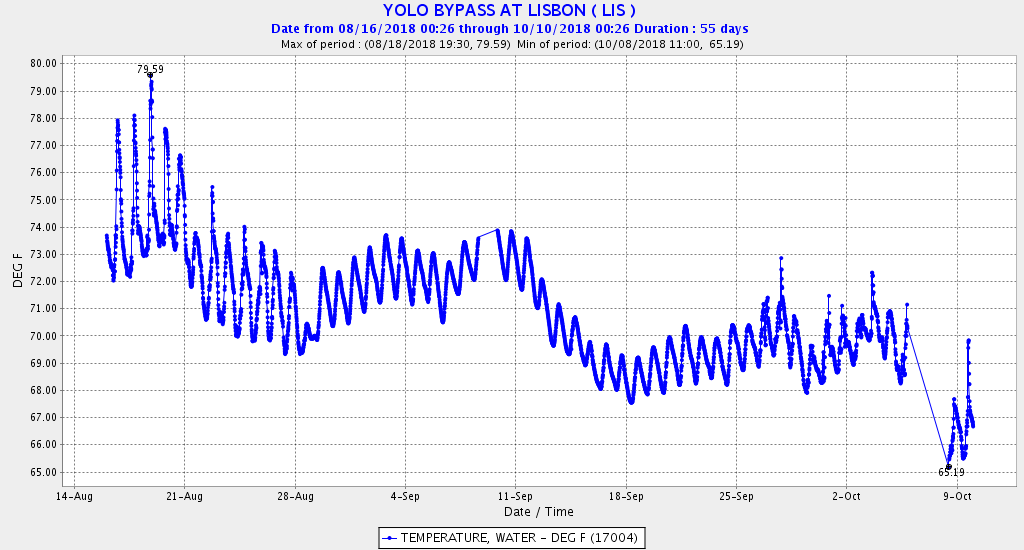
Figure 5. Water temperature in lower Yolo Bypass at Lisbon in late summer 2018.
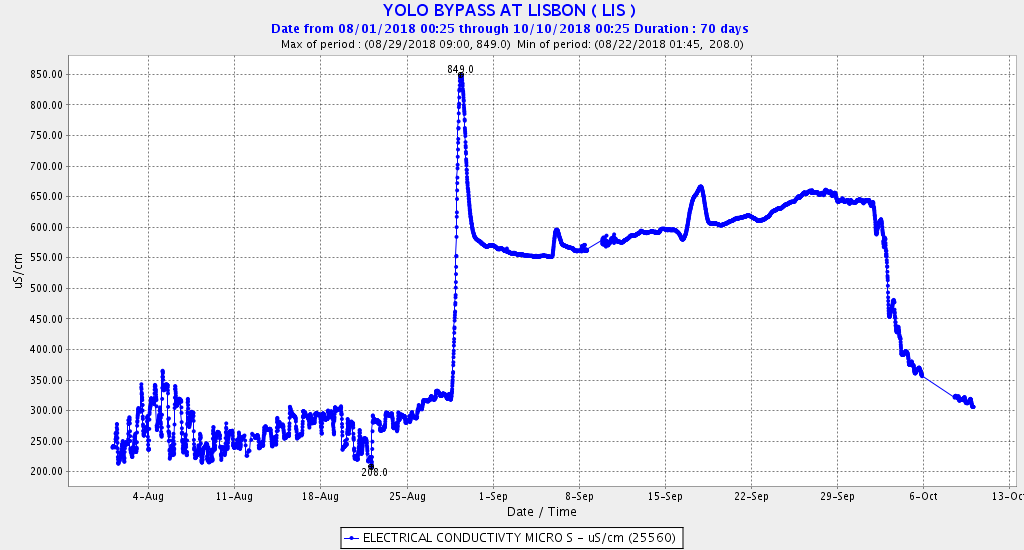
Figure 6. Salt concentration (EC) in lower Yolo Bypass at Lisbon in late summer 2018. The drain water entering at the end of August had a high salt concentration.
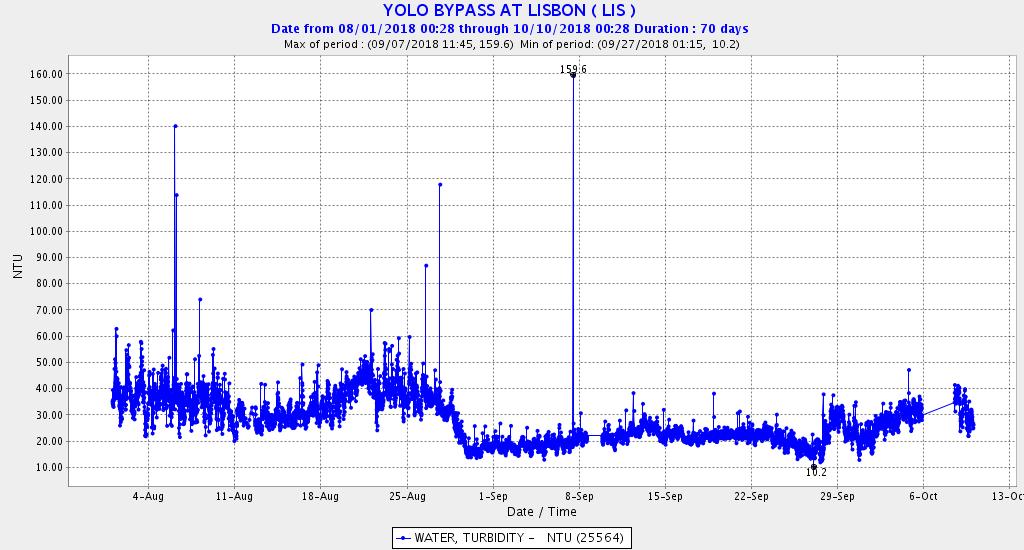
Figure 7. Turbidity (NTUs) in lower Yolo Bypass at Lisbon in late summer 2018.
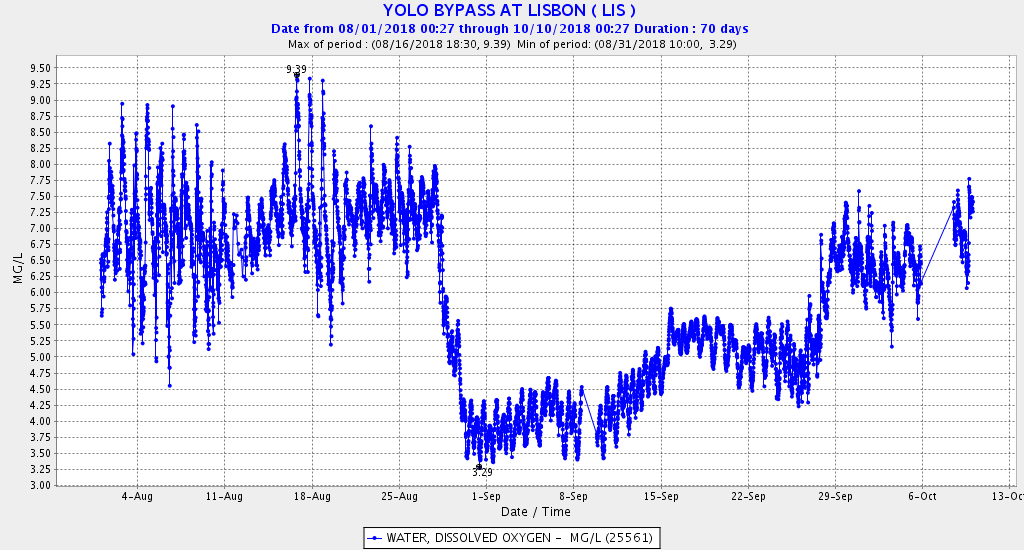
Figure 8. Dissolved oxygen (mg/l) in lower Yolo Bypass at Lisbon in late summer 2018. The drop in DO at the end of August reflects the high organic load of the drain water.