“This month six California and federal agencies representing water management, fish, and wildlife, along with the Sacramento River Settlement Contractors, signed onto the Sacramento River Science Partnership. The Partnership establishes an interagency science collaborative in which members will develop, share and discuss science to inform water management activities and protection of fish in the mainstem Sacramento River.” (8/25/20 News Release)
- The seven signatories will foster and advance science to inform sustainable solutions to water management challenges including conflicts between water supply delivery and fish survival.
The time when anyone thought that the problems confronting Central Valley salmon could be solved with more science is long gone. The problems and solutions have not really changed in the 40+ years I have been involved. And the problems are only getting worse. Why is it so hard to address them?
The Problems
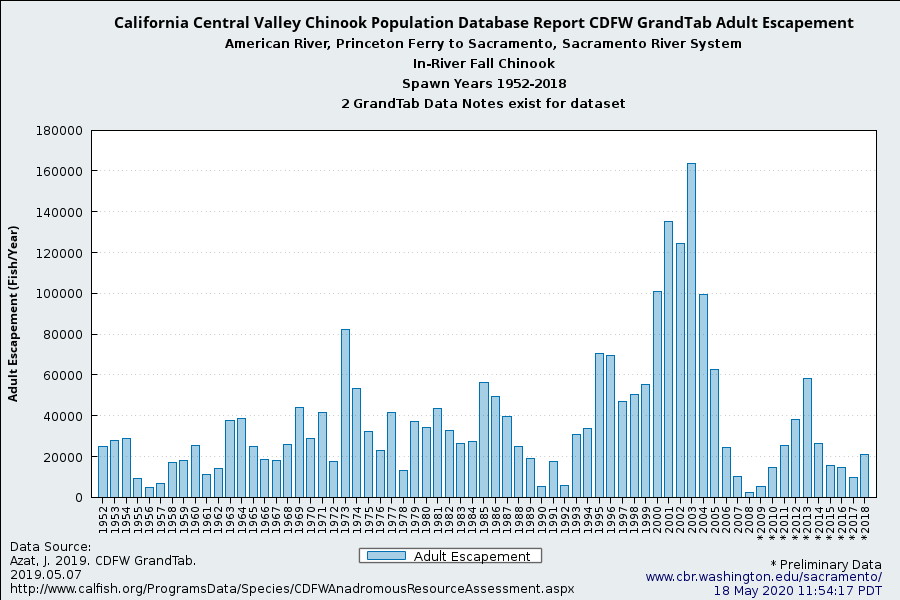
As a consequence of rainfall, snowmelt, reservoir storage and release, and water diversions, flows in the Sacramento River, have become so low and erratic that they strand salmon spawning redds and create prolonged high water temperatures in the juvenile rearing and migration reaches of salmon. It is a wonder that there are any wild salmon left. Without hatcheries, there would be few if any salmon in the Central Valley at all.
Spring-Summer Water Temperatures
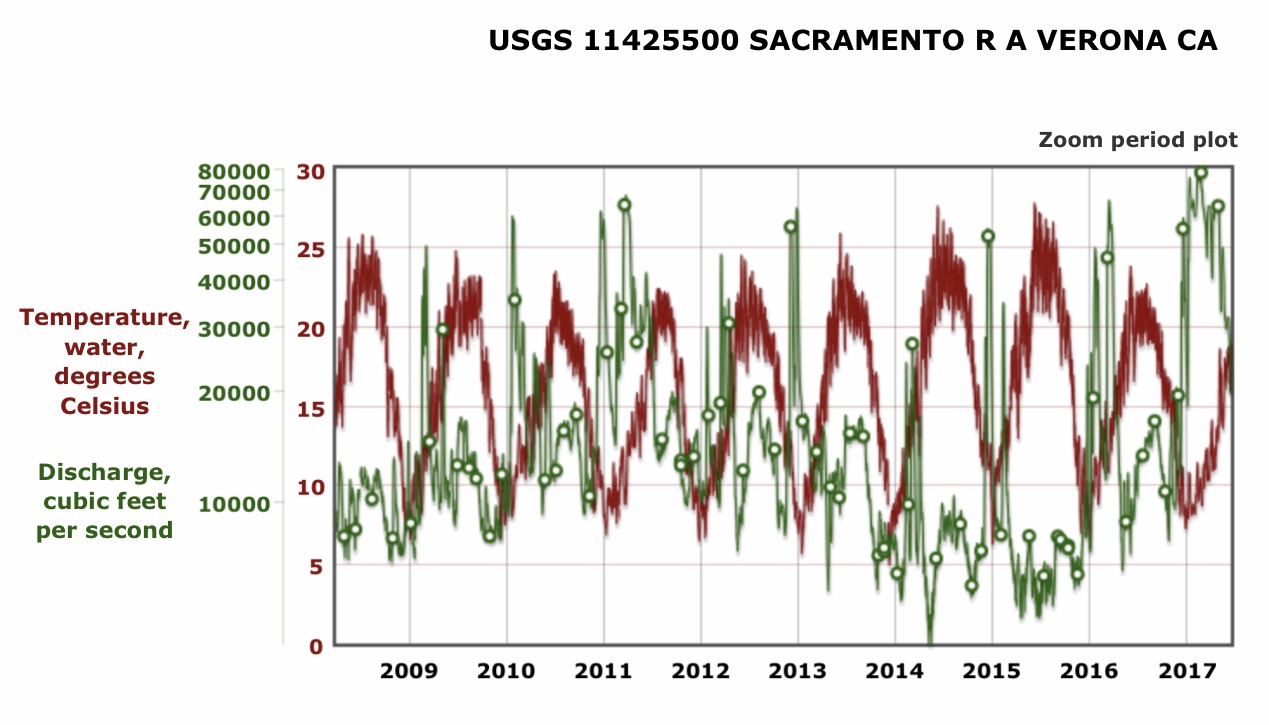
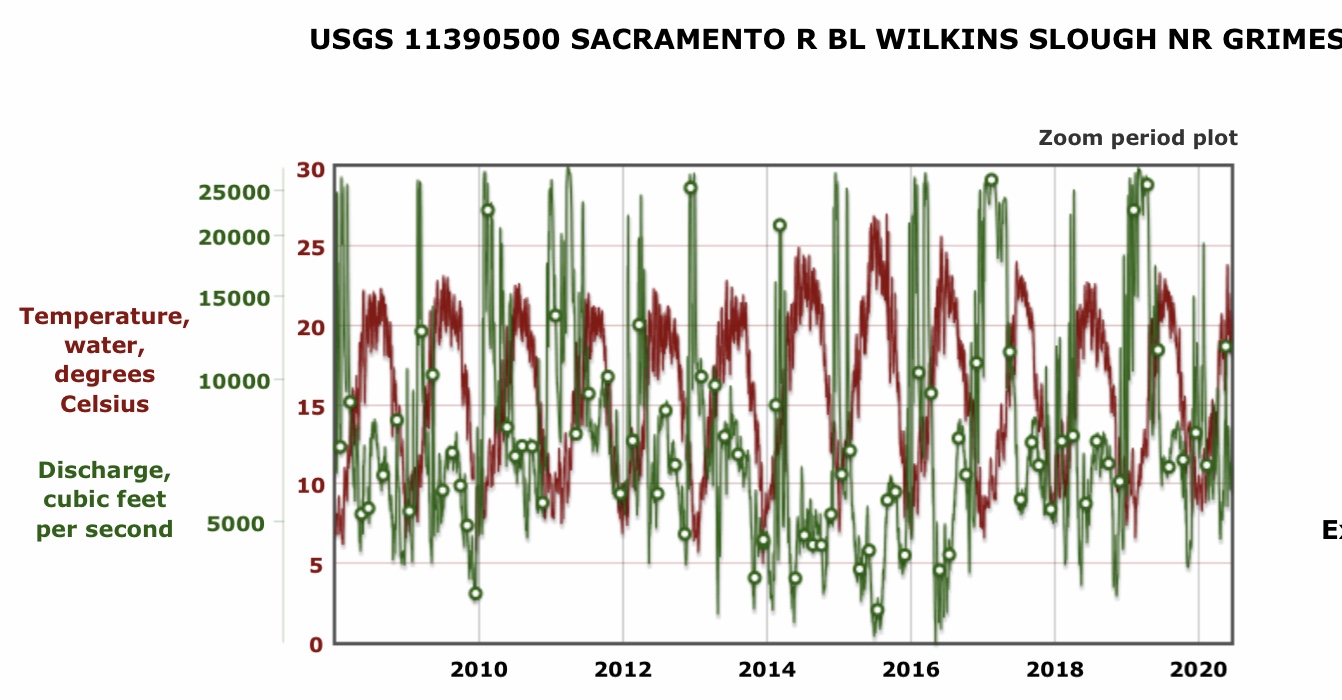
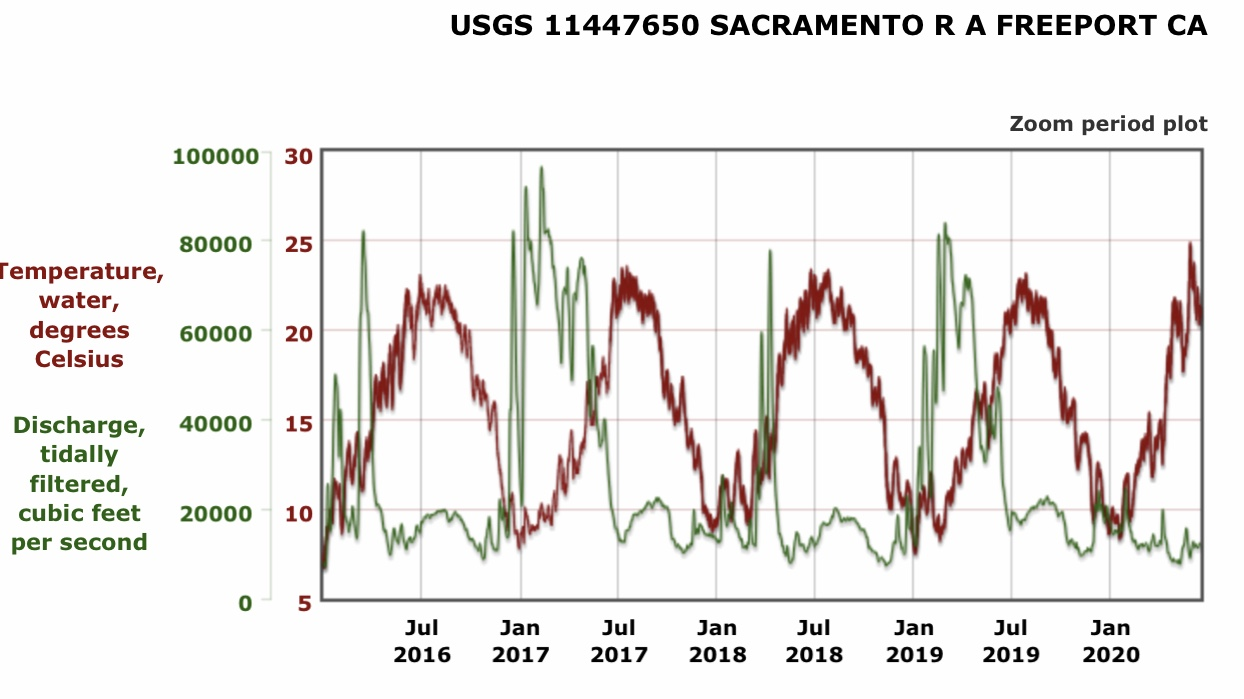
Spring-summer water temperatures in the lower Sacramento River are bad. They kill salmon and sturgeon, block migrations, lead to poor juvenile salmon growth, early migration, high predation, and cause huge predation problems for young hatchery and wild salmon. The high temperatures exceed state water quality standards and water project permit requirements. Yes, water temperatures were bad during the 2013-2015 critical drought, as might be expected (Figure 1). But they have also been bad in the five normal and wet years (2016-2020) since the drought (Figure 2). The safe level is 65°F, but the standard is set at 68°F, above which stress and higher mortality occurs. 68° is supposed to be an upper limit that should not be exceeded, and in past decades it rarely was. It is now the accepted norm, and even then it is not enforced.
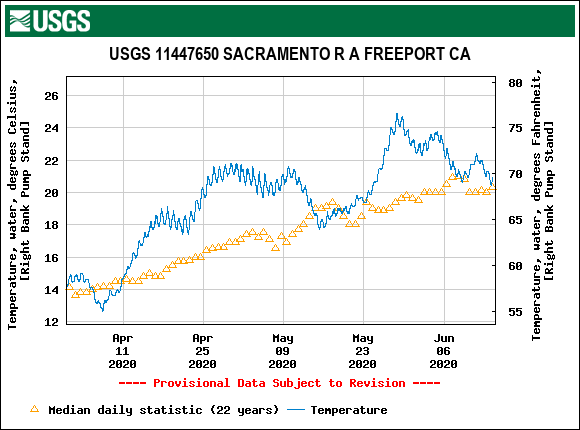
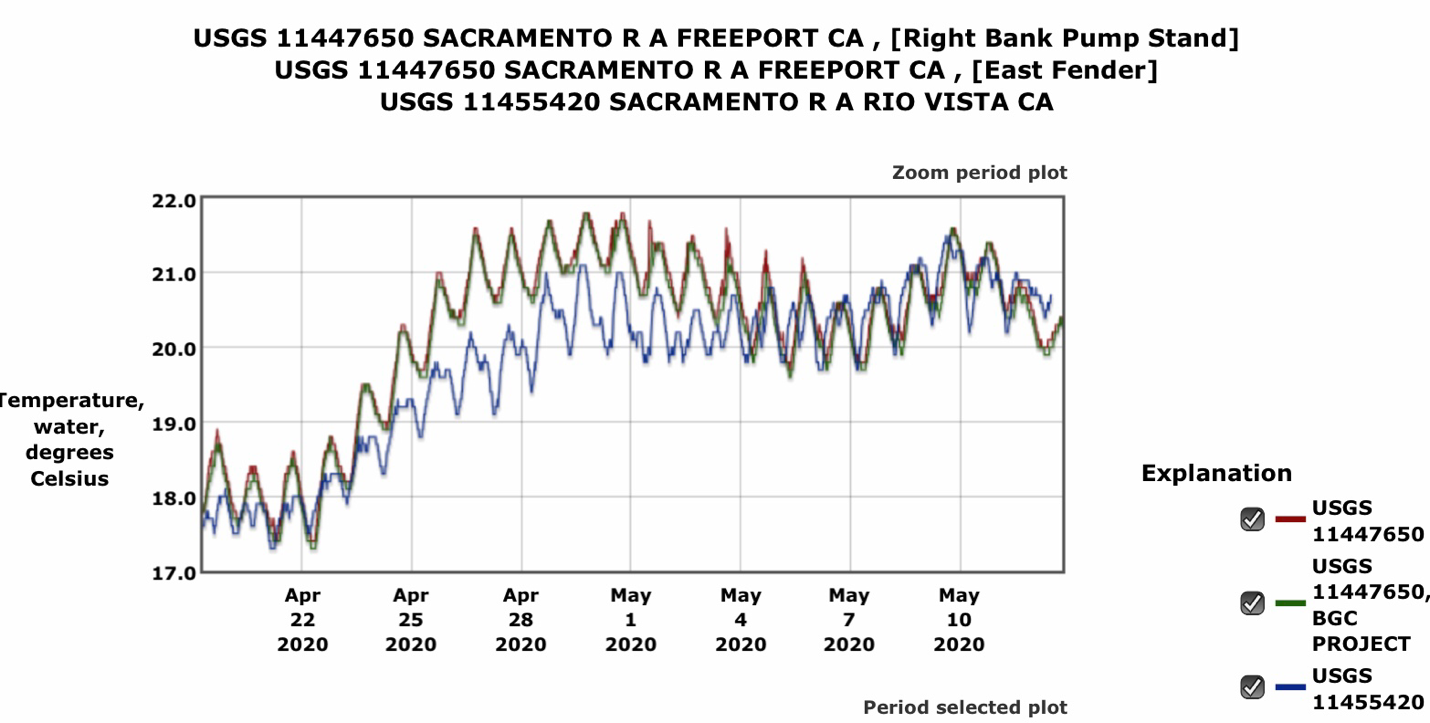
In 2020 (Figure 3) spring water temperatures were detrimental to the upstream migration of endangered winter-run and spring-run salmon, emigrating juvenile fall-run salmon, and larval and juvenile sturgeon. High summer temperatures hinder migration of adult fall-run salmon and are detrimental to survival of winter-run fry, over-summering late-fall-run and fall-run salmon smolts, and rearing juvenile sturgeon.
Fall Drops in Water Levels
Often, usually in October-November, flow releases from Shasta reservoir drop sharply in response to decreasing downstream irrigation demands. The decreases lead to fall-run salmon redd dewatering in the upper river spawning area near Redding and poor habitat and emigration flows for winter-run and late-fall run juvenile salmon.
Stranding
Adult and juvenile salmon are stranded throughout the Sacramento River floodplain after winter-spring, high-flow events. In addition, drops in water surface elevation of four feet in the fall (Figures 4 and 5), soon after spawning de-water the vast majority of fall-run spawning redds in the 20-mile spawning reach downstream of Keswick Dam. Drops in flows after floodway weir spills (Figures 6 and 7) strand adult salmon and sturgeon that are migrating upstream, and also strand juvenile downstream emigrants in the Sutter and Yolo floodway bypasses.
Hatchery Releases
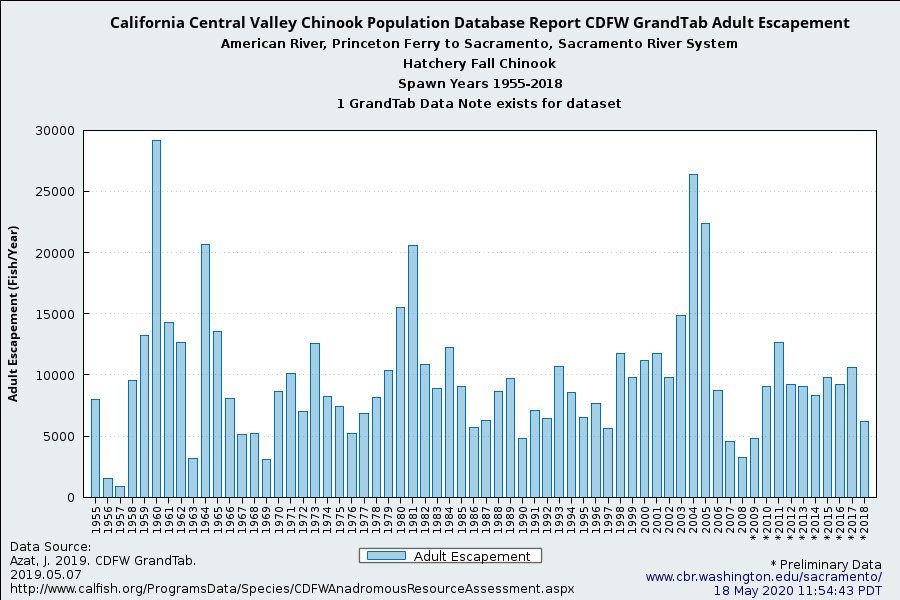
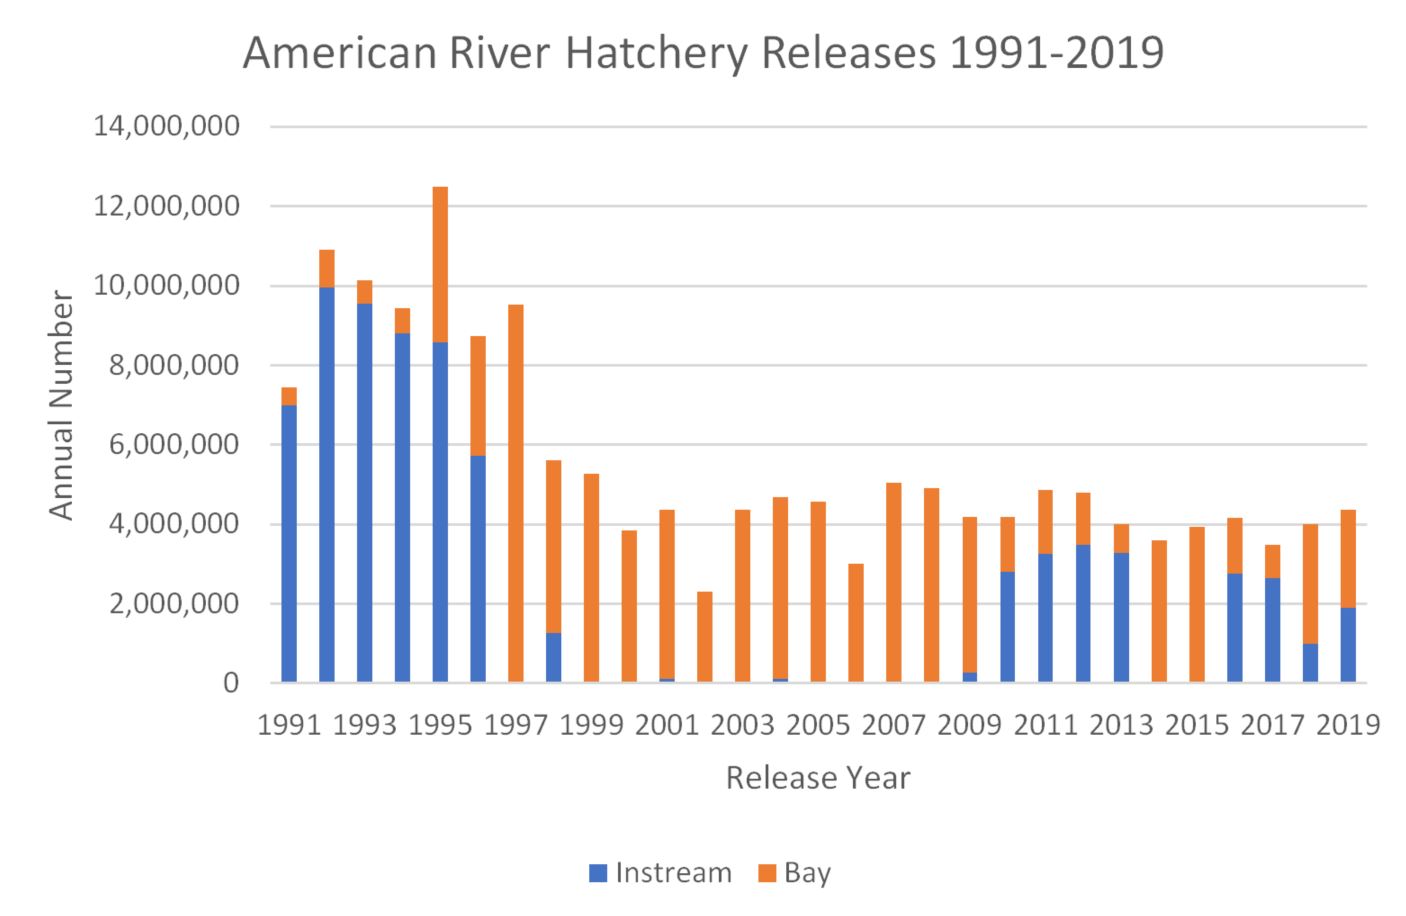
Releases of millions of hatchery-raised salmon and steelhead smolts in winter and spring into the lower Sacramento River from federal and state hatcheries compromise wild salmon and steelhead fry, fingerling, and smolt survival throughout the lower Sacramento River. Hatchery salmon and steelhead prey upon and compete with wild salmon and steelhead, and attract non-native predatory striped bass that also feed on wild salmon and steelhead.
Solutions
A new science plan for the upper reaches of the lower Sacramento River is not going to solve the problems that stem from failure to act on what science has told us for decades.
Solutions to the problems outlined above abound. These solutions are well documented in the Central Valley Salmon and Steelhead Recovery Plan (NMFS 2014) and other stakeholder plans.1 The most important solution, is water temperature limits in the lower Sacramento River, which were adopted decades ago in state water permits and water quality control plans. These limits designed to protect salmon are simply no longer enforced.
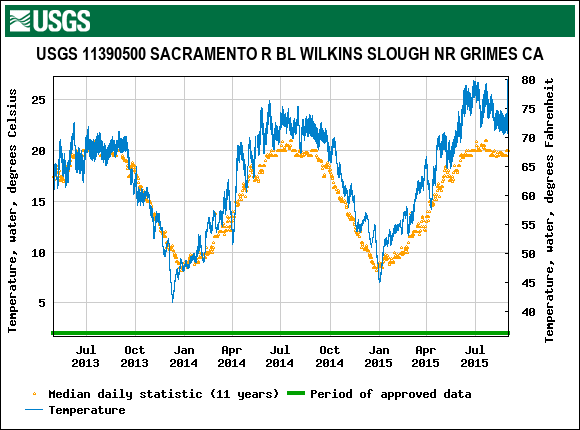
Figure 1. Water temperature in the lower Sacramento River from 2013-2015 critical drought years near Grimes, CA. Also shown is average for the past 11 years of record. https://nwis.waterdata.usgs.gov/nwis/
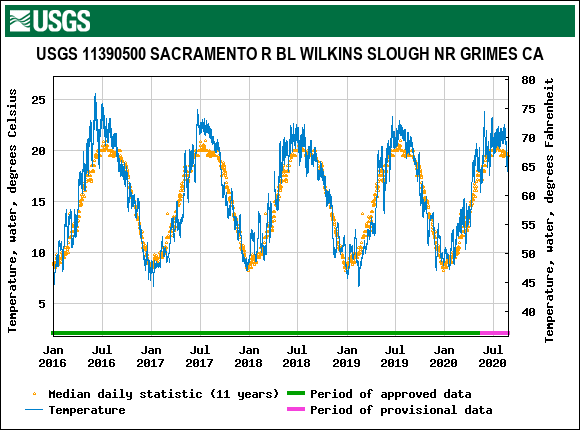
Figure 2. Water temperature in the lower Sacramento River from 2016-2020 post-drought years near Grimes, CA. Also shown is average for the past 11 years of record.
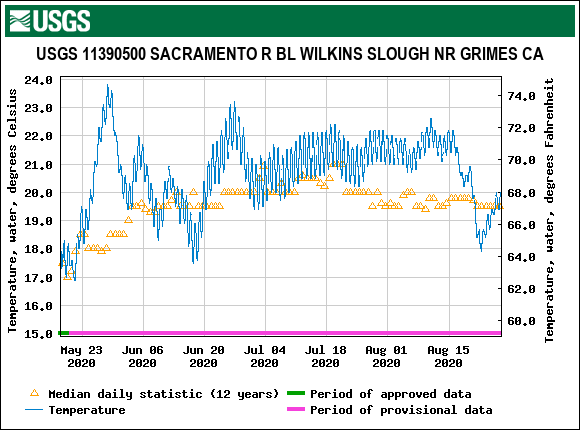
Figure 3. Water temperature in the lower Sacramento River in 2020 near Grimes, CA. Also shown is average for the past 11 years of record.
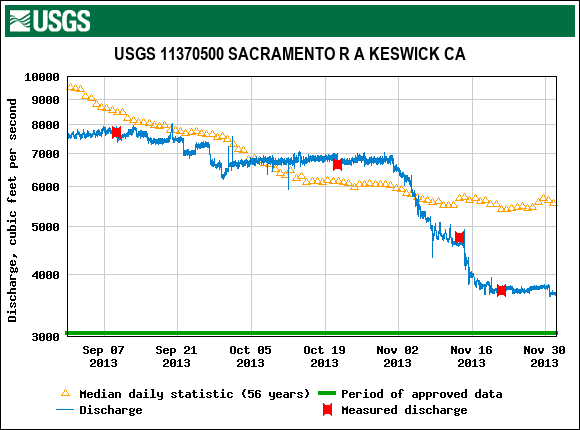
Figure 4. Sacramento River flows in fall of 2013 below Keswick Dam near Redding.
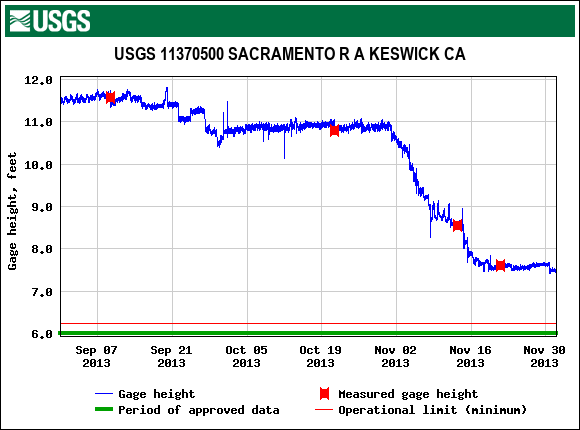
Figure 5. Sacramento River water surface elevation in fall of 2013 below Keswick Dam.

Figure 6. Spills of water from Sacramento River over Tisdale flood control weir during the period from December 2013 to February 2015. Source: CDEC
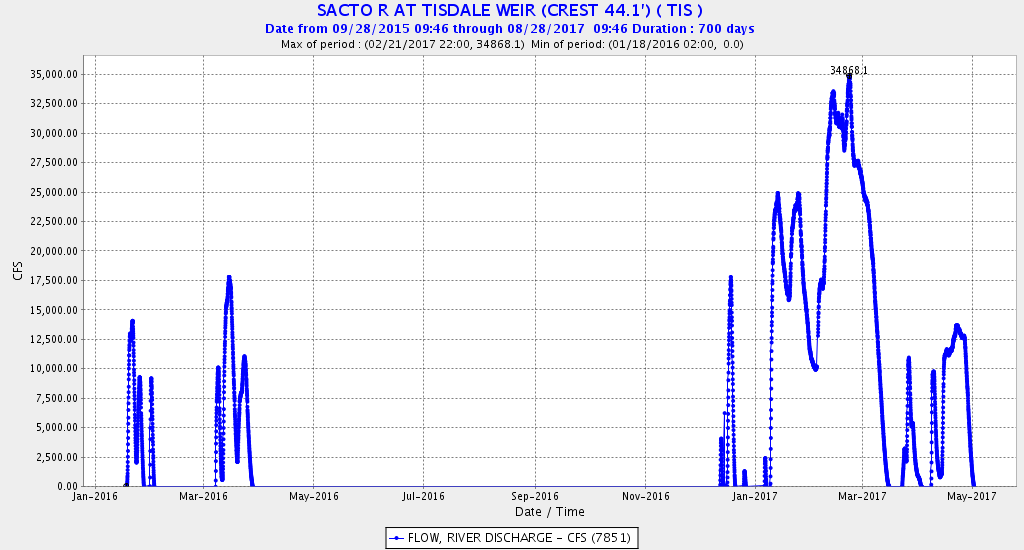
Figure 7. Spills of water from Sacramento River over Tisdale flood control weir during the period from January 2016 to May 2017. Source: CDEC