Wild Central Valley Salmon: Managers Missing an Opportunity

This winter and early spring of 2020 have been drier than normal in the Central Valley. However, precipitation in January, March, and now April provided opportunities to greatly enhance this year’s brood of fall and spring run salmon success. Water managers missed these opportunities by capturing all the water in reservoirs. What happened to prescribed spring flow pulses for salmon in state and federal plans? Is holding the promised water back the “best science”?1 No.

Shasta, Oroville, and Folsom reservoirs, the largest in Sacramento Valley, have released no flow pulses since January 1 to the Sacramento, Feather, and American rivers (Figure1). These are the rivers with the state’s biggest runs of fall-run and spring-run salmon. These three reservoirs now hold 6.5 million acre-feet (MAF) of stored water, over 95% of average for this date. Also available is 2 MAF of water now stored in Trinity Reservoir, which is at 109% of average for this date. Local rainfall and un-dammed tributaries have provided three significant flow pulses in lower rivers and the Delta, but these pulses have not touched the spawning and rearing grounds just downstream of the major dams.
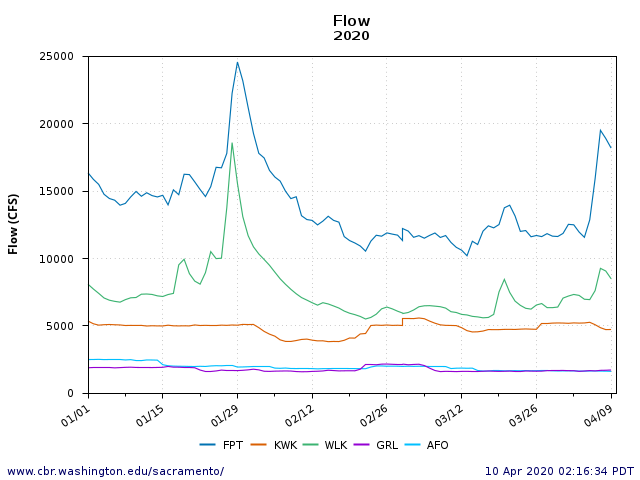
Figure 1. Streamflow (cfs) in the upper section of the lower Sacramento River below Shasta (KWK – Keswick), the middle section of the lower Sacramento River (WLK – Wilkins), the lower section of the lower Sacramento River (FPT – Freeport), the lower Feather River (GRL – Gridley), and the lower American River (AFO – Fair Oaks).

The lower San Joaquin River watershed had a similar record this year, with minimal contribution to Delta inflow and outflow or to flow pulses from reservoirs (Figure 2).  The watershed’s largest reservoir, New Melones on the Stanislaus River, has 121% of average for the date with 1.9 MAF of water in storage.  New Melones did provide a small release in early February and appears to be ramping up releases in early April.  But the State Water Board has already written a letter to the Bureau of Reclamation calling Reclamation out for failing to maintain required flows in the lower San Joaquin River.
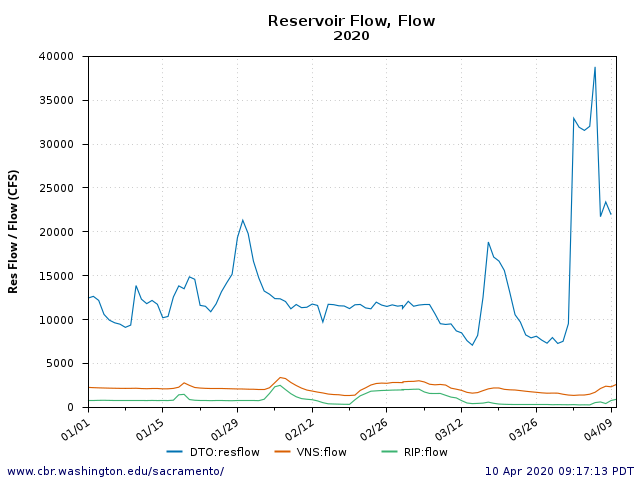
Figure 2. Streamflow (cfs) in the lower San Joaquin River (VER – Vernalis), the lower Stanislaus River (RIP – Ripon), and Delta outflow (DTO).

The river flow and Delta outflow pulses in early April have spurred the annual exodus of juvenile spring and fall run salmon from the Delta (Figure 3).  It is important to get as much of the river juvenile salmon production into the Delta as soon as possible to take advantage of this critically-timed pulse in Delta outflow.  The tailwaters of the large dams holds tens of millions of wild fry and juvenile salmon (30-50 mm in length) that need to get downstream to grow and to emigrate into and through the Delta.  These young salmon need reservoir releases to encourage their emigration and improve their growth and survival.  Most importantly, pulses will piggy-back on the present April pulse in Delta outflow.  This need is most pronounced in the San Joaquin salmon watersheds, where flows have been low and few salmon have reached the Delta (Figure 4).  The need to support the fall-run and spring-run salmon emigration extends at least through April and into May, including over 20 million hatchery salmon smolts released from tributary hatcheries (Figures 5 and 6).
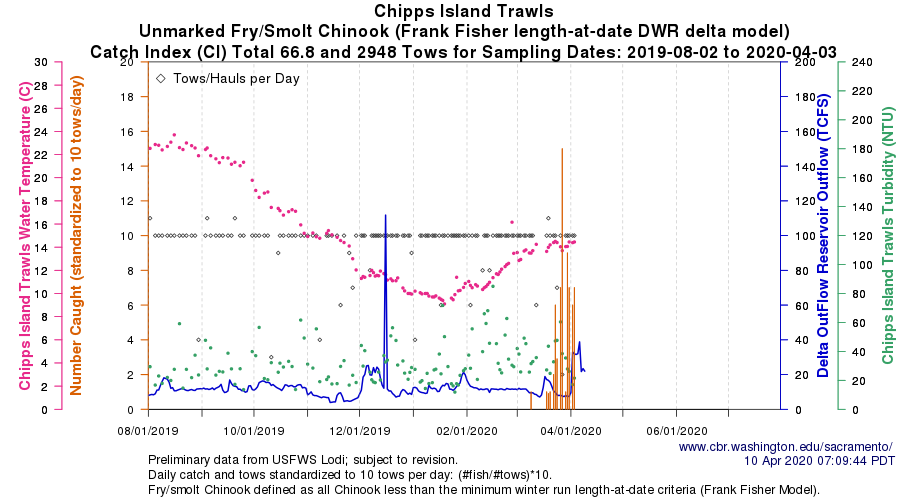
Figure 3. Catch of juvenile salmon at exit from the Delta at Chipps Island In 2020.
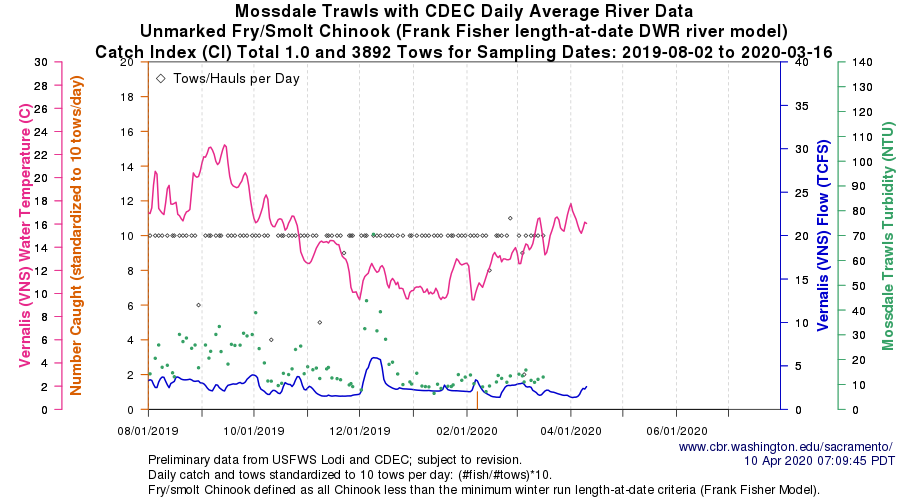
Figure 4. Catch of juvenile salmon in the lower San Joaquin River at Mossdale at entrance to the Delta In 2020. Note catch was only one so far in 2020.
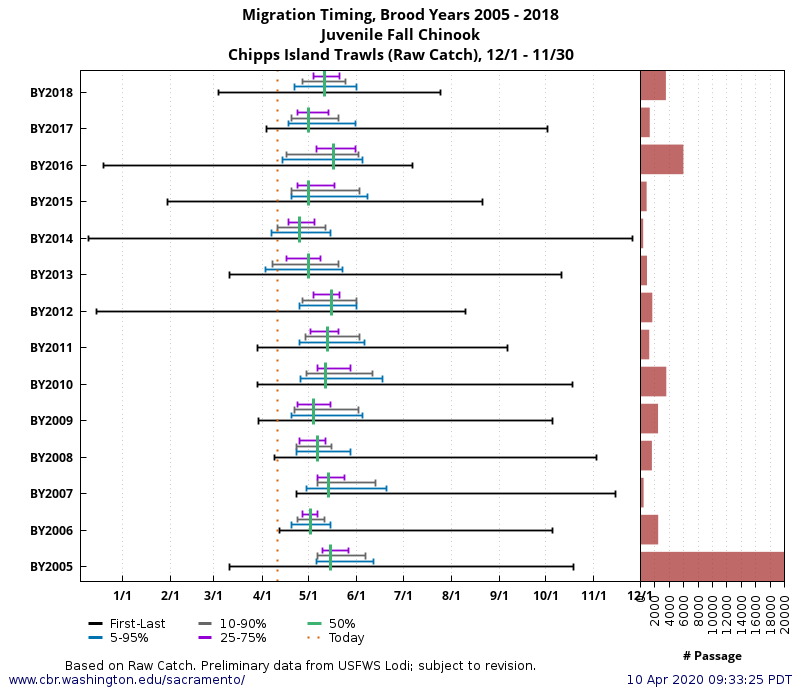
Figure 5. Timing of the fall-run salmon exiting the Delta in brood years 2005-2018 (2006-2019).
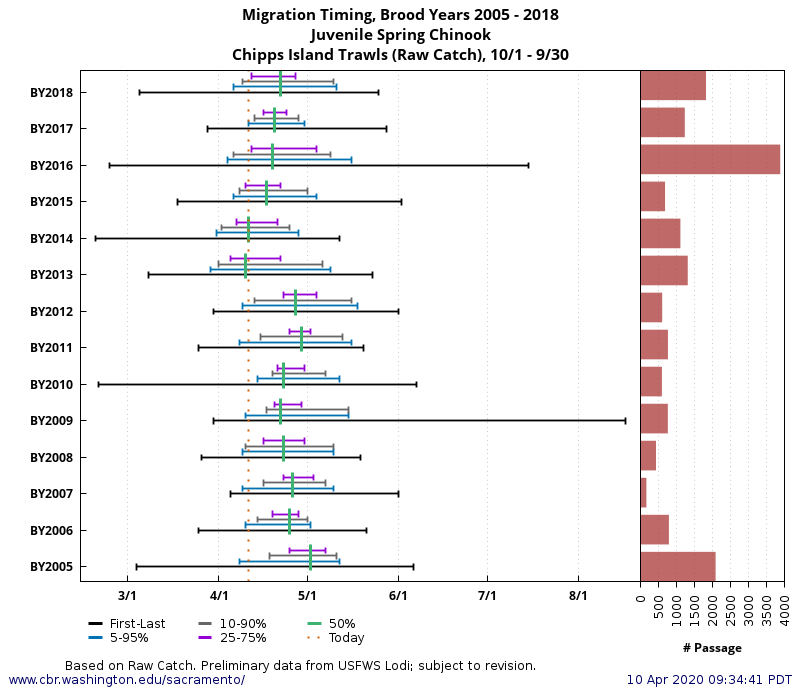
Figure 6. Timing of the spring-run salmon exiting the Delta 2006-2019.

 

Delta Smelt Recovery Strategies – Winter 2020 Update

The Delta smelt are in trouble. The state and federal programs to help smelt recover are failing to meet their goals. The Delta Smelt Resilience Strategy adopted in 2016 is the State’s program to save Delta smelt. The State Strategy is not working, and has perhaps even made things worse in the four below normal and wet years that the state strategy has been applied since the 2013-2015 drought. This failure may explain why the strategy document is stored as a “legacy” file on the California Natural Resources Agency’s website.

The State’s Strategy consists of a number of action programs to help smelt:

  • Aquatic Weed Control
  • North Delta Food Web Adaptive Management Projects
  • Delta Outflow Augmentation
  • Reoperation of the Suisun Marsh Salinity Control Gates
  • Sediment Supplementation in the Low Salinity Zone
  • Spawning Habitat Augmentation
  • Roaring River Distribution System Food Production
  • Coordinate Managed Wetland Flood and Drain Operations in Suisun Marsh
  • Adjust Fish Salvage Operations during Summer and Fall
  • Stormwater Discharge Management
  • Rio Vista Research Station and Fish Technology Center
  • Near-term Delta Smelt Habitat Restoration
  • Franks Tract Restoration Feasibility Study

When the Delta Stewardship Council last took a close look on progress of the State Strategy in 2019 it found little that was encouraging. It identified two actions that showed promise: hatchery supplementation of Delta smelt and the operation of the Suisun Marsh Salinity Control Gates (SMSCG). More recently, the State has stated in its February 20, 2020 lawsuit against the Bureau of Reclamation that the Delta smelt hatchery program is not reasonably certain to have positive benefits.

The Federal Strategy shows even less progress and little future promise. The Federal Strategy consists of a number of action programs to “help” smelt while further reducing water allocated to their recovery:

  • Delta Smelt Outflow Action
  • Operations of the Suisun Marsh Salinity Control Gates
  • Directed Outflow Project (DOP)
  • Mesocosm (Cage) Studies – cultured smelt raised in cages
  • EDSM: Endangered Delta Smelt Monitoring is a year-round weekly sampling program administered by the Service and voluntarily funded by Reclamation.
  • Drivers of Delta Smelt Health Study
  • The Salinity and Growth History of Delta Smelt Study
  • The Delta Outflow Augmentation Modeling Study
  • Roaring River Distribution System Restoration: Experimentally produces food through wetland management in the Suisun Bay and Marsh.
  • Sacramento Deepwater Ship Channel nutrient manipulation involving experimentally seeding nutrients in the Deepwater Ship Channel to enhance productivity in Cache Slough.

It is worth noting that while both the State and federal programs point to the importance of Delta outflow, the latest State and federal operating plans for the Delta both propose to reduce outflow compared to recent past operations. Reducing outflow requirements leads to higher Delta exports.

Below, I summarize results of two experiments to increase north Delta smelt food production in 2019.

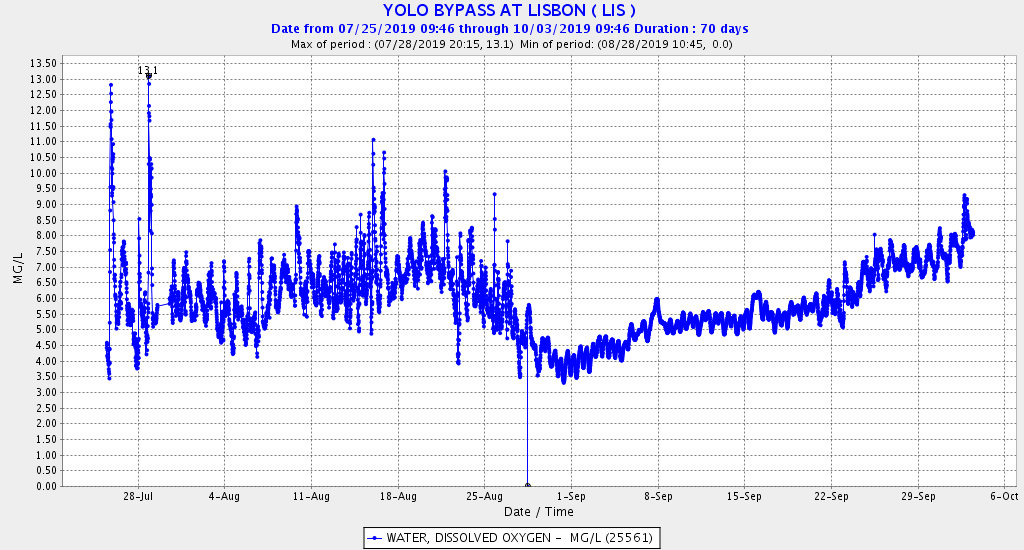
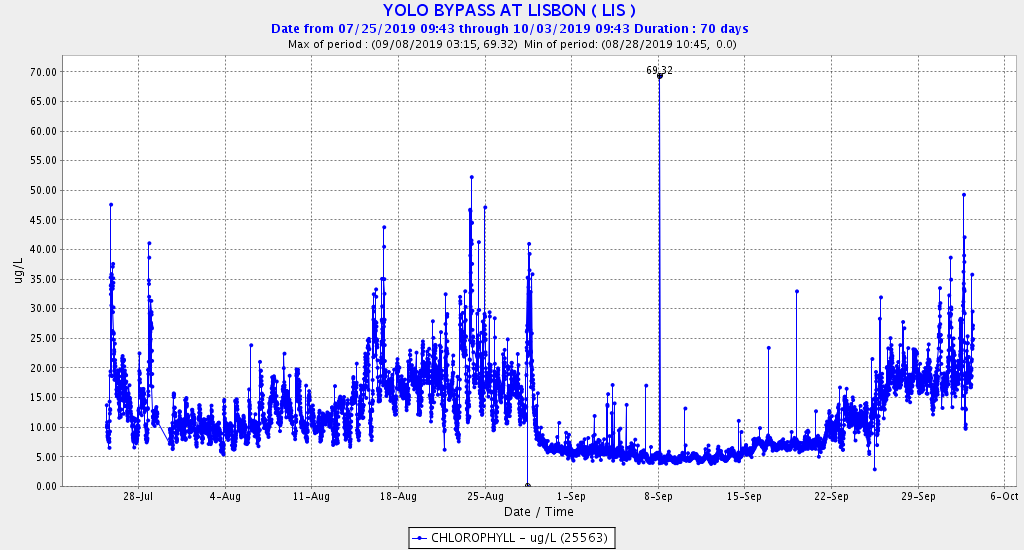
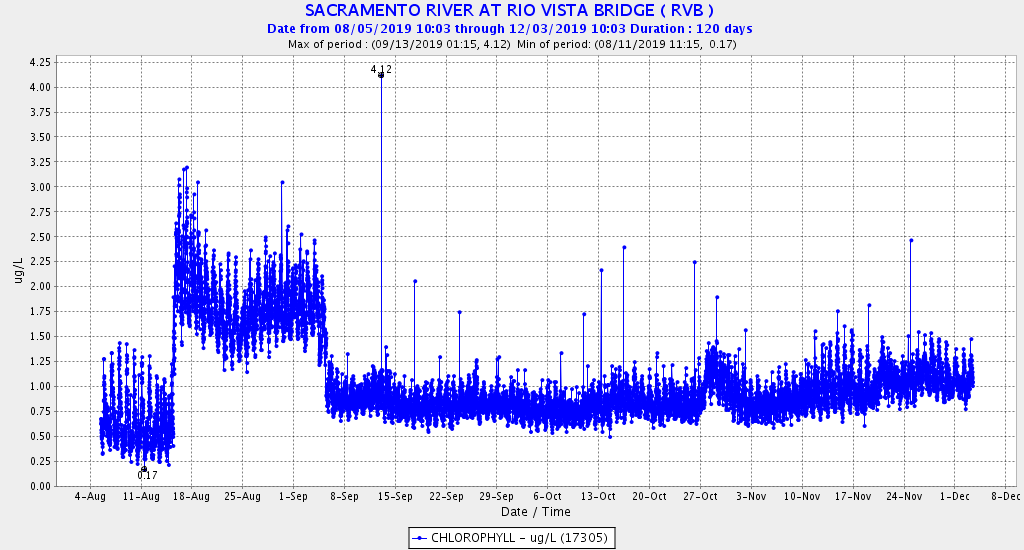
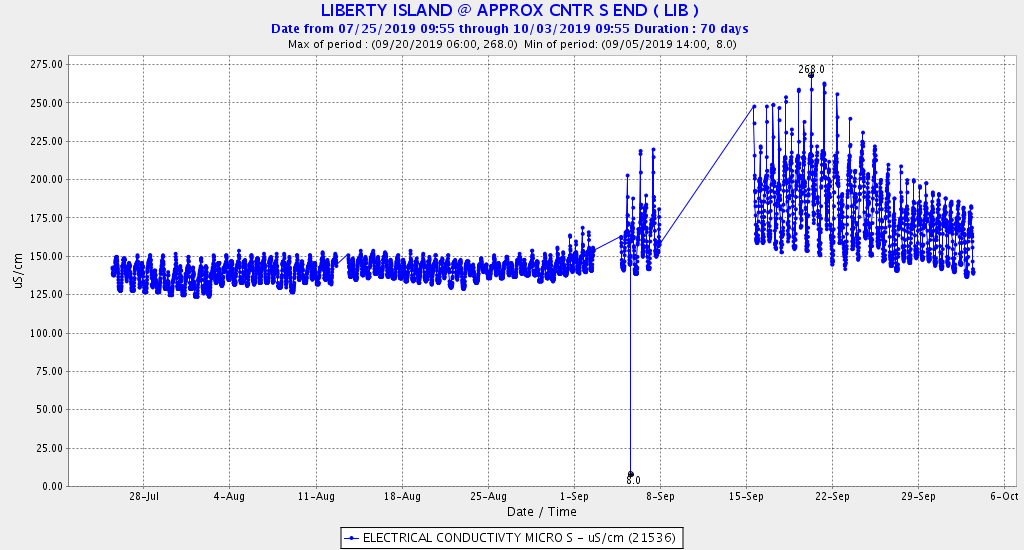
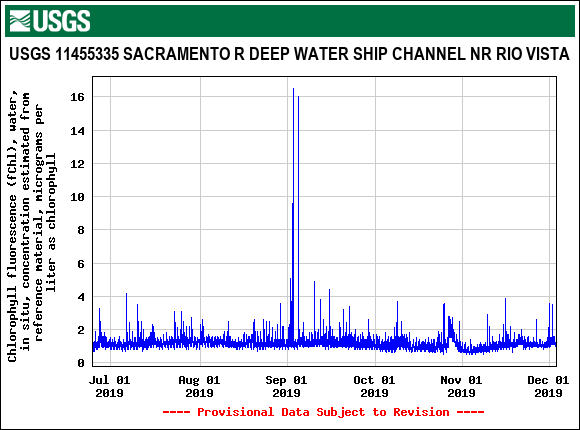
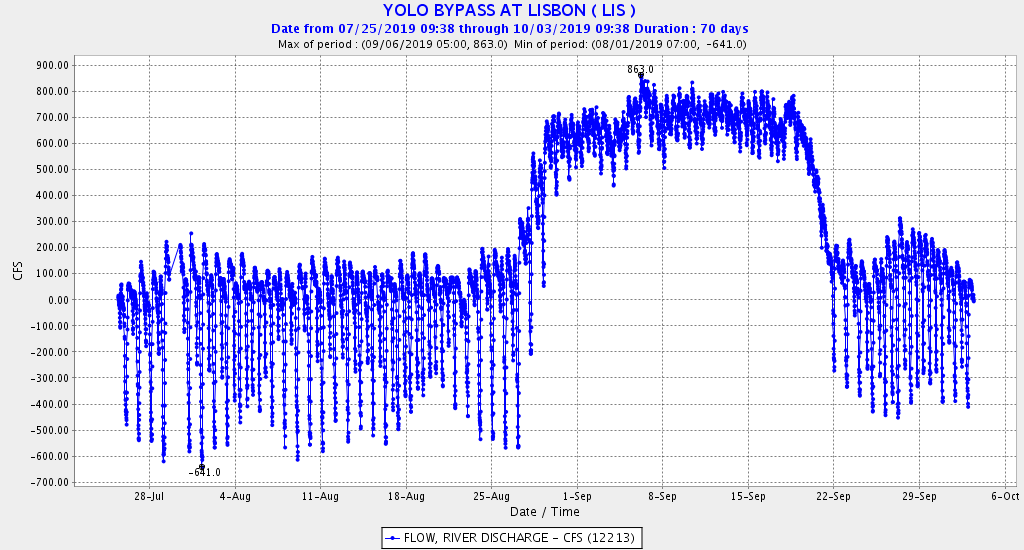
In a prior update in October 2018, I opined that the benefits of 2018 north Delta food actions were questionable, despite optimism by the state and federal programs. The actions were applied again in 2019, with results similar to those in 2018. During September 2019, approximately 600-800 cfs of river and ag-return water (Figure 1) was routed down the Colusa Basin Drain and through the Yolo Bypass into the north Delta at Cache Slough near Rio Vista. As in 2018, the Lisbon gage indicated depressed levels of dissolved oxygen (Figure 2), reflecting the high organic load in drain water from the agricultural Colusa and Yolo Basins carried in the Colusa Basin Drain. Though the organic load was higher in 2019, the level of chlorophyll (algae) was lower at the Lisbon gage (Figure 3) and in the north Delta (Figure 4). The organic load was accompanied by an increase in nutrient and mineral components (salts) (Figure 5). Normally, higher dissolved oxygen depressing organic loads and higher salt levels are considered pollution; however, in this case, high levels are designated as “fertilizer” with the ascribed benefit of producing more food for smelt in the Delta.

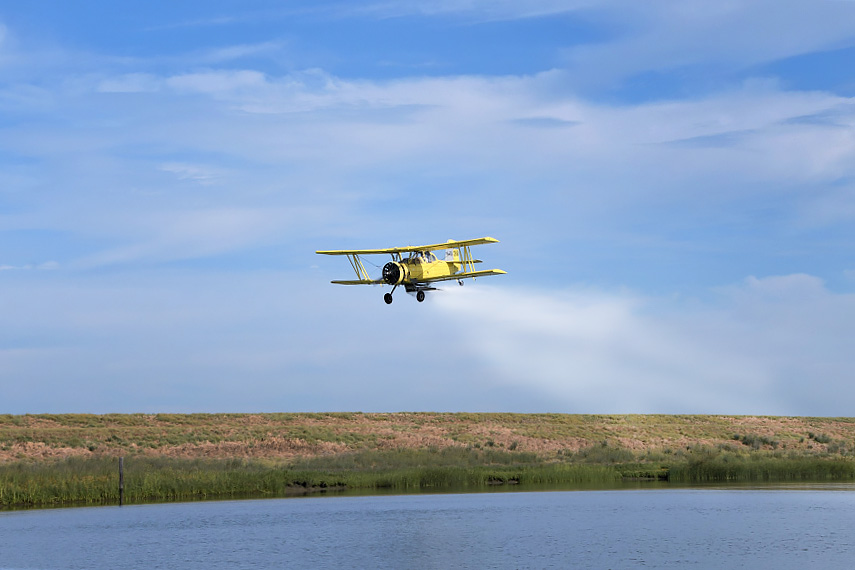
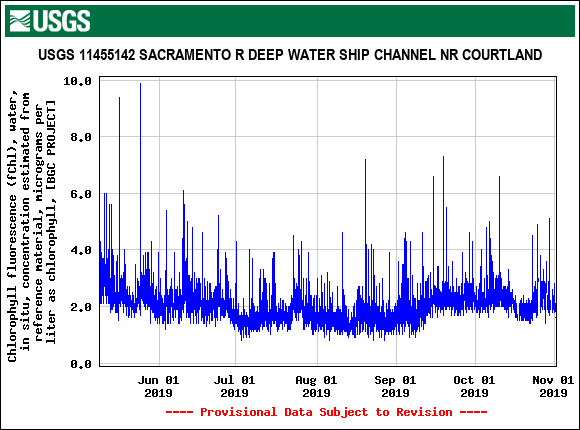
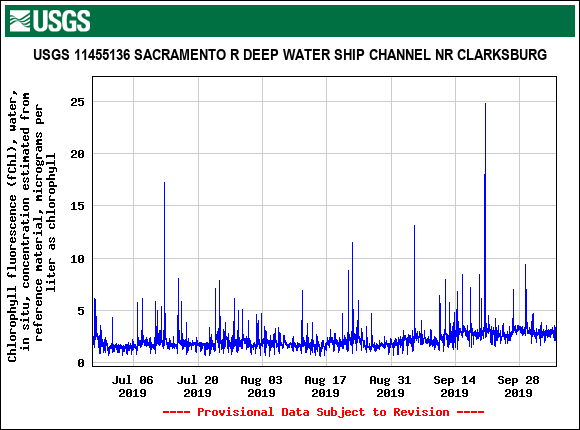
Reclamation’s attempt to stimulate food production by “fertilizing” the Deepwater Shipping Channel adjacent to the lower Yolo Bypass involved dispersal of 6 tons of nitrate salts via crop dusters (Figure 6) in August 2019. There may have been some limited stimulus of chlorophyll production in the Sacramento channel near Rio Vista (Figure 4) and in the lower Ship Channel (Figure 7). However, the chlorophyll concentrations in the middle (Figure 8) and upper (Figure 9) Ship Channel showed little or no response to the “fertilizing” effort.

In conclusion, the state and federal strategies to help recovery of Delta smelt either lack progress or show little if any benefit in terms of smelt food production and smelt reproduction. The federal Enhanced Delta Smelt Monitoring Program’s (EDSM) intensive survey of adult Delta smelt over the past four winters indicates further declining numbers (see chart immediately below).

Figure 1. Flow in tidal lower Yolo Bypass at Lisbon Weir gage near I-80 causeway in summer 2019.

Figure 2. Dissolved oxygen levels at Lisbon gage in the lower Yolo Bypass in summer 2019.

Figure 3. Chlorophll levels at Lisbon gage in the lower Yolo Bypass in summer 2019.

Figure 4. Chlorophyll concentrations in the north Delta channel of Sacramento below the mouth of Cache Slough near Rio Vista in summer-fall 2019.

Figure 5. Electrical conductivity recorded in the lower Yolo Bypass near Liberty Island in summer 2019.

Figure 6. Crop dusting fertilizing in Ship Channel August 2019. Reclamation photo.

Figure 7. Lower Ship Channel chlorophyll concentrations summer-fall 2019.

Figure 8. Middle Ship Channel chlorophyll concentrations summer-fall 2019.

Figure 9. Upper Ship Channel chlorophyll concentrations summer-fall 2019.

No Miracle March for Delta Fish

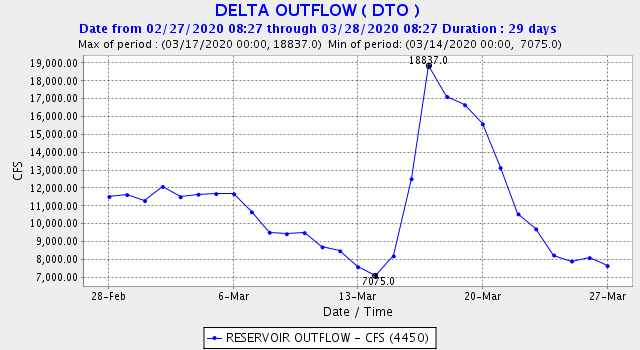
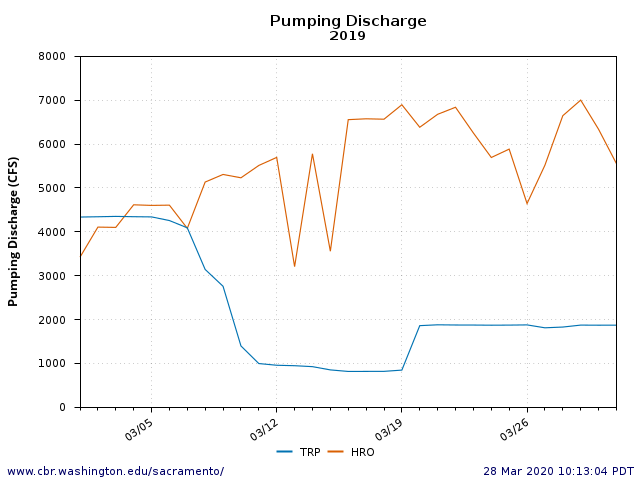
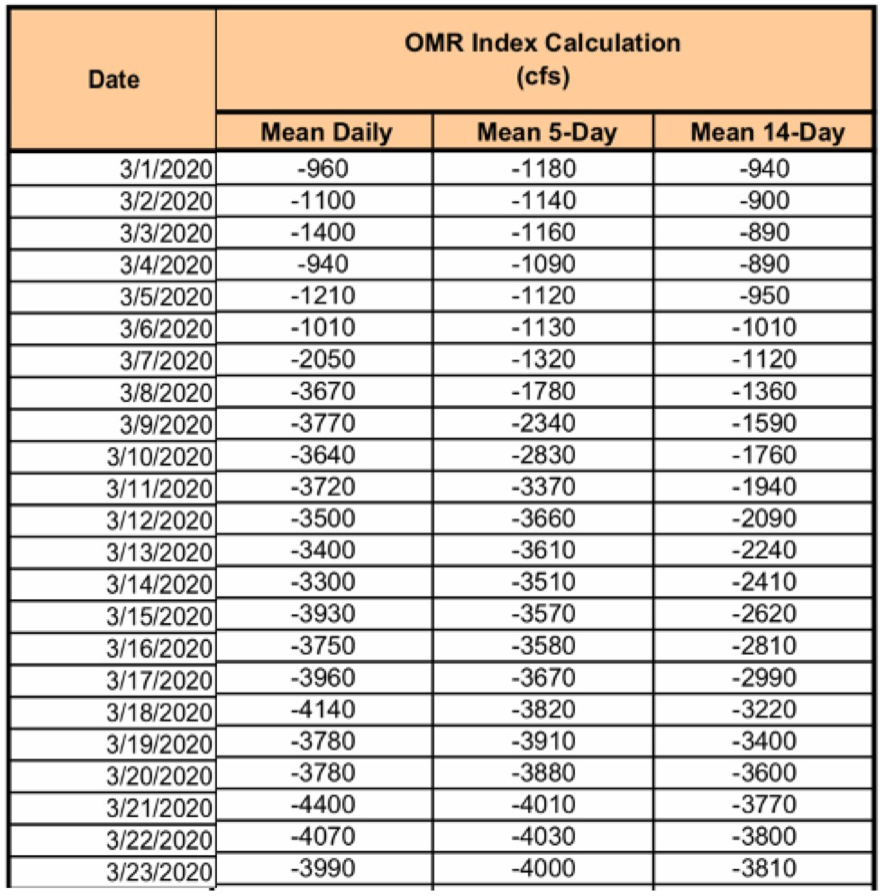
A nice spurt of Delta inflow and outflow occurred during mid-March 2020 (Figure 1). In past dry winters, this would have been a life saver for many juvenile salmon and smelt in the Delta. But this March brought no miracles for Delta fish. Without new rules for the State Water Project (SWP), the Project’s Banks pumping plant in the south Delta maxed out exports (Figure 2), just like the SWP did after last December’s storms.1  March exports have been just below the maximum export-to-inflow (E/I) ratio allowed by the State Water Board (35%). From 2009 through 2019, the state’s incidental take permit (ITP)2 limited exports by restricting negative flows in Old River and Middle River (OMR restrictions) to protect the state-listed longfin smelt and Delta smelt. Not so in the winter of 2020.

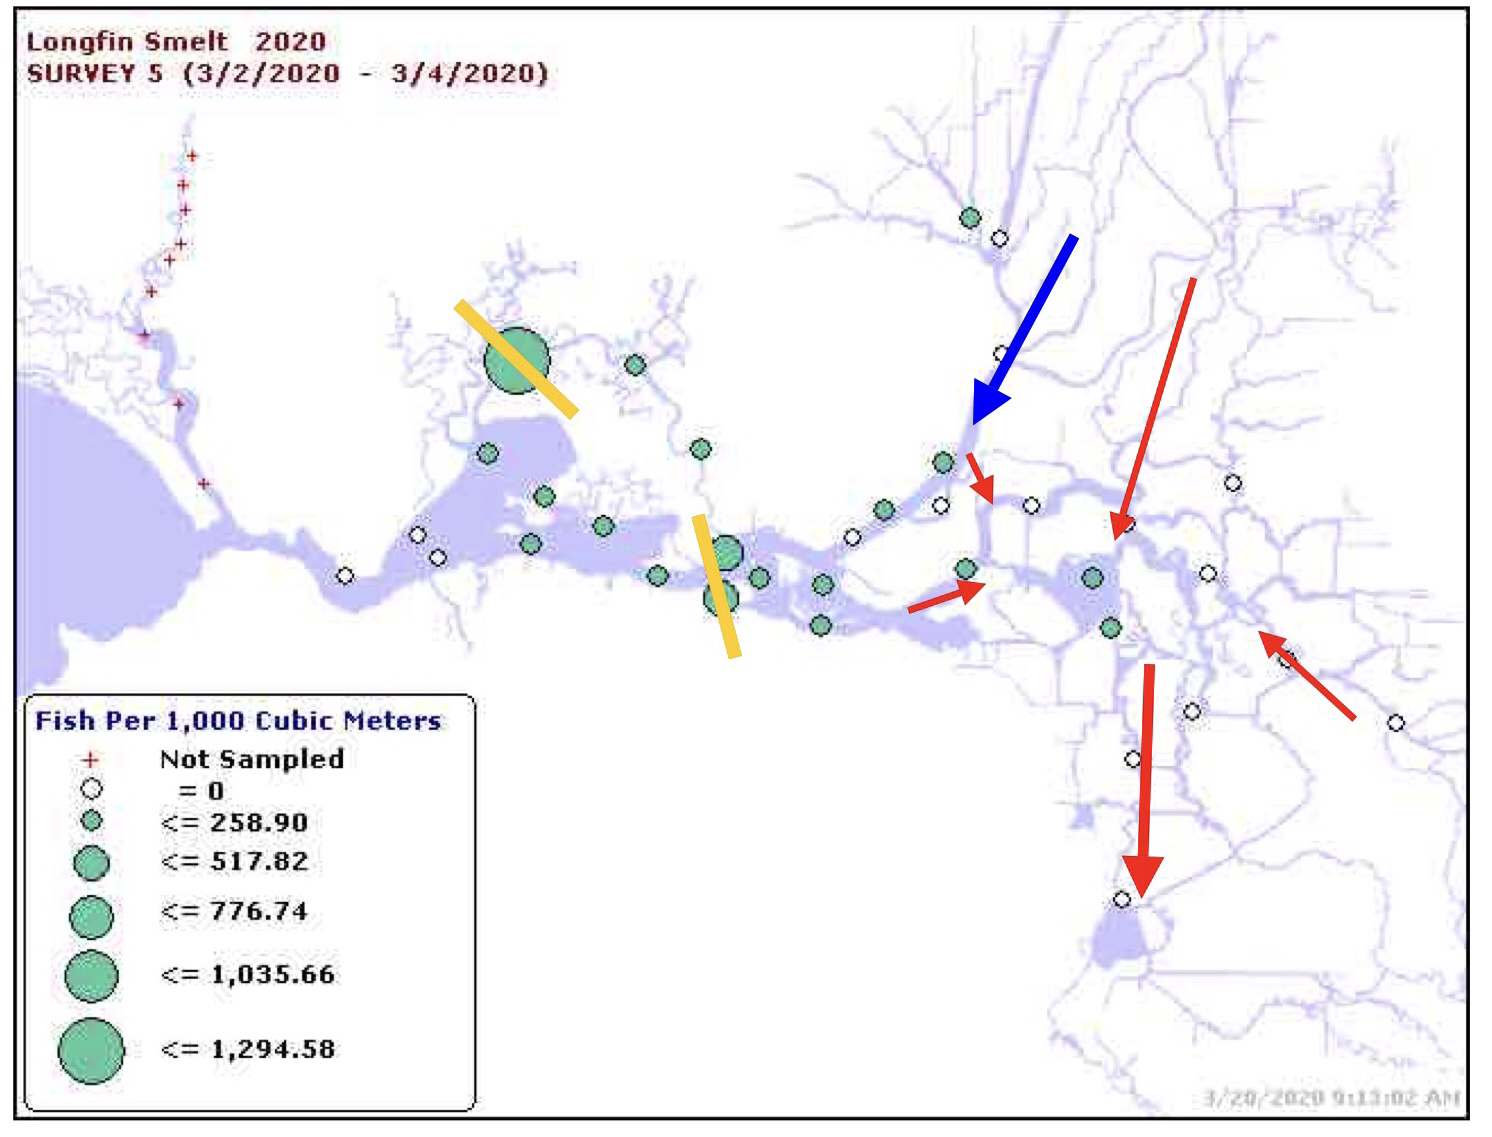
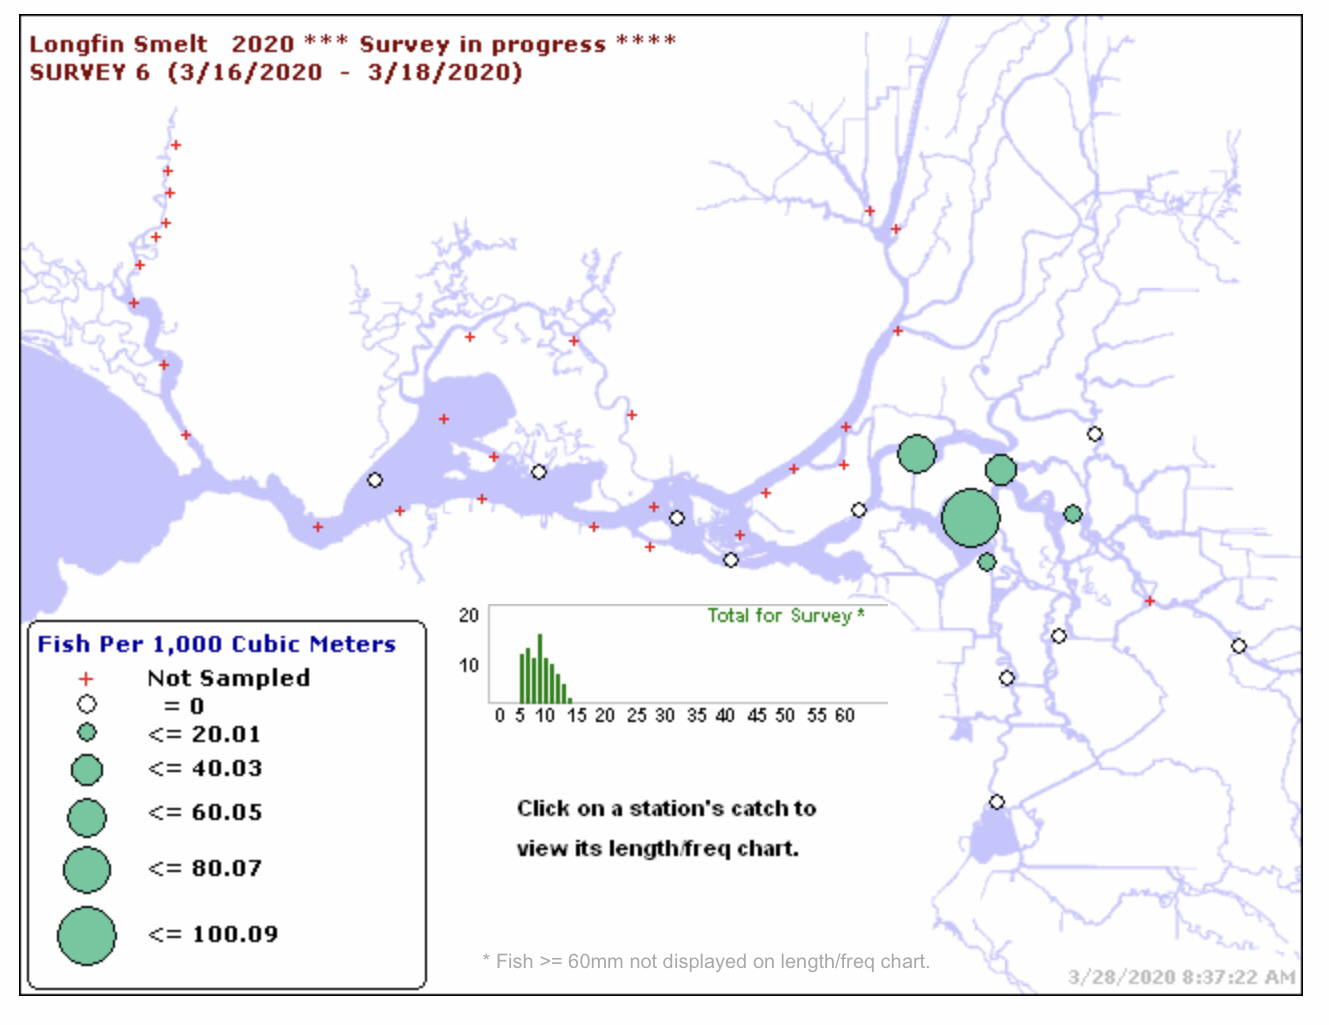
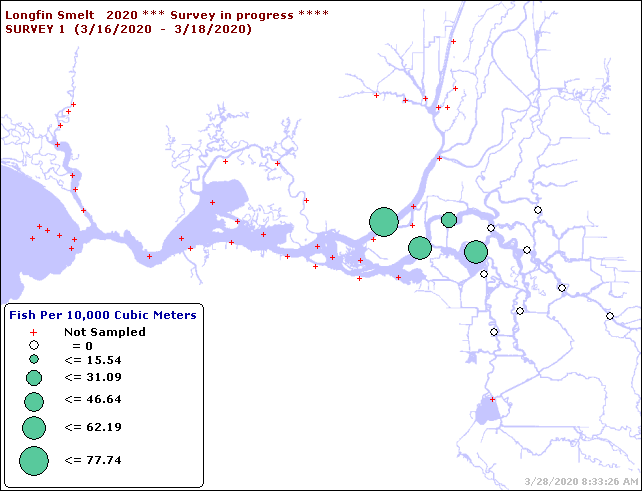
Longfin smelt need more protection. See Figures 3-7. In the past, March 2020 conditions would have been termed high risk by the Smelt Working Group. But the Smelt Working Group disappeared while the new federal Biological Opinions for Delta operations were making their entrance in late 2019. Although managers often ignored the recommendations of the Smelt Working Group, there was at least some outside technical documentation and accountability.

Meanwhile, the state’s soon-to-be-released new ITP looks like it will divert the discussions that the Smelt Working Group used to have to an in-house colloquy between the Department of Water Resources and the Department of Fish and Wildlife. The ITP also has provisions to allow more negative OMR’s and thus higher levels of exports during storm events. This will make fish in the Delta more dependent on miracles even as miracles become harder to come by.

Figure 1. March 2020 calculated Delta outflow. Source: CDWR.

Figure 2. March 2020 Delta exports. TRP = Federal Tracy Plant. HRO = state Harvey Banks Plant.

Figure 3. Early March 2020 Larval Survey for Longfin Smelt. Yellow denotes X2 location. Blue arrow denotes positive downstream Sacramento River channel flow. Red arrows denote interior Delta net flow direction. Pattern indicates risk to Longfin Smelt.

Figure 4. Mid March 2020 CDFW Larval Survey – partial survey results for longfin smelt.

Figure 5. Mid March 2020 CDFW 20-MM Survey – partial survey results for longfin smelt.

Figure 6. March 2020 Old and Middle River combined daily average flows in Central Delta. Source: USBR.

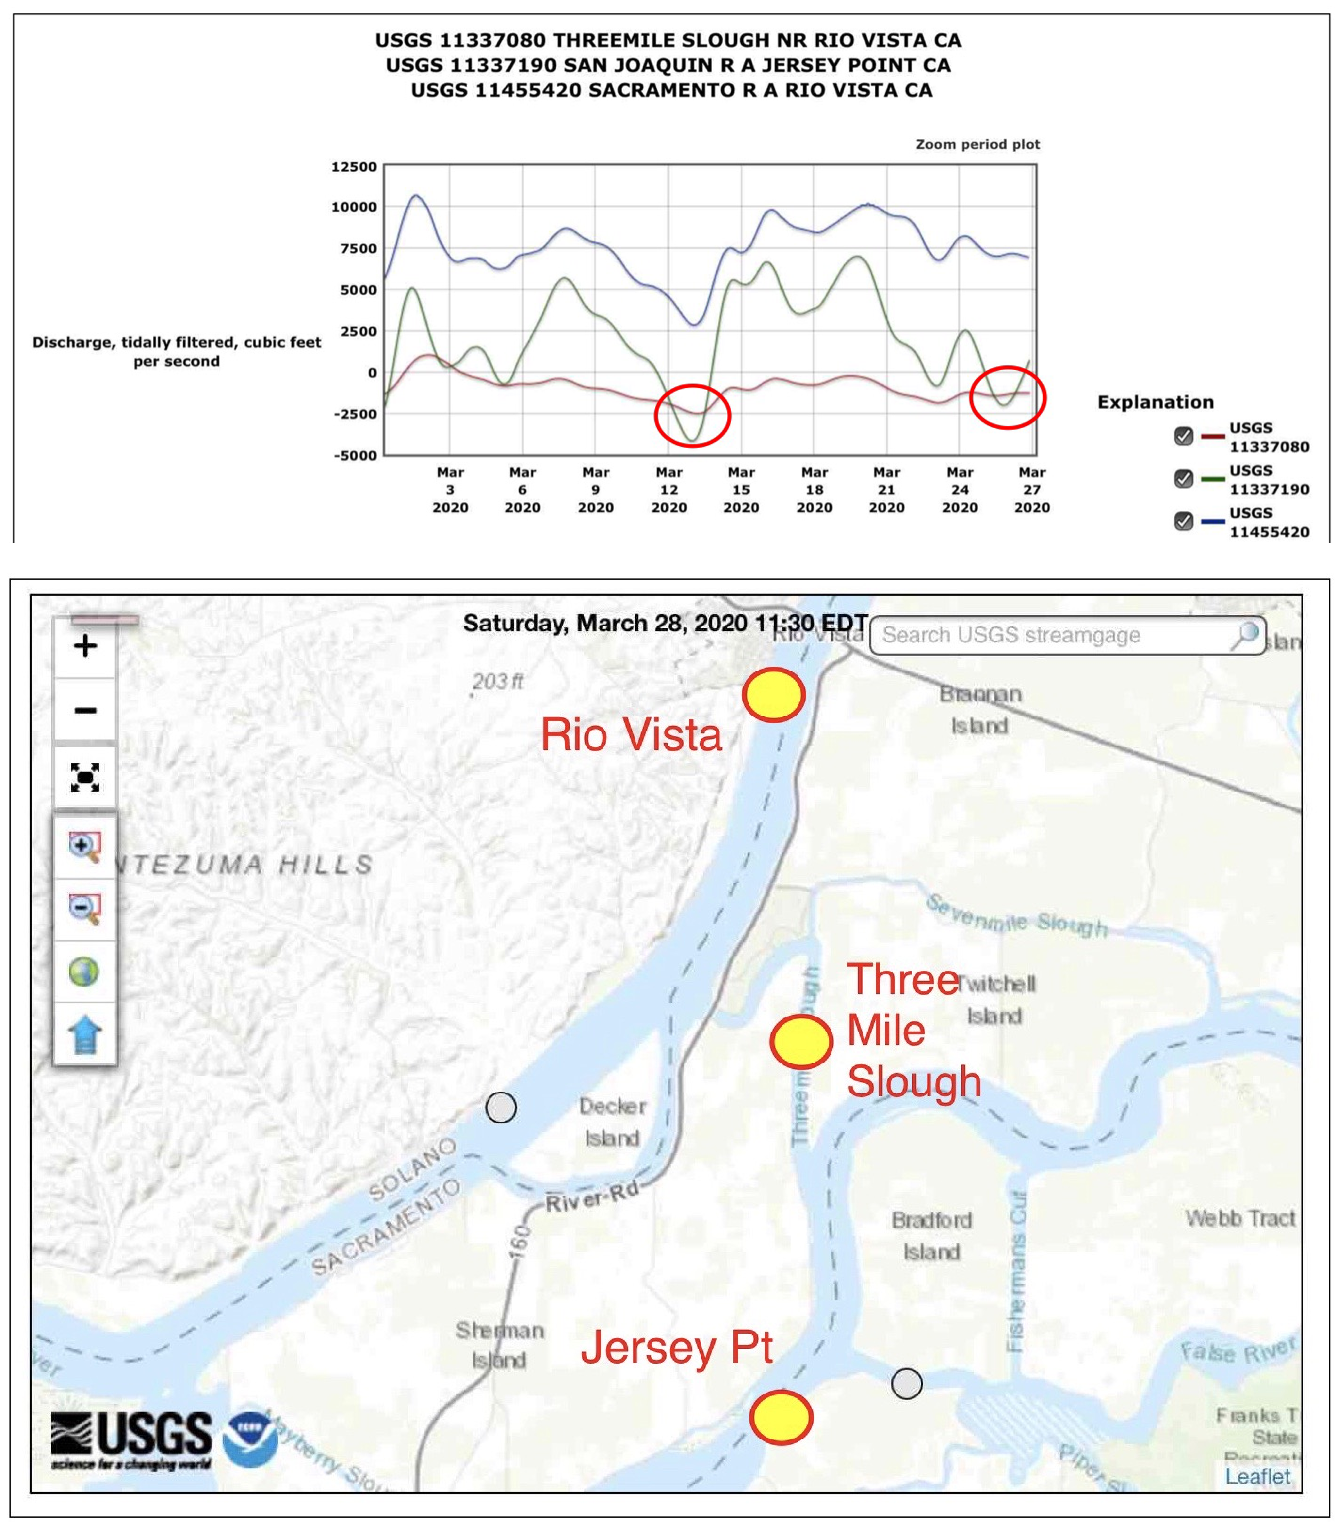
Figure 7. March 2020 tidally-filtered flows at three Delta locations that represent net Delta outflow. Note mid-March outflow (sum of three) was negative for several days. Source: USGS.

How Protective is the State’s Plan for Delta Fishes?

California’s Attorney General has sued the federal government over the new federal biological opinions for the operation of the Central Valley Project (CVP) and the State Water Project (SWP). But in fact, the State’s plan for operating the Central Valley operations of the State Water Project is not much better than the Bureau of Reclamation’s federal plan in terms of protecting Delta fish. The State’s plan is built on the same theory that the water projects can divert more water by monitoring fish presence and backing off on diversions when monitoring detects fish. This so-called “real-time operation” was also the foundation of the Department of Water Resources’ (DWR) proposal to protect fish in the 2016-2019 hearings on DWR’s proposed Delta tunnels (“WaterFix”).

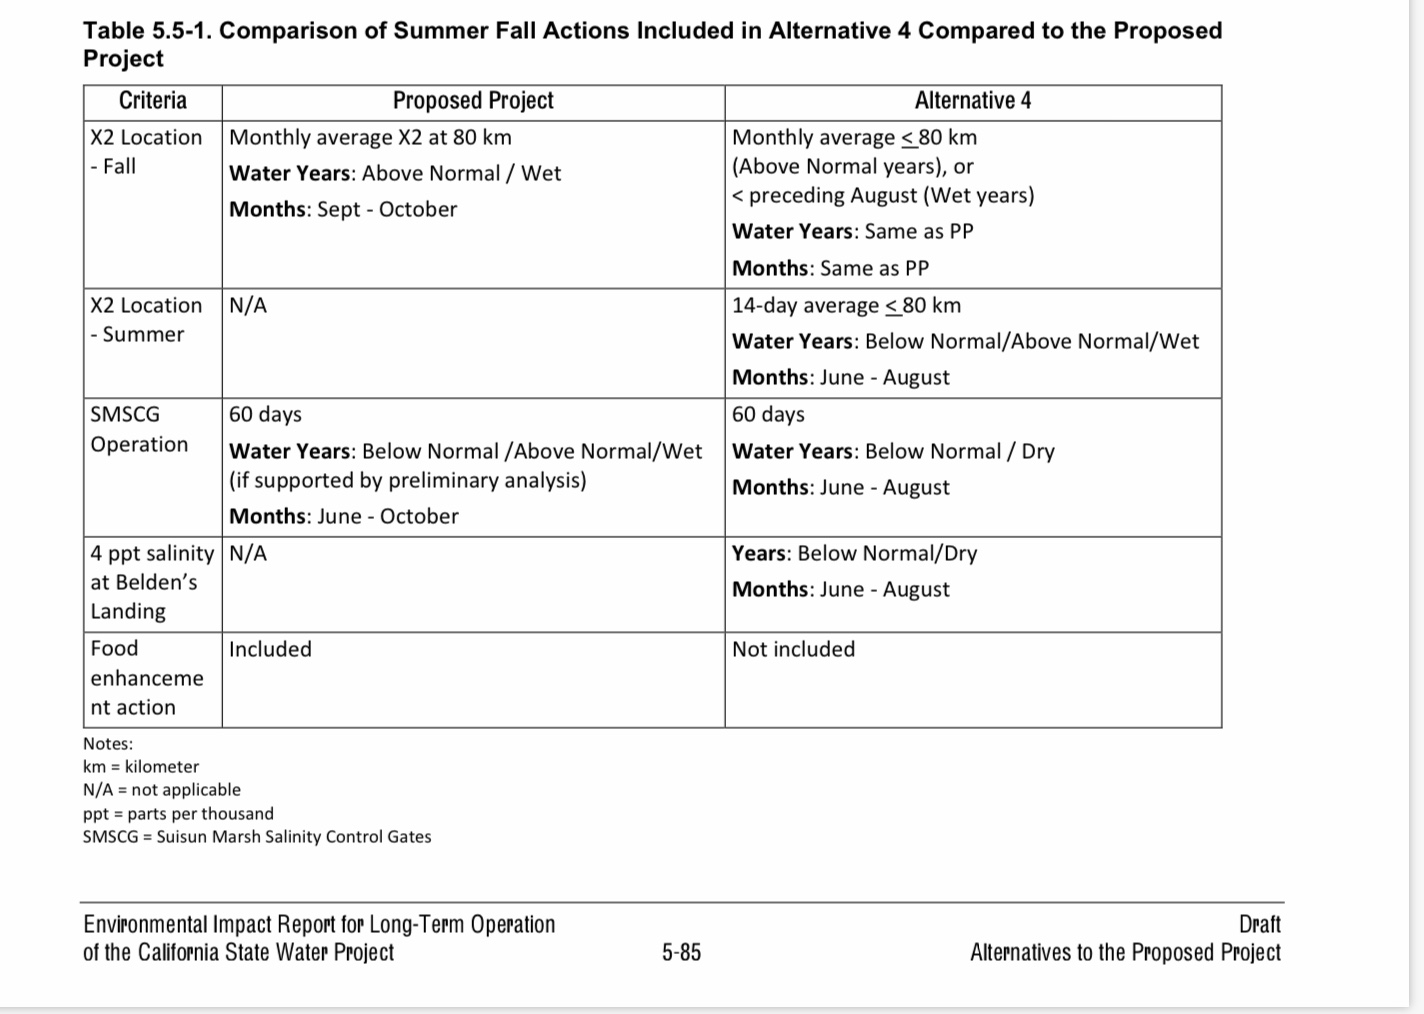
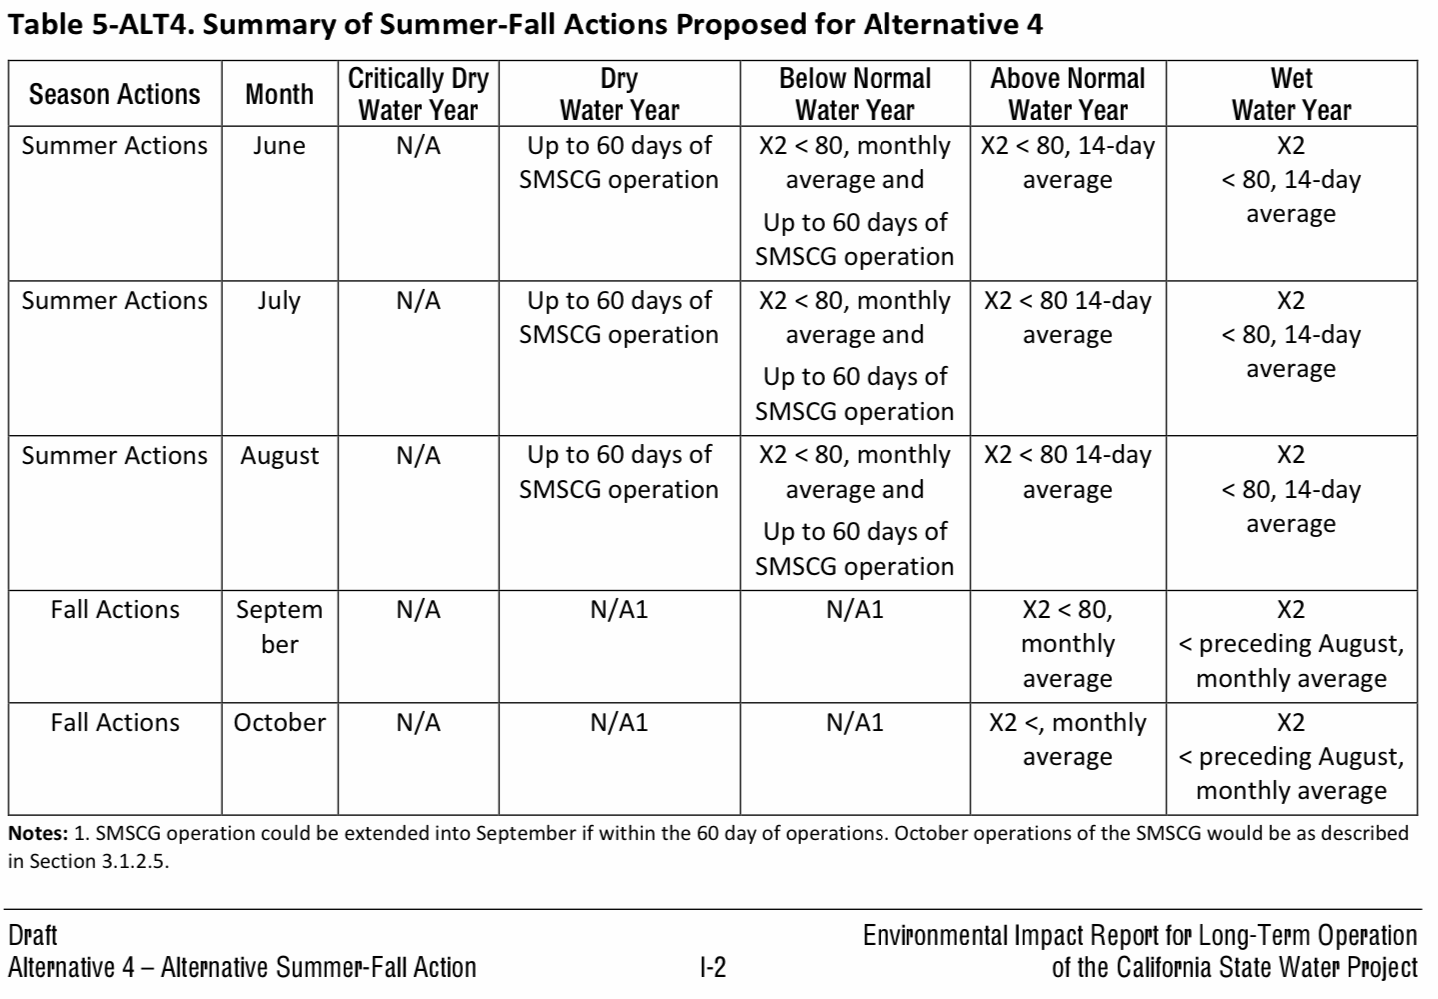
The major difference between the new state and federal plans for Delta operations is that the State plan retains a requirement for increased flow in the summer and fall of wetter water years to protect smelt. The State’s draft EIR for the Long Term Operation of the State Water Project (LTO EIR) describes the proposed Summer-Fall X2 Action for Delta outflow (Figures 1 and 2). The action/criteria proposed is to maintain “X2” (the location in the Bay-Delta where salinity measures ~2 ppt chloride, or 3800 EC) under prescribed limits in summer and fall months by water-year type.

The LTO EIR describes two alternatives: the Proposed Project and Alternative 4.1 Both would limit monthly average or 14-day average X2 at river kilometer 80 (near the CDEC Collinsville gage). The Proposed Project includes only September and October X2 objectives, while Alternative 4 also covers June-August for wet years. Under both alternatives, criteria also include opening the Suisun Marsh Salinity Control Gates (SMSCG), an action to reduce EC at Collinsville gage and in Suisun Marsh and Montezuma Slough, which would raise salinity in eastern Suisun Bay.

I discussed the ramifications of the federal Biological Opinions in a September 2019 post. The only major beneficial change that the LTO EIR proposes is adding summer X2 criteria in Alt 4 to extend outflow protection from June 20 to August 31. The new Fall X2 requirement (September-October) in the LTO EIR would be less protective than existing Fall X2 objectives, because the new state requirement would move the compliance point upstream from km74 to km80.

In order to understand how the state’s proposed new Summer-Fall X2 requirement would work, I examine below how the action might have applied in recent water years 2016-2019, two below normal water years and two wet water years..

Below Normal Water Years 2016 and 2018

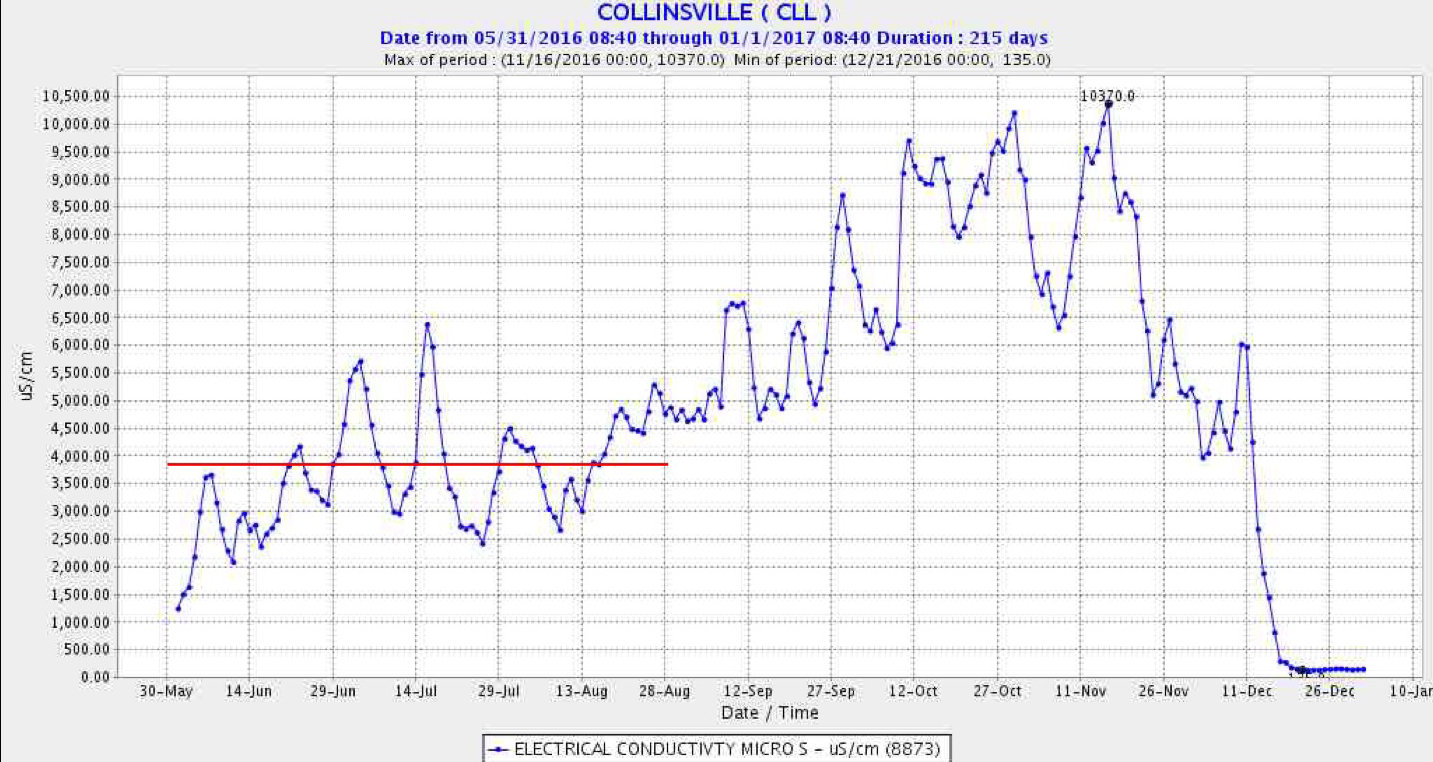
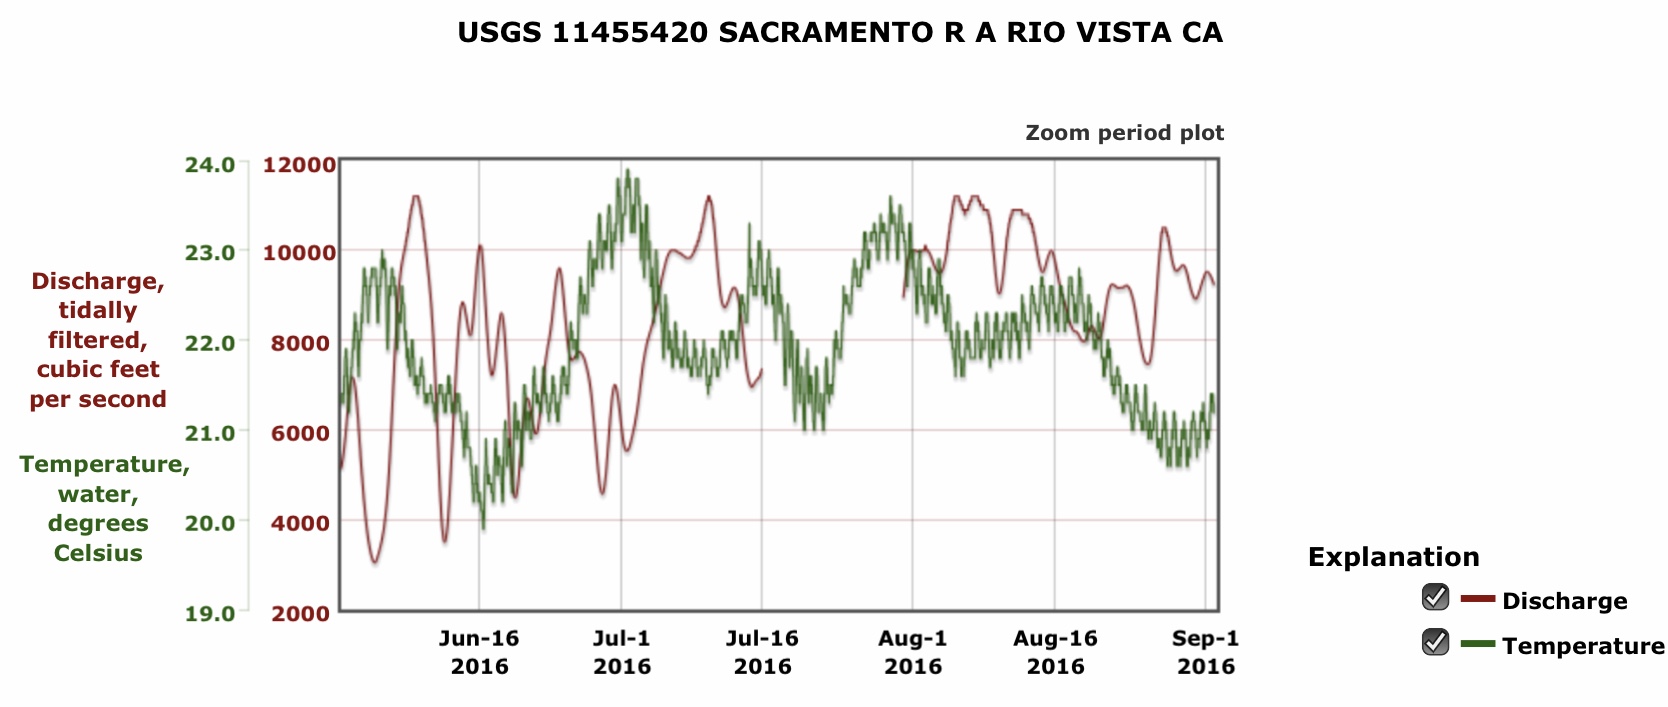
Under the LTO EIR criteria (both the Proposed Project and Alt 4 alternatives), the X2 location and low salinity zone would be similar to historical 2016 conditions (Figure 3), except that outflow could be lower and salinity higher in June, when there would be higher exports, less outflow, and a warmer more upstream low salinity zone (Figure 4). The main benefit of the X2 Action under Alt 4 would be that it would extend the D1641 agricultural salinity standards past June 20 by making them also apply from June 20 through August. Both the D1641 and Alt 4 criteria allow significant daily variation in X2: 14-day and monthly averages.

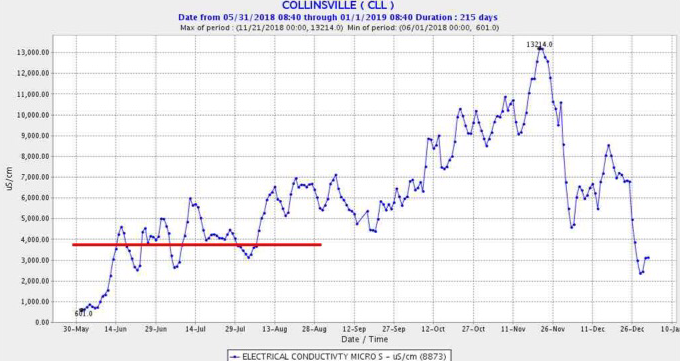
In 2018 (Figure 5) there would be a similar potential negative effect in June and a positive benefit in August under Alt 4.

Wet Water Years 2017 and 2019

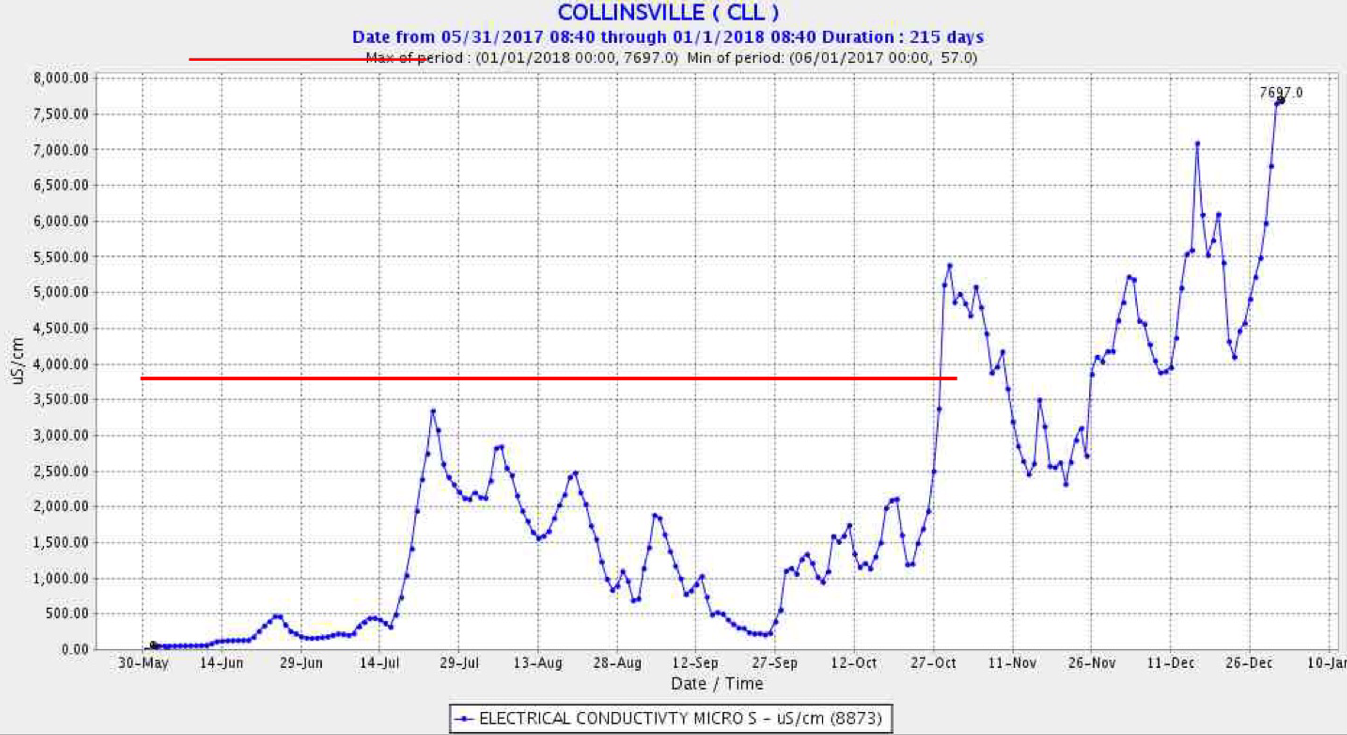
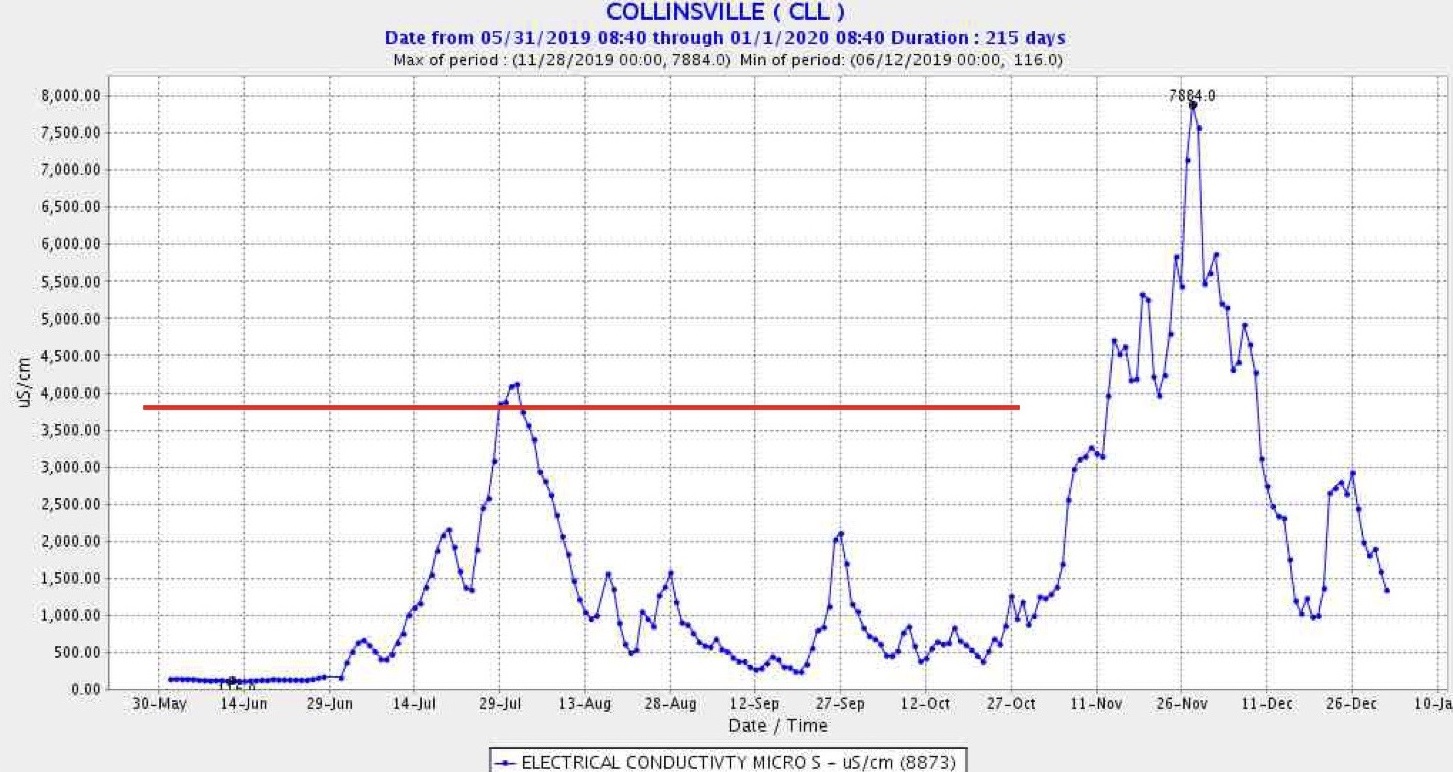
Under the proposed LTO EIR criteria for wet years, Fall X2 criteria (September-October) would be the same as described above for below normal years. This would weaken protection in comparison with the previous Fall X2 requirements in the 2008-09 biological opinions (Figures 6 and 7). Summer (June-August) criteria would be generally less protective than existing D1641 salinity standards for wet years. If the State were to adopt the LTO EIR summer criteria, salinities would be higher and the low salinity zone further upstream and warmer than occurred in June-August of wet years 2017 and 2019. This would allow higher exports.

Summary and Conclusion

Under both the Proposed Project and Alternative 4, the LTO EIR’s Summer-Fall Proposed Plan for Delta outflow (Figures 1 and 2), Delta outflows would be lower, south Delta exports would be greater, and the low salinity zone further upstream and warmer in the fall (Sep-Oct) of wet years. Such changes would be highly detrimental to salmon and smelt. In below normal years, outflows may be higher from June 20 through August under Alt 4. Such changes would be beneficial to salmon and smelt.

Operation of the SMSCG would lower EC at Collinsville and in Montezuma Slough and increased EC in eastern Suisun Bay. This would be detrimental to smelt rearing in Suisun Bay. For more detail on this issue, see http://calsport.org/fisheriesblog/?p=2813.

Overall, the State’s plan would weaken existing X2 compliance criteria and result in higher exports of water from the south Delta in September and October in wet years. Alternative 4 would potentially provide more summer outflow in below normal years, which currently have no summer ag-salinity standard.

Figure 1. Comparison of Summer-Fall actions for the Proposed Project and Alternative 4.

Figure 2. Proposed Summer-Fall Actions in LTO EIR Alternative 4 (Table 5, p I-2 in EIR).

Figure 3. Collinsville EC in below-normal water year 2016. Salinity (EC) at Collinsville (~km 80) June-Dec 2016, a below normal water year. Red line shows proposed monthly-average EC objective in Alt 4.

Figure 4. Summer water temperature at Rio Vista in northwest Delta in 2016. Note in early summer water temperatures tend to be higher in the lower range of net river flow and high seasonal tides.

Figure 5. Salinity (EC) at Collinsville (~km 80) June-Dec 2018, a below normal water year. Red line shows proposed monthly-average EC objective proposed only in Alt 4.

Figure 6. Salinity (EC) at Collinsville (~km 80) June-Dec 2017, a wet water year. Red line shows proposed monthly-average or 14-day EC objectives in the Proposed Project and Alt 4.

Figure 7. Salinity (EC) at Collinsville (~km 80) June-Dec 2019, a wet water year. Red line shows proposed monthly-average or 14-day EC objectives in the Proposed Project and Alt 4.


  1. According to the description in the EIR, Alternative 4 is a more smelt-friendly alternative than the Proposed Project.

Winter 2020 – Salmon need winter flow pulses

In a February 2019 post, I discussed the importance of winter flows for fall-run salmon in the Central Valley. The peak fry emergence from gravel spawning beds is in winter. Millions of fry move to river margins to await flow pulses to carry them from upper main river and tributary spawning grounds to lower river floodplain, Delta, and Bay nurseries. Without such pulses, the fry stay in the cold rivers competing for limited food and habitat, which leads to poor overall survival and fewer smolts reaching the ocean.

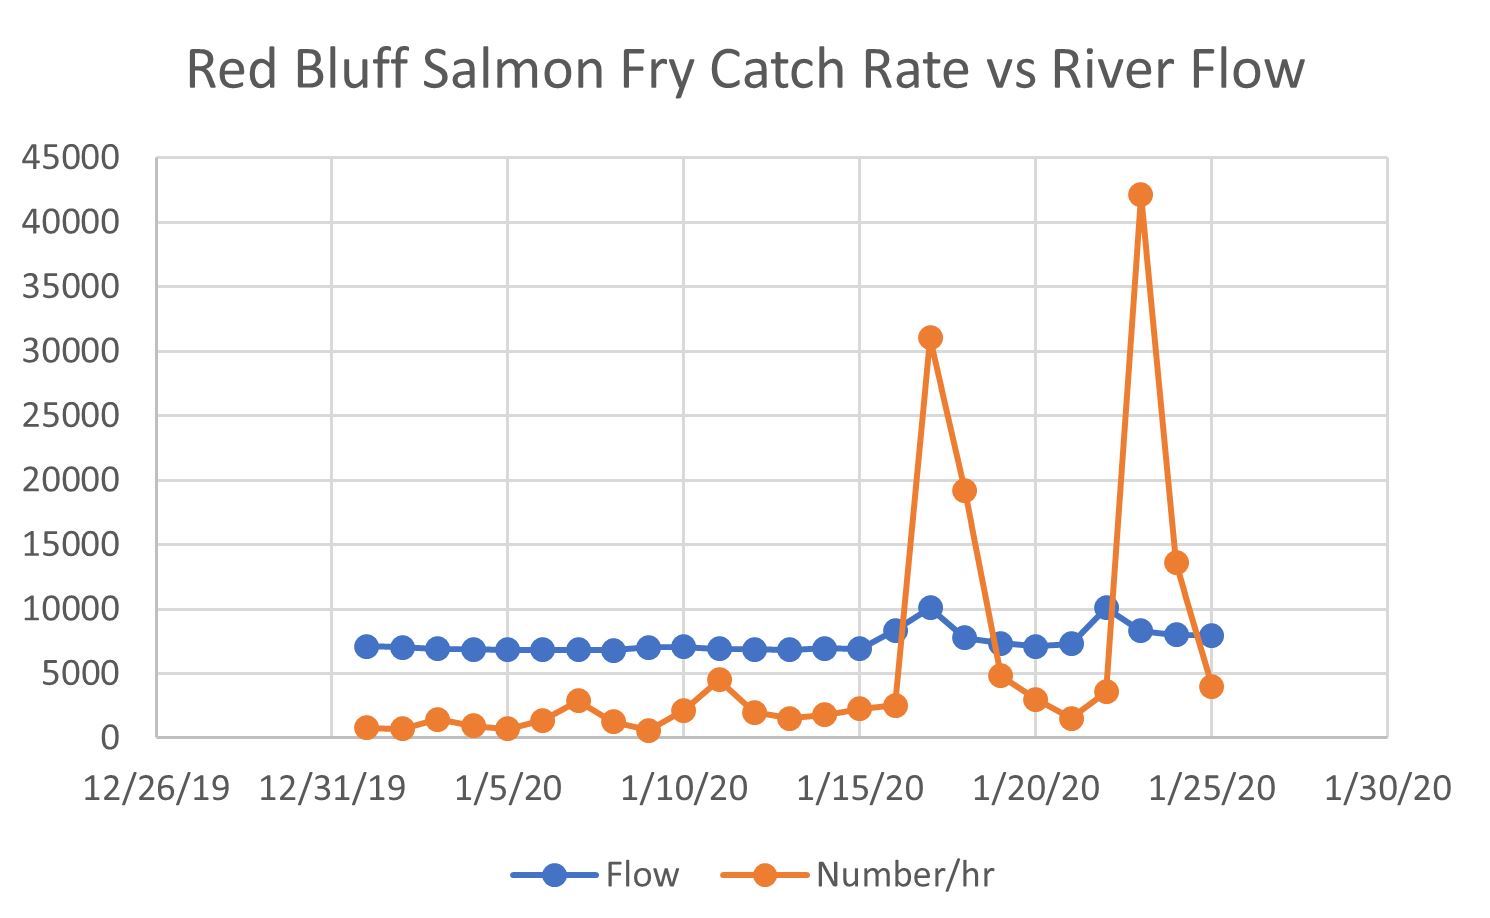
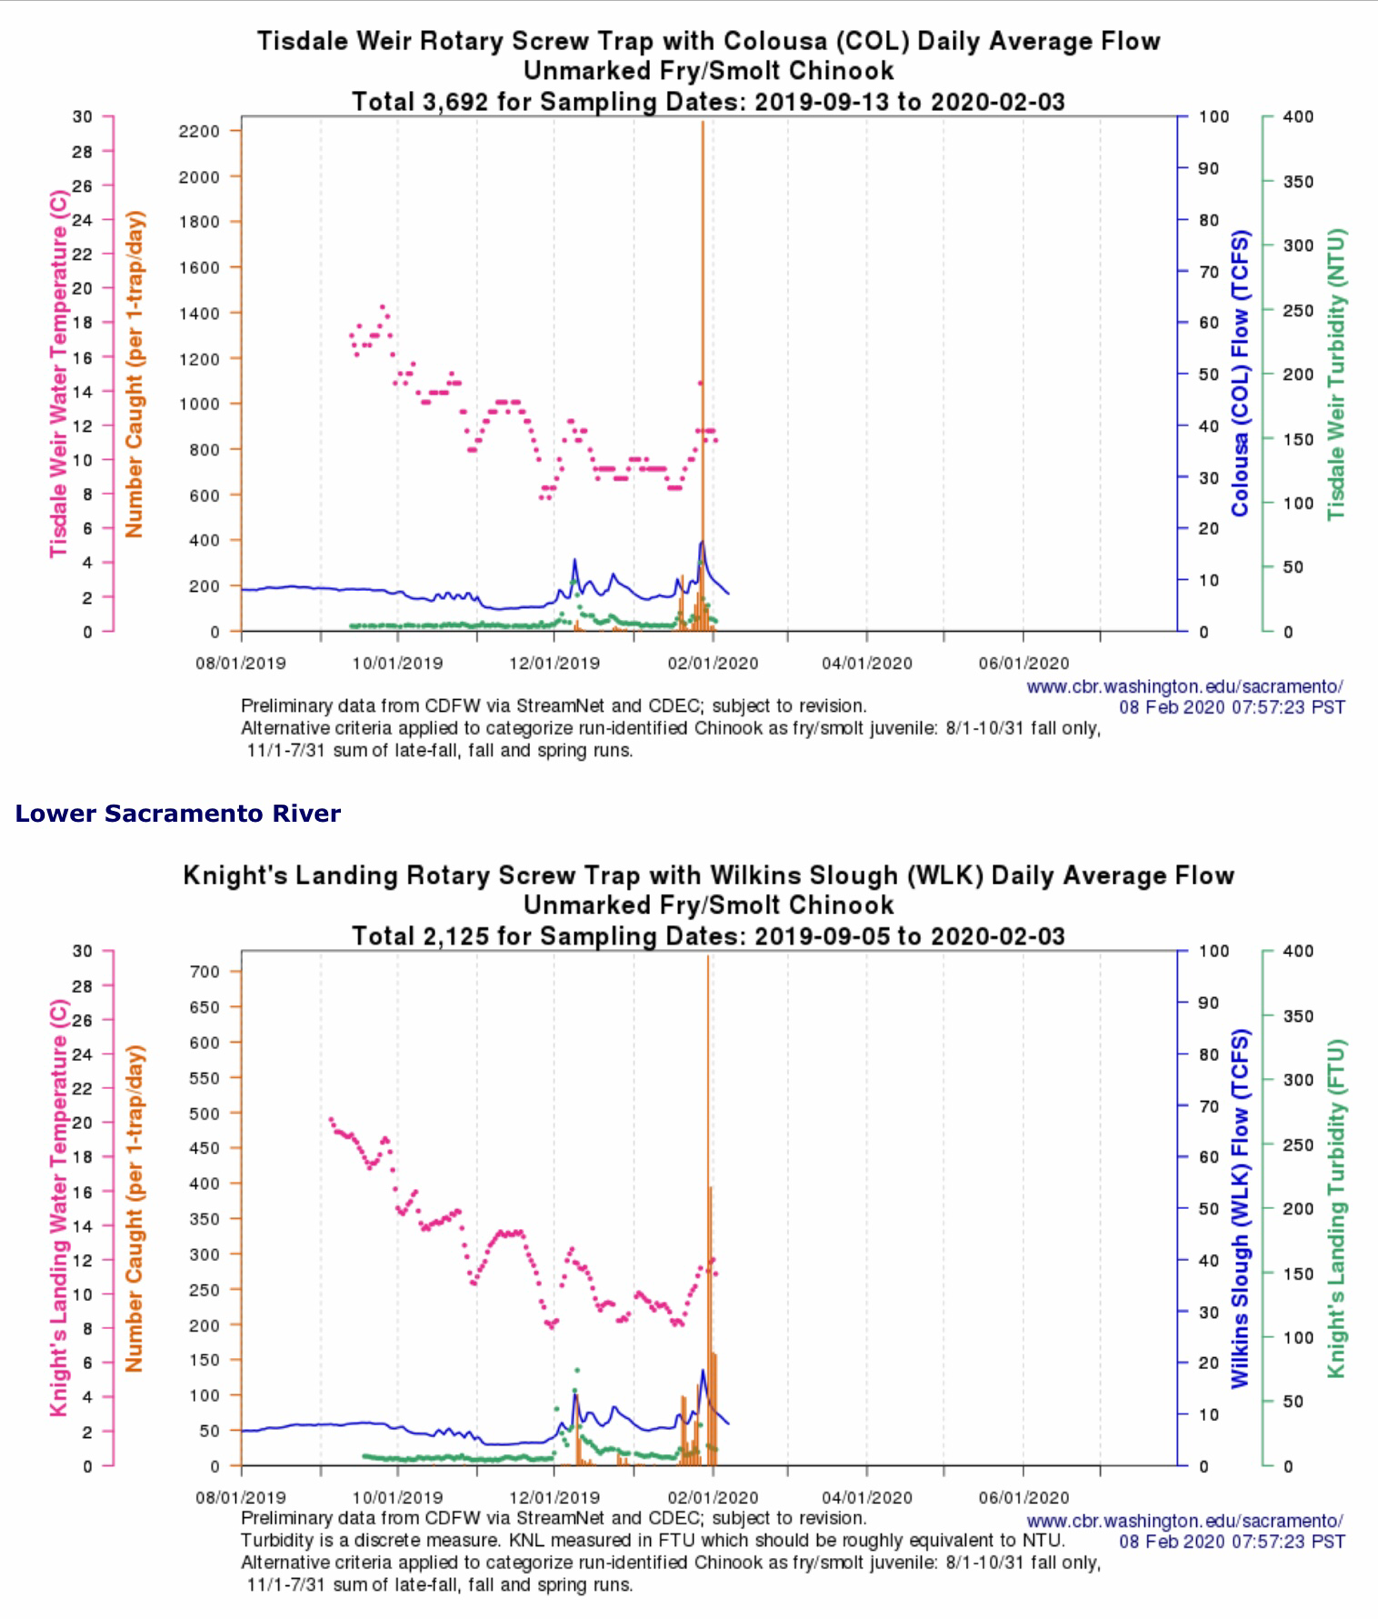
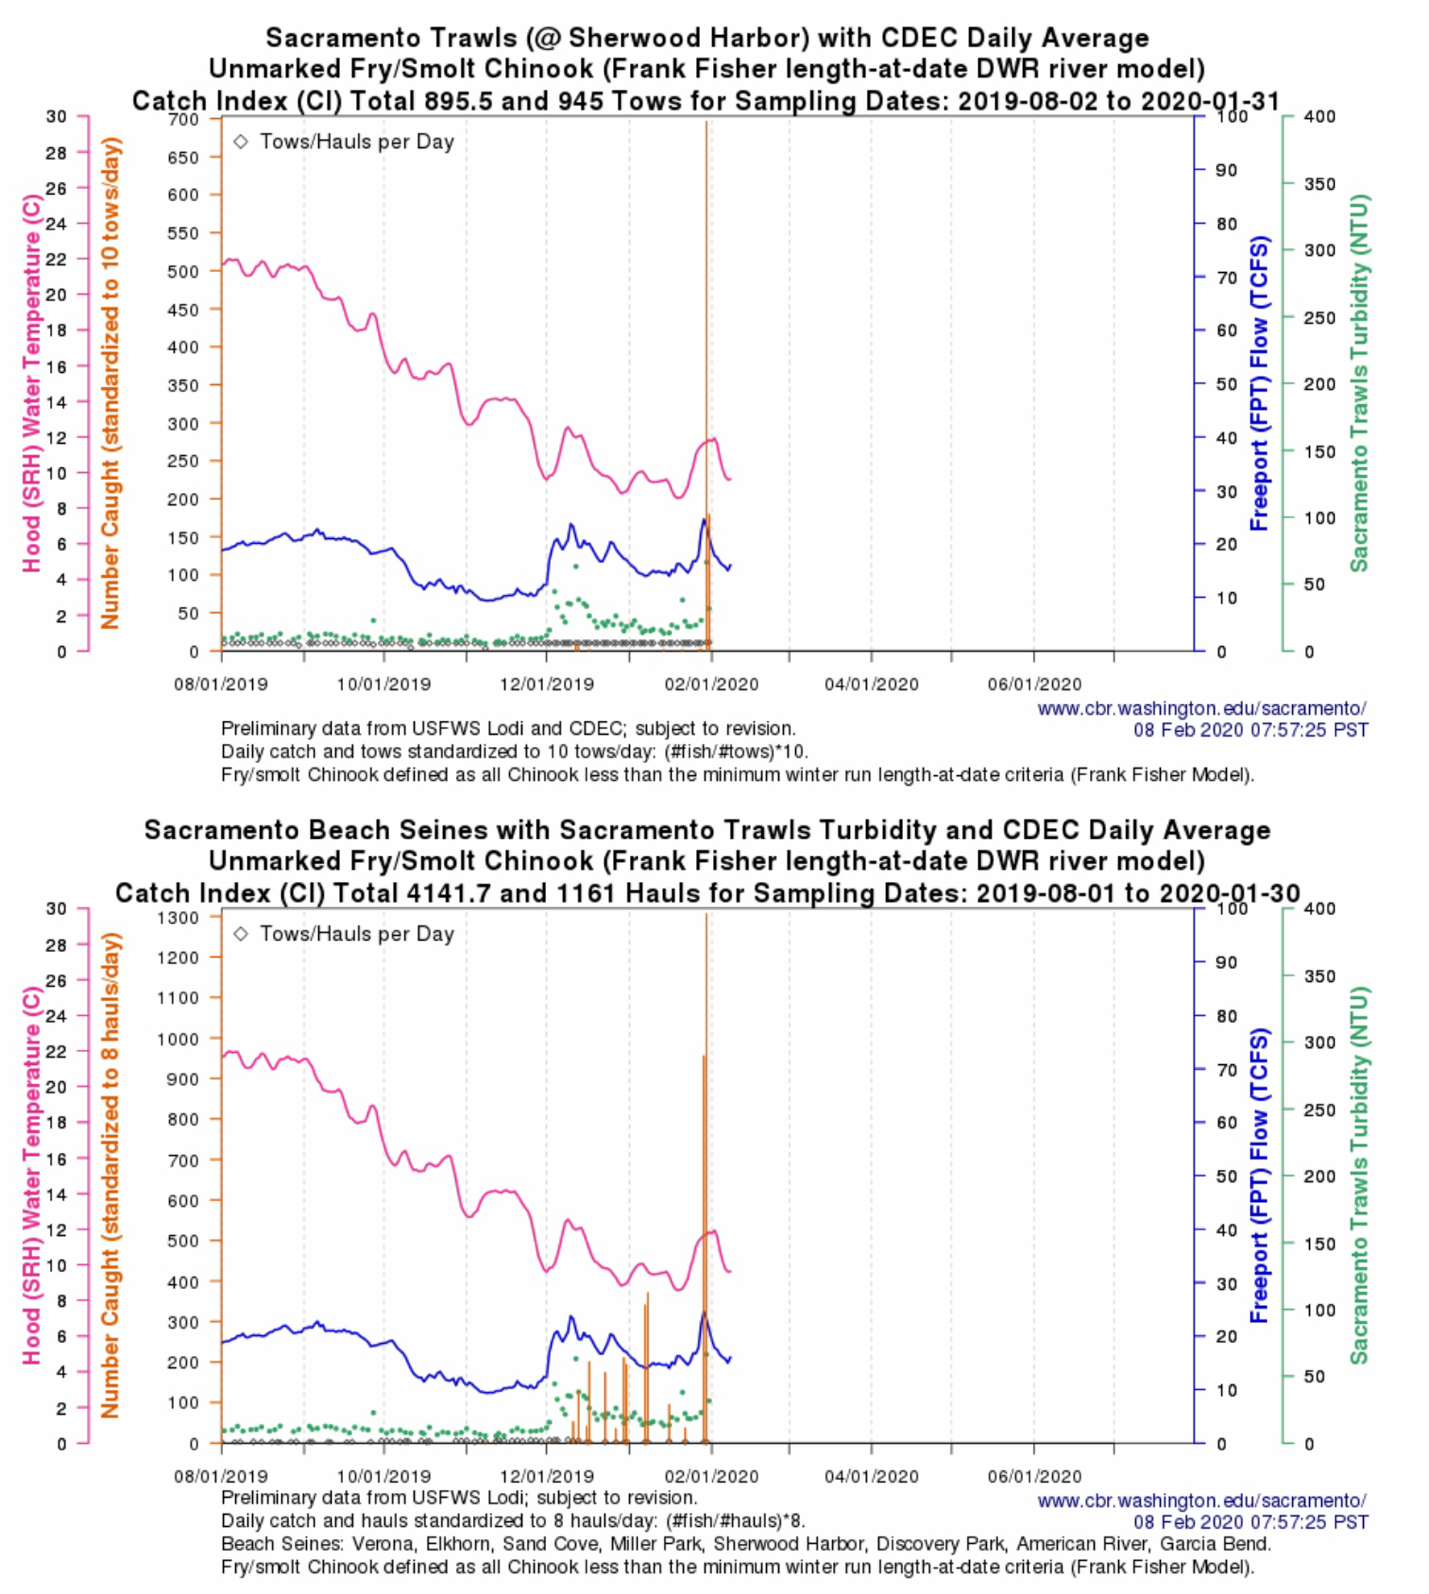
Two January storms in 2020 show the importance of flow pulses for the emigration of fall-run salmon fry (Figures 1-3). Figure 1 shows fry moving downstream from spawning grounds above Red Bluff. Figure 2 shows fry reaching the lower river 100+ miles downstream of Red Bluff. Figure 3 shows fry reaching the north Delta near Sacramento.

What is missing is reservoir releases through tailwater spawning grounds during the storms that create pulses from tributary inflow further downstream. The tributary inflow moves fry downstream from the tributaries. It also moves fry from the mainstem rivers downstream once fry reach the river reaches downstream of the tributaries. But reservoirs capture almost all the flow on the mainstem rivers upstream of the tributaries. During early winter storms, fry aren’t stimulated to move out of the spawning reaches directly downstream of dams.

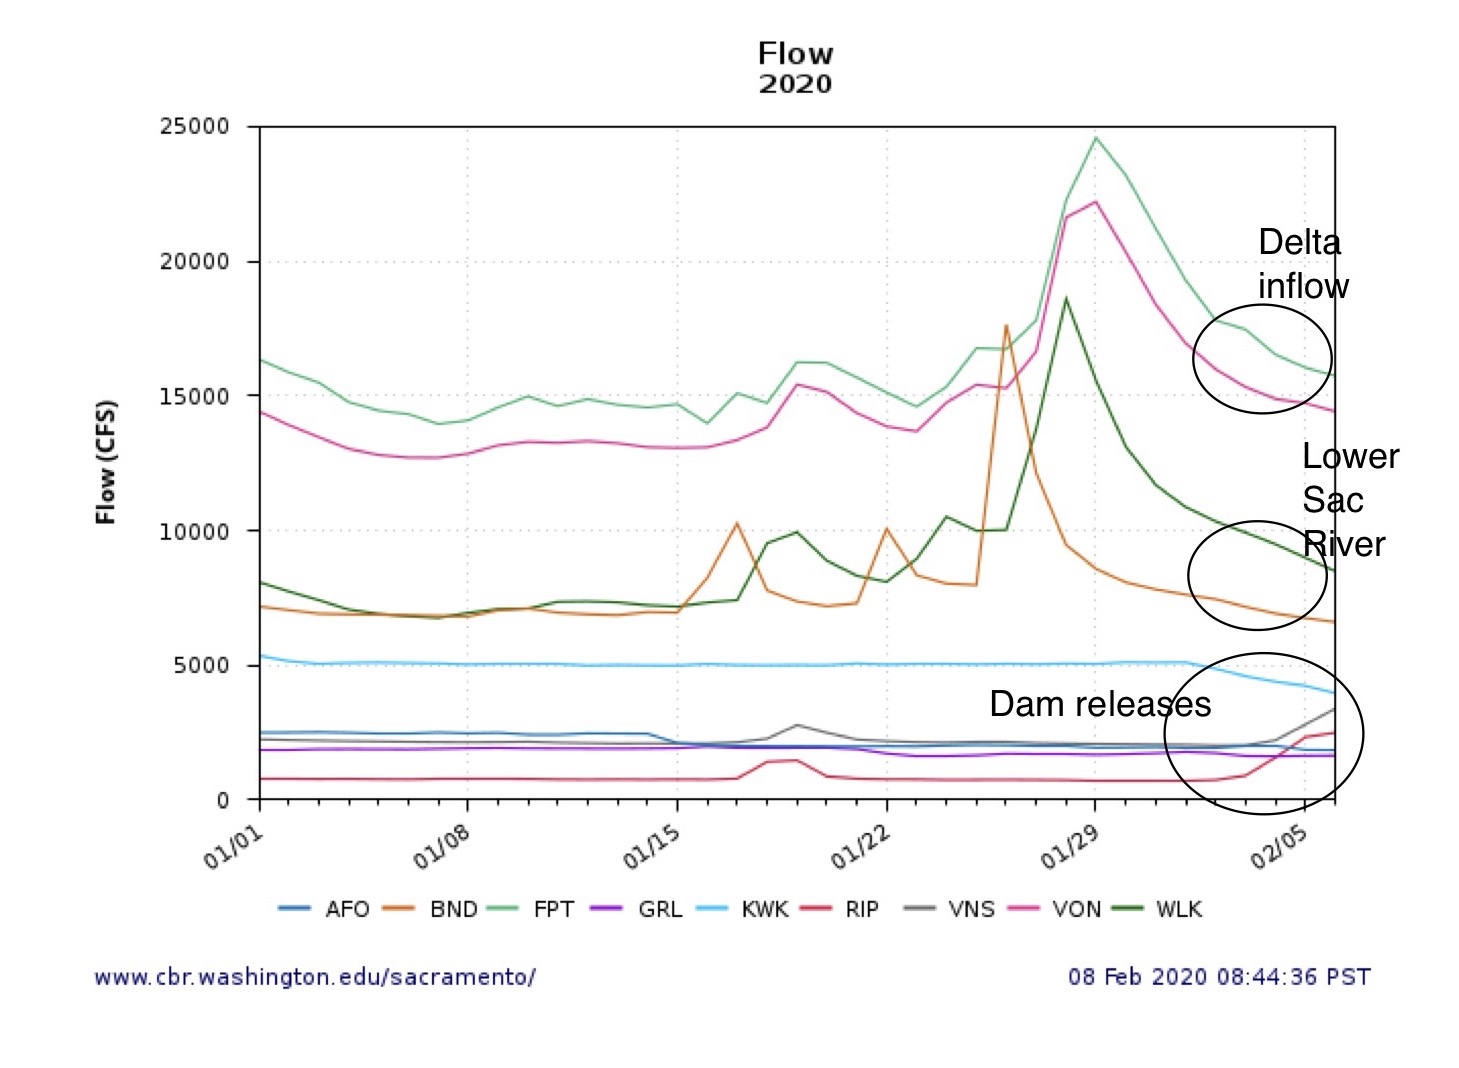
Figure 4 shows the complete lack of such storage releases in 2020, even after a wet water year when storage was well above average. Pulse flows are needed below all the main storage reservoirs: Shasta, Whiskeytown, Oroville, Folsom, Bullards Bar, Camanche, New Melones, etc. Fry movement from these prime tailwater spawning grounds would then take advantage of the natural rainfall in the main rivers moving through the Delta and on to the Bay nurseries.

Neither of the recent National Marine Fisheries Service’s (NMFS) consultations and the associated biological opinion with Reclamation on the Central Valley Project promotes such winter flow pulses.1 NMFS mandates spring pulses to help smolts (juveniles that are larger and older than fry) reach the Bay. Spring pulses are important, but they are not enough. While individual smolts are more likely to reach the Bay than individual fry, fry vastly outnumber smolts and should contribute substantially to the adult salmon populations. Winter flow pulses are needed because they will improve the survival to adulthood of wild salmon fry.

For more on the importance of increasing the survival rate of wild salmon fry in the Central Valley, see a recent paper by Sturrock et al. 2019. 2

Figure 1. Catch of salmon fry in screw traps and river flow (cfs) in Sacramento River near Red Bluff, January 2020. Data source: http://www.cbr.washington.edu/sacramento/data/juv_monitoring.html


Figure 2. Screw-trap catch rates for salmon fry and river conditions in lower Sacramento River near Colusa and Knights Landing winter 2020. Source: http://www.cbr.washington.edu/sacramento/data/juv_monitoring.html

Figure 3. Trawl and seine catch rates of salmon fry and river conditions in lower Sacramento River in north Delta near Sacramento winter 2020. source: http://www.cbr.washington.edu/sacramento/data/juv_monitoring.html

Figure 4. Winter 2020 flows in rivers and below dams in Central Valley. Lower Sacramento River: Red Bluff (BND), Wilkins Slough (WLK); Delta inflow at Verona (VON), Freeport (FPT). Dam releases to American River (AFO), Feather River (GRL), Stanislaus River (RIP), Sacramento River (KWK), San Joaquin River (VNS). source: http://www.cbr.washington.edu/sacramento/data/