The 2008 Delta Smelt Biological Opinion for Central Valley Project (CVP) and State Water Project (SWP) includes the Fall X2 provision to keep brackish water west of the Delta through October in wet years to protect Delta smelt. X2 or the low salinity zone is defined as the location where salinity is 2 parts per thousand (about 4000 EC). Keeping X2 at Chipps Island (km 71 from the Golden Gate) benefits the longfin smelt and Delta smelt populations. In wet years, the smelt are protected by Delta agriculture salinity standards through August 15. The Fall X2 provision keeps X2 and the smelt west of the Delta through October.
This is the third wet year since 2008 (the others were 2011 and 2017) in which the provision for X2 in the Biological Opinion has applied. When I last posted about the 2017 implementation, I remarked that the US Bureau of Reclamation had requested not to apply the provision because of the high cost of water and minimal benefit to the smelt populations. In the end, the provision was applied, but in an unusual way that likely had some new negative consequences on smelt and their Bay-Delta critical habitats.
Reclamation has again requested exemption from the provision in wet year 2019. Again, Reclamation referenced the high cost of water and minimal benefits to smelt, despite unequivocal evidence that smelt benefit (Figures 1 and 2).
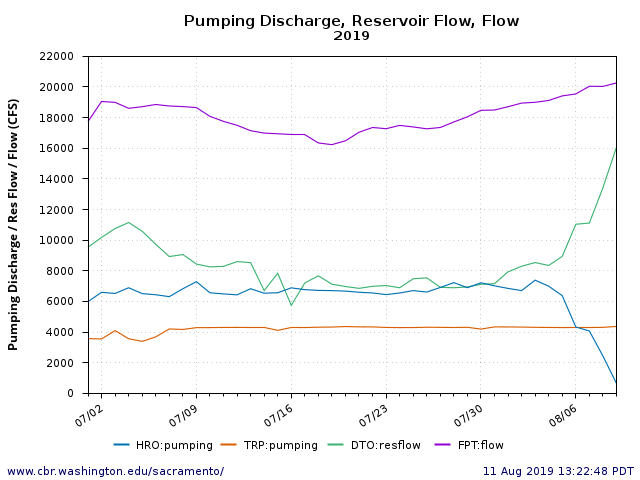
The Fall X2 flows are being applied with extra releases from Shasta, Oroville, Folsom, and New Melones reservoirs (Figure 3). Without the X2 requirement that is creating inflows to the Delta of about 25,000 cfs, Delta inflow would only need to be 15,000 cfs to meet 65% export-to-inflow requirement. With lower reservoir releases, river flows and Delta outflows would be lower at the discretion of Reclamation. In the past, Reclamation has also failed on many occasions to meet water temperature standards in the lower Sacramento River and the American River, as well as south Delta salinity standards.
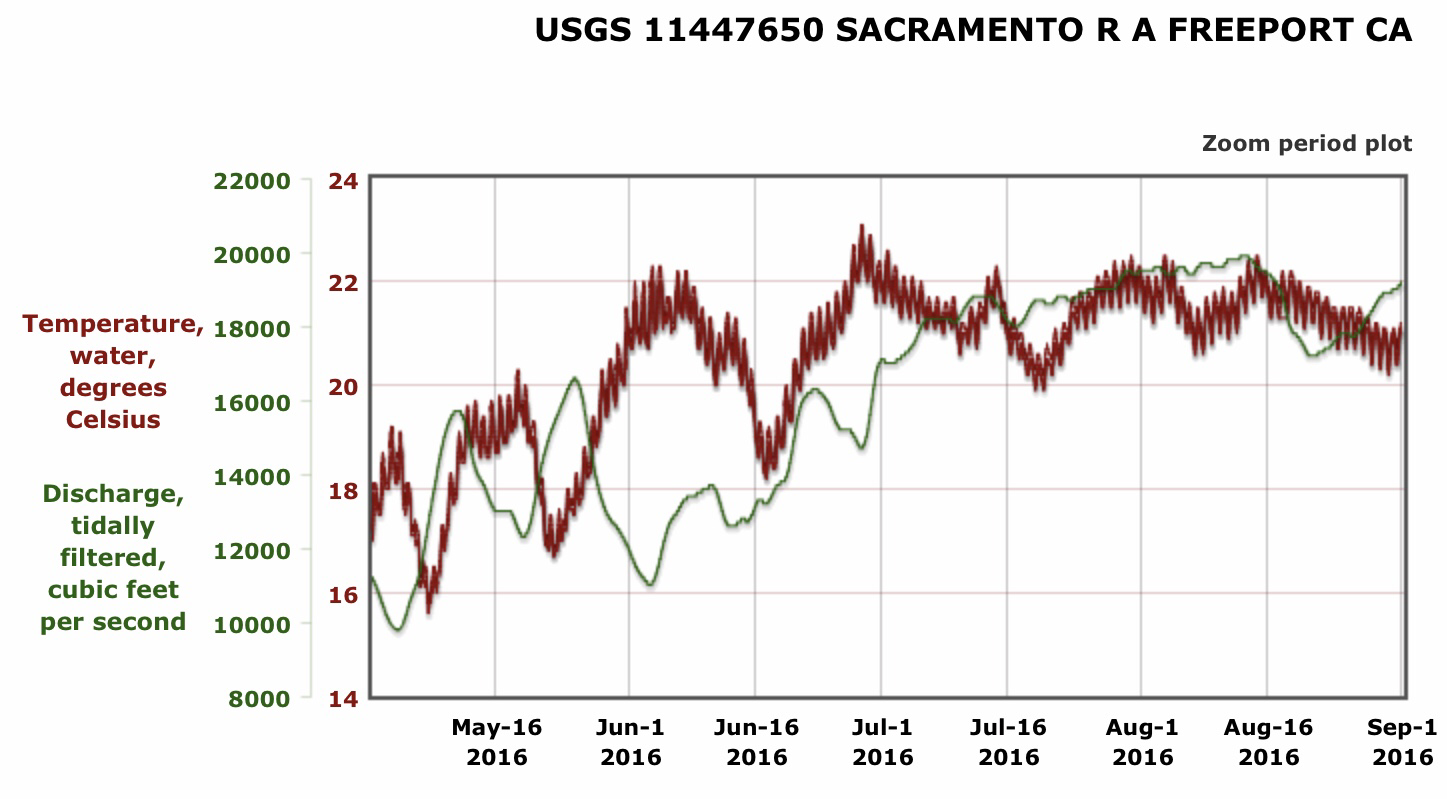
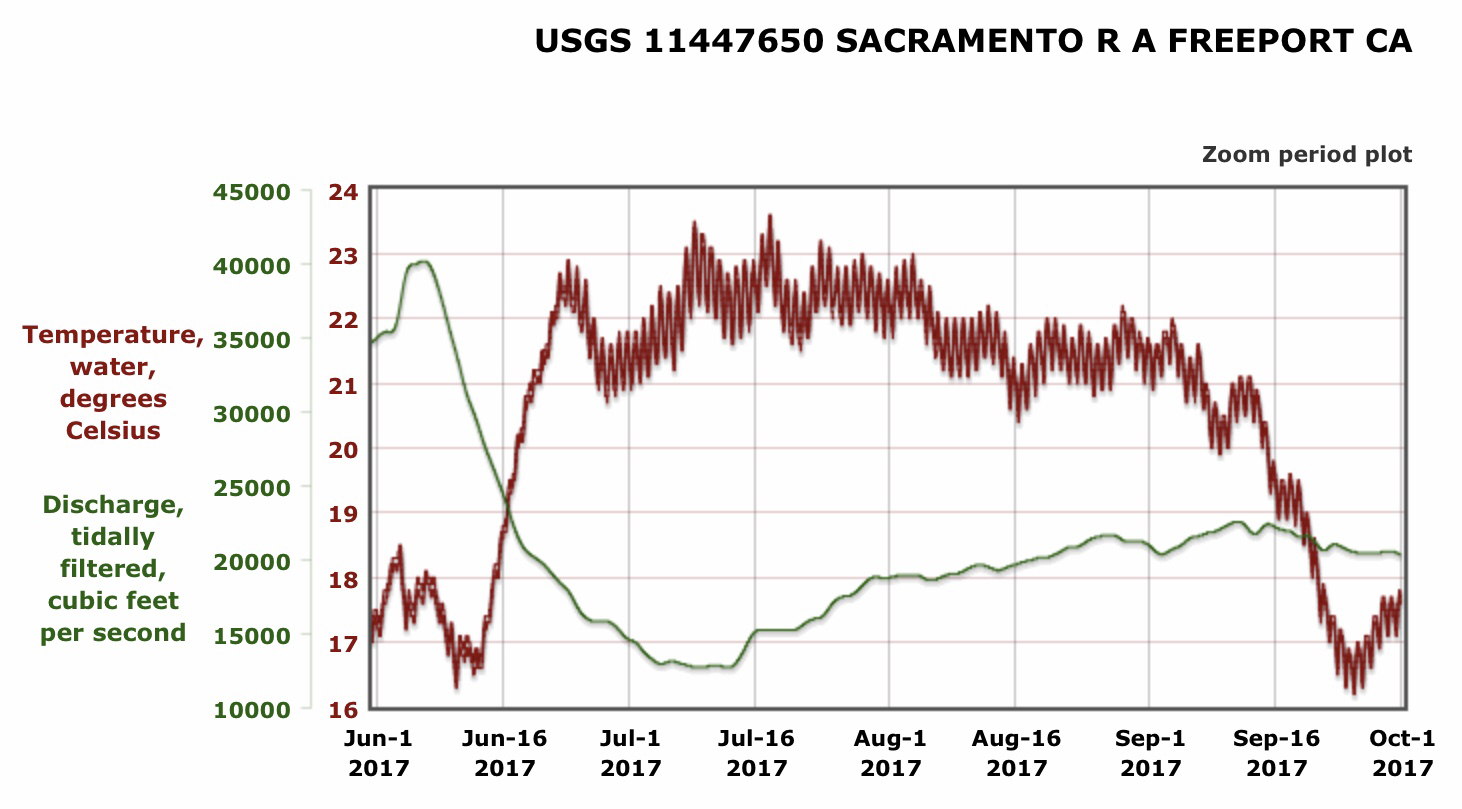
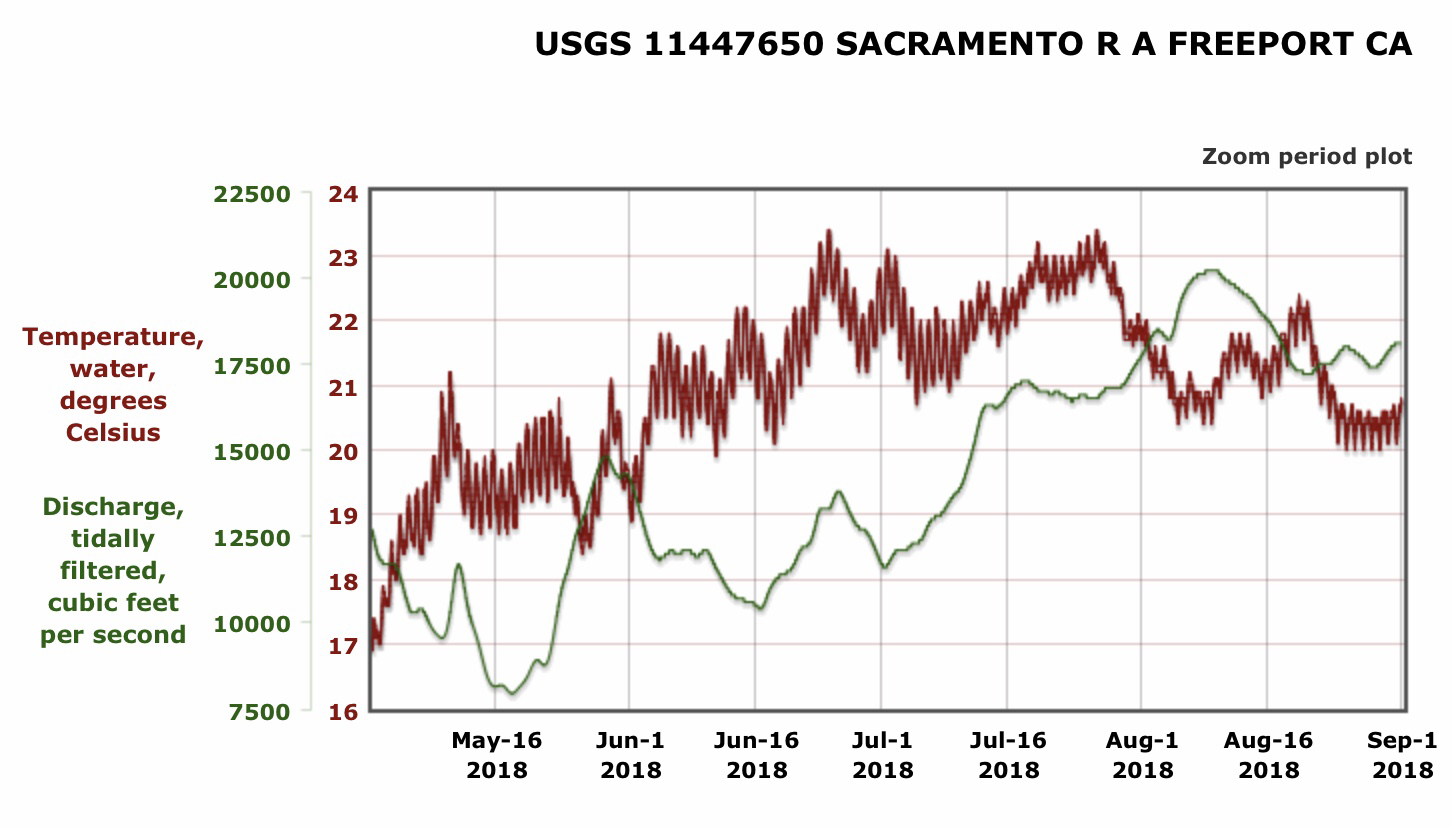
Application of the Fall X2 provision benefits smelt and the fall upstream migration of salmon in the Sacramento and San Joaquin rivers and their tributaries. In Suisun Bay and the western Delta, salinities and water temperatures would be higher without Fall X2 (Figures 4-6). Fall X2 application also helps maintain the water temperature requirements in Reclamation’s water right permits and the water quality standards in the lower Sacramento River between Red Bluff and the Delta.
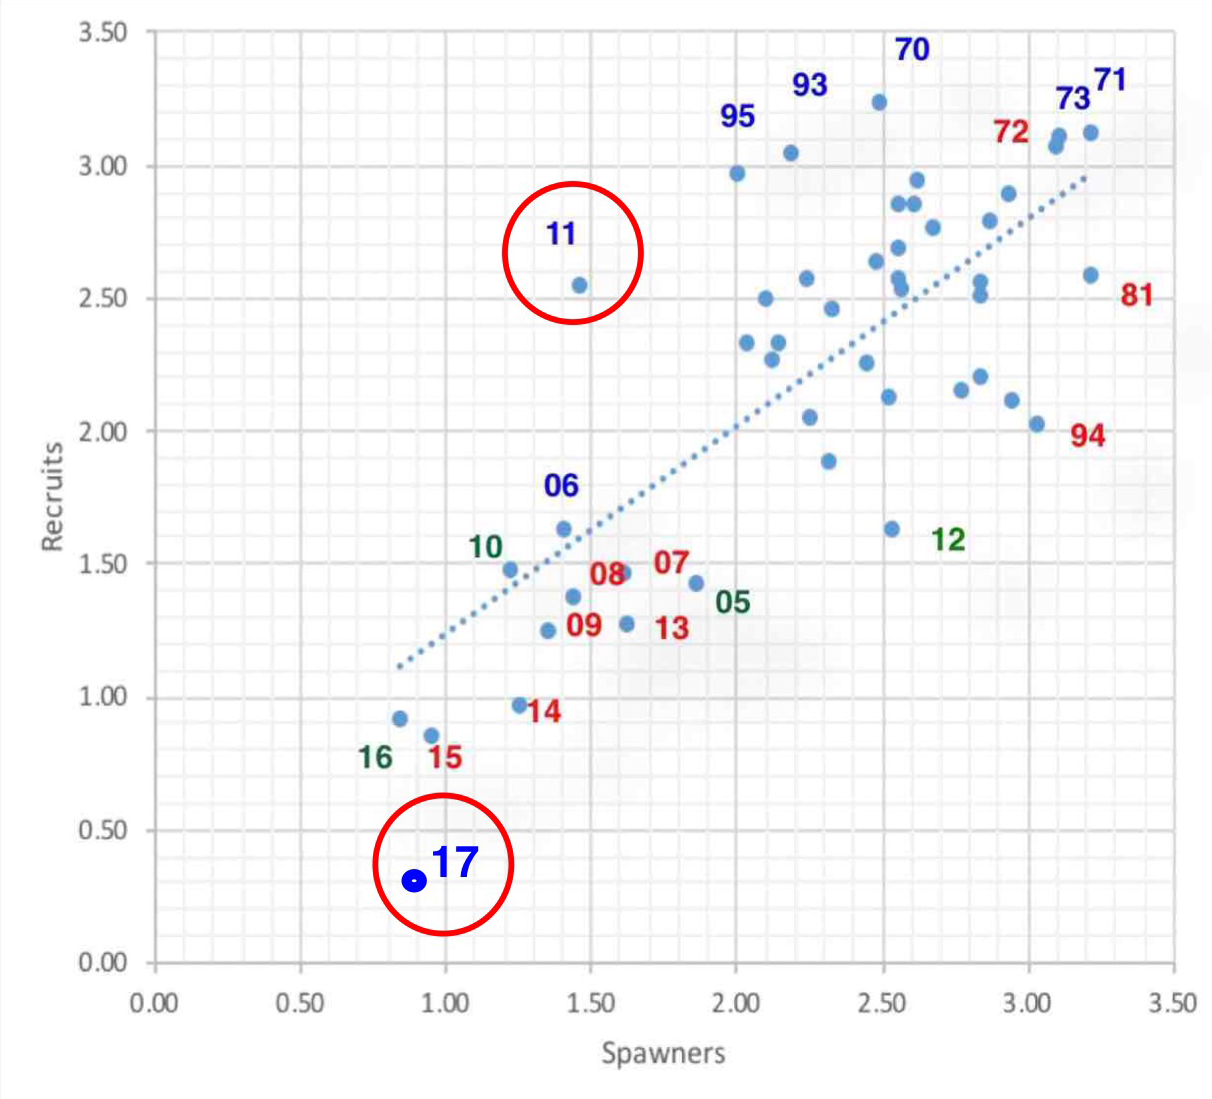
Figure 1. Delta smelt spawner-recruit relationship. Note strong recovery in 2011. Source: http://calsport.org/fisheriesblog/?p=1966
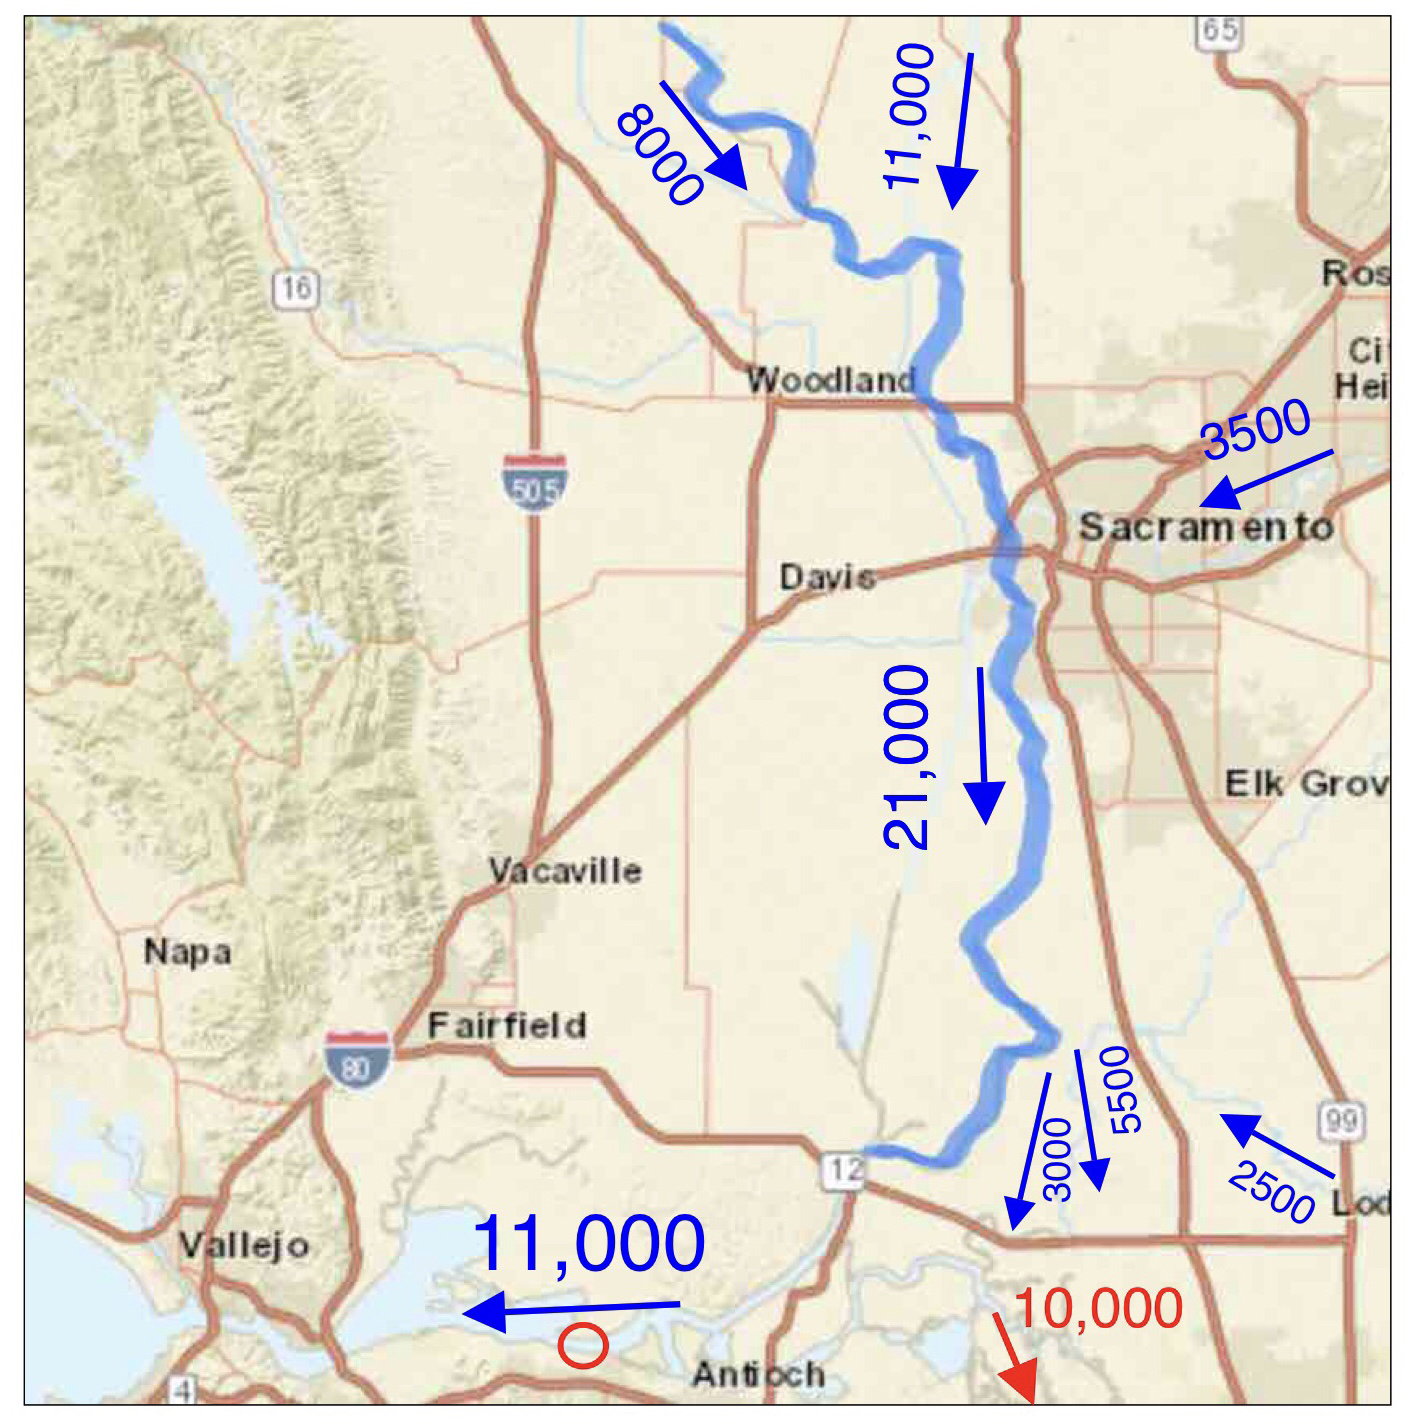
Figure 3. Bay-Delta hydrodynamics in late August 2019 under Fall X2 operations. Flows are average daily cfs. South Delta exports are in red. Red circle is location of X2.
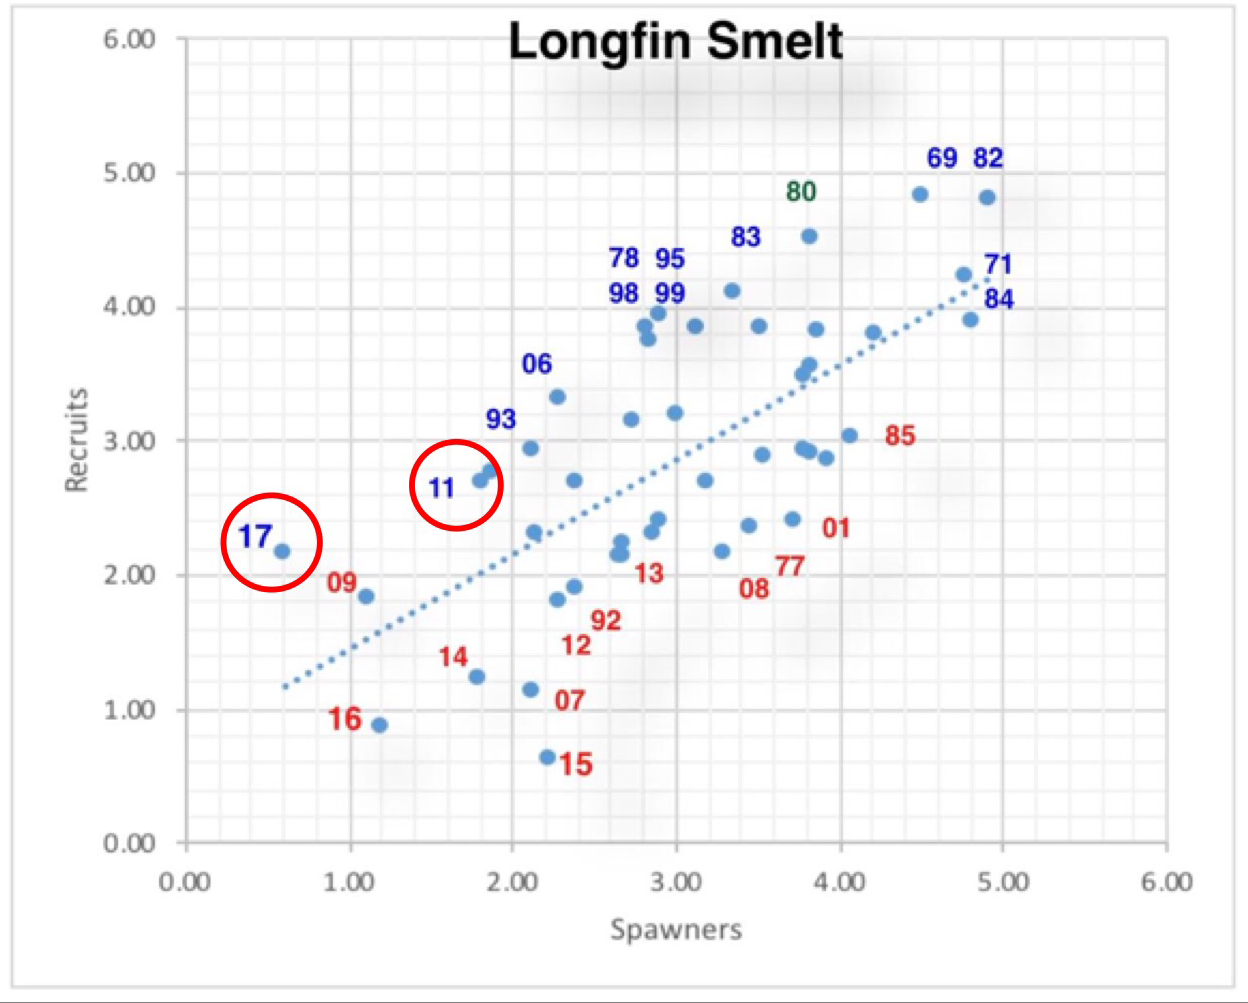
Figure 2. Longfin smelt spawner-recruit relationship. Source: http://calsport.org/fisheriesblog/?p=2513
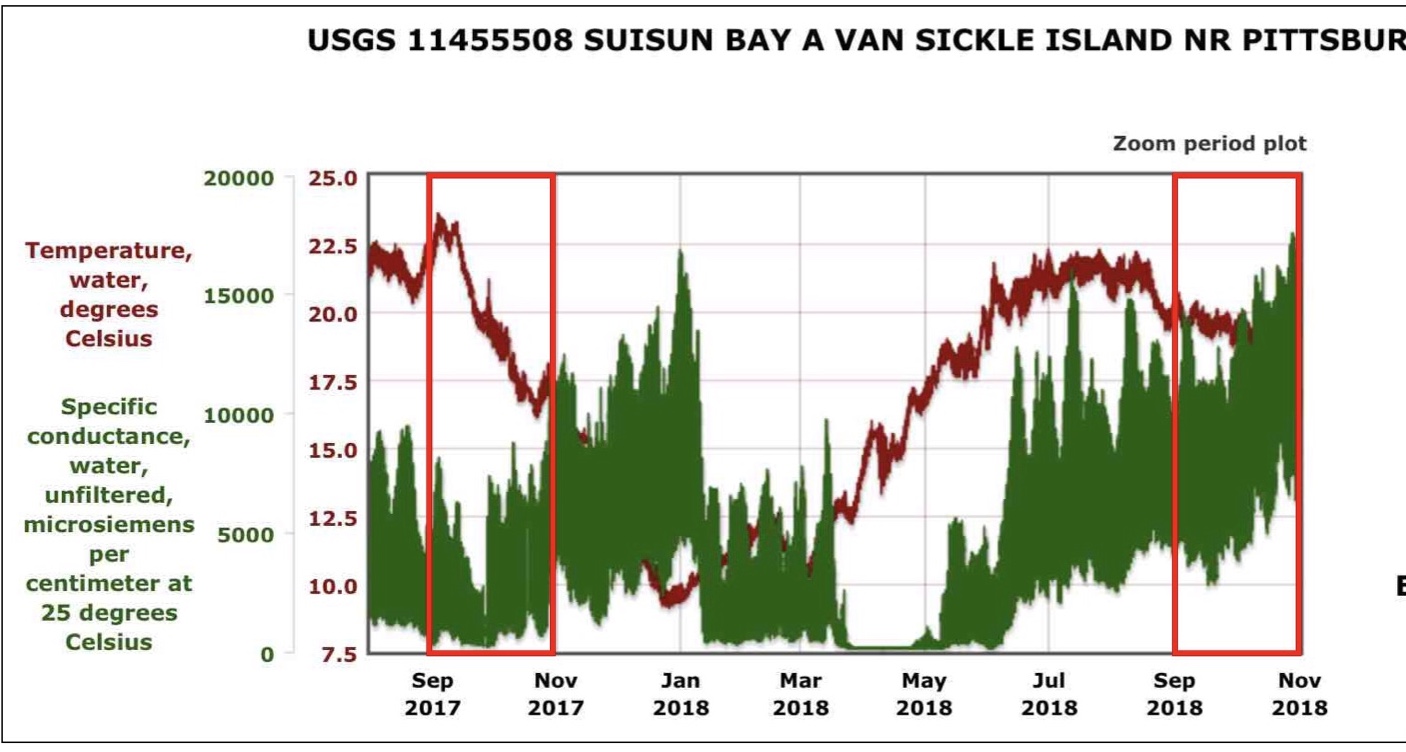
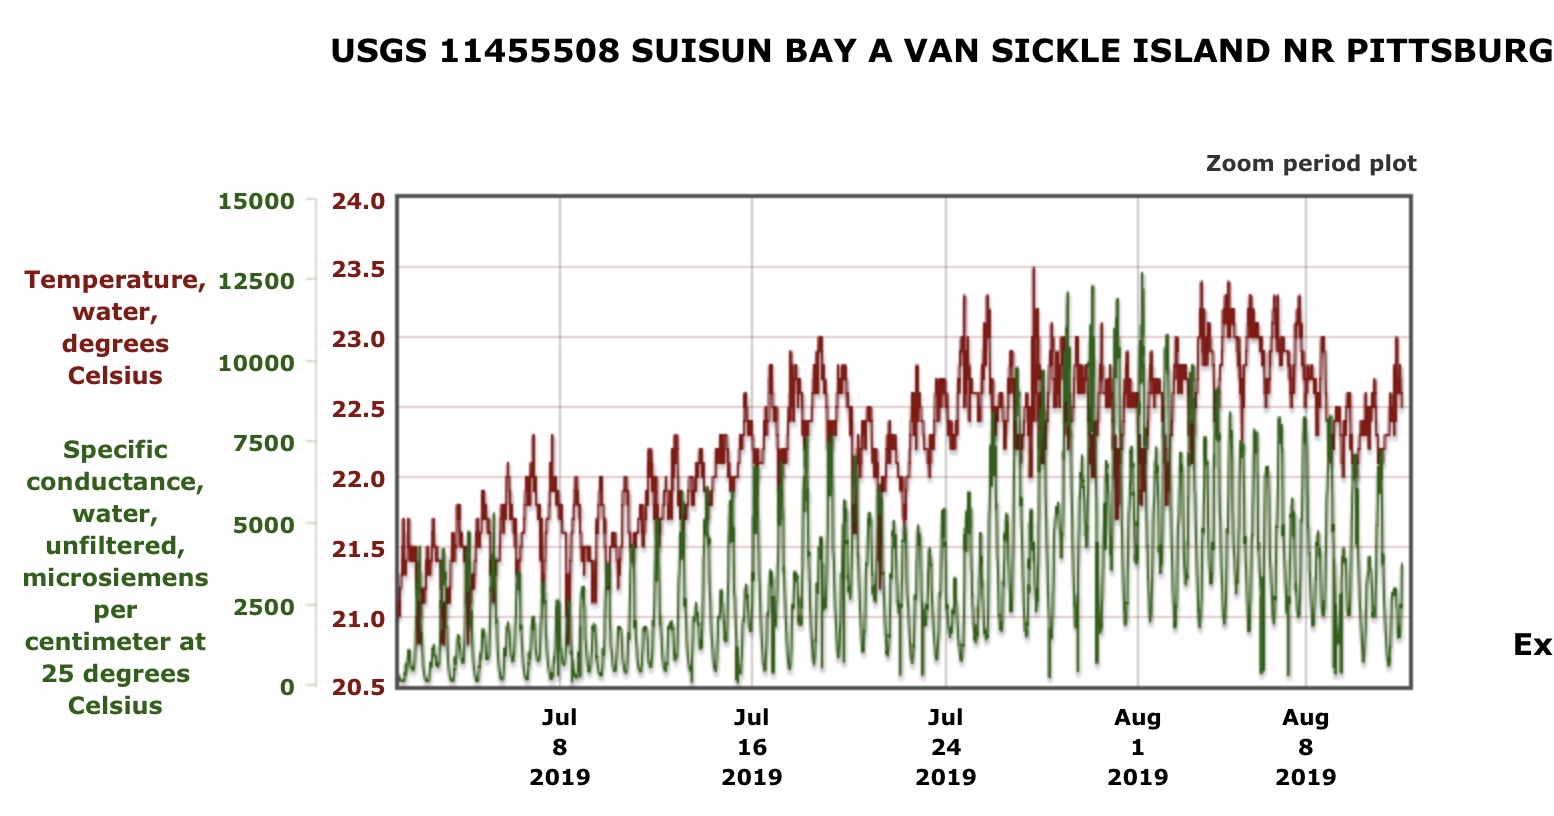
Figure 4. Water temperature and salinity (EC) in eastern Suisun Bay, August 1, 2017 through November 1, 2018. Fall X2 was applied in 2017 (red outlined box). Note lower salinity and lower water temperature in 2017 compared to 2018.
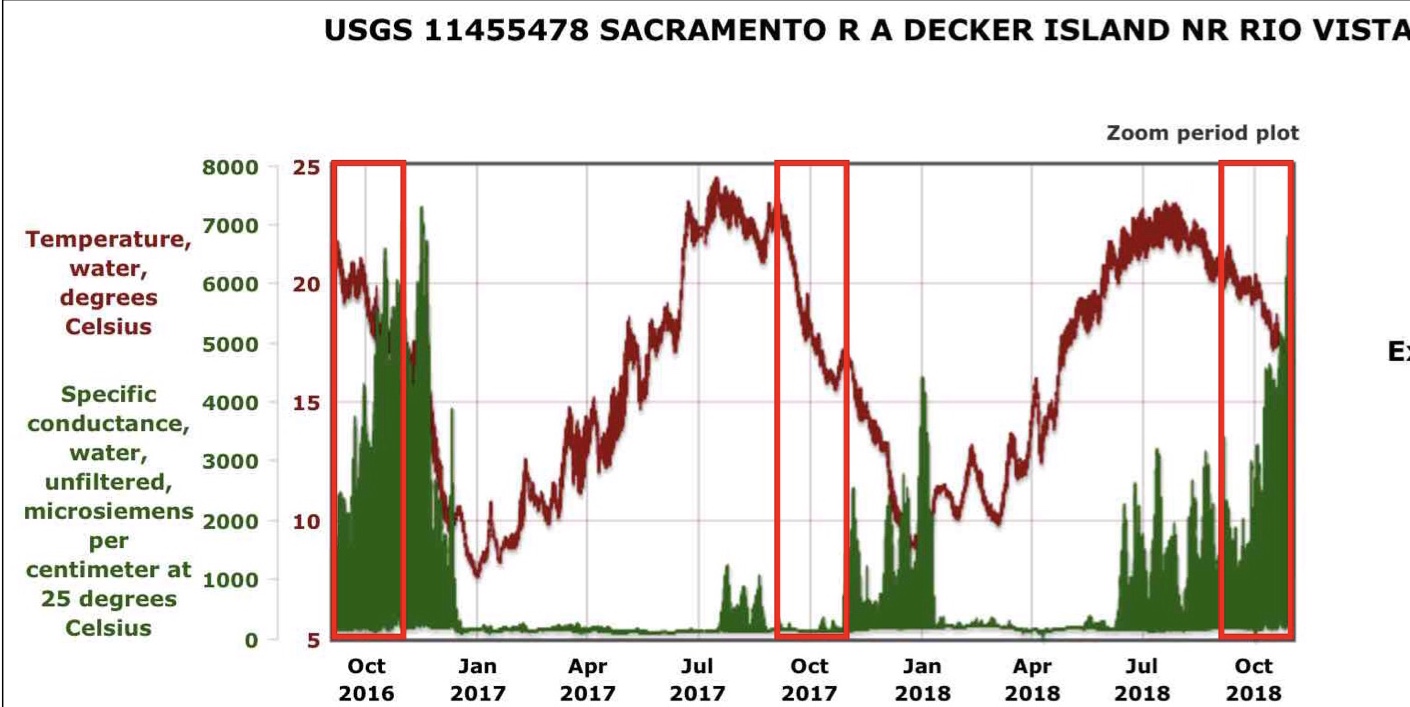
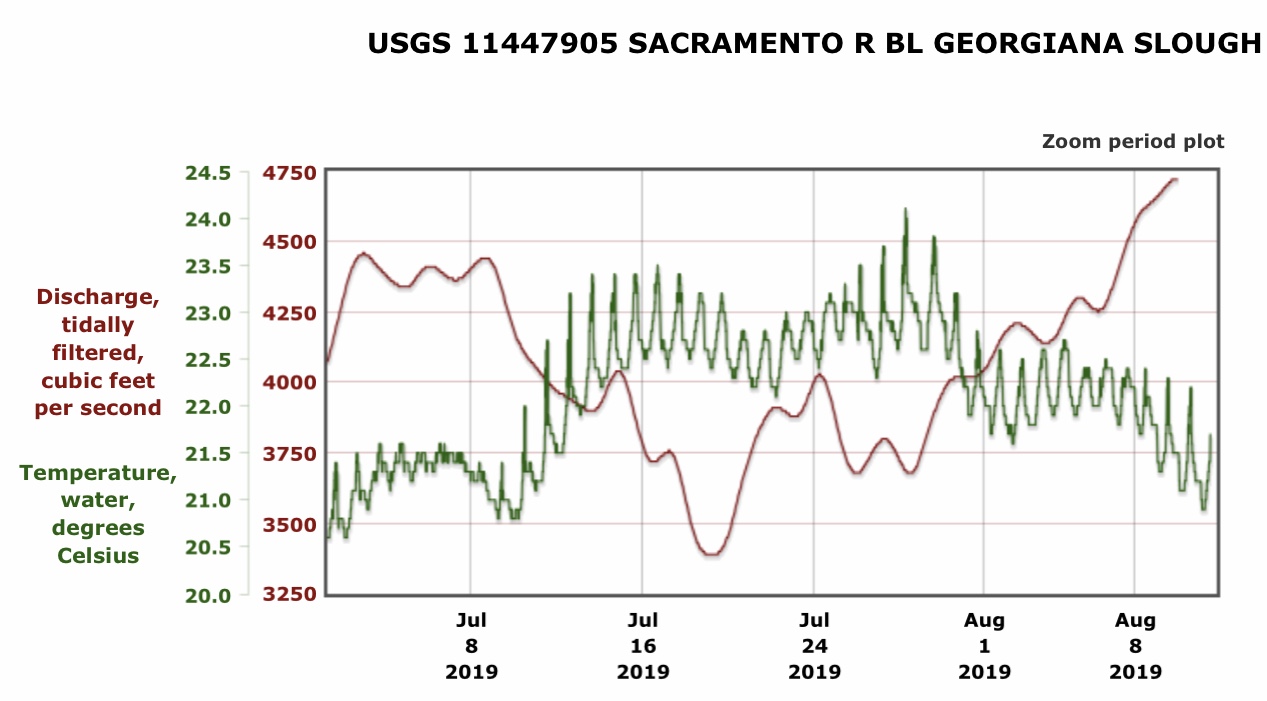
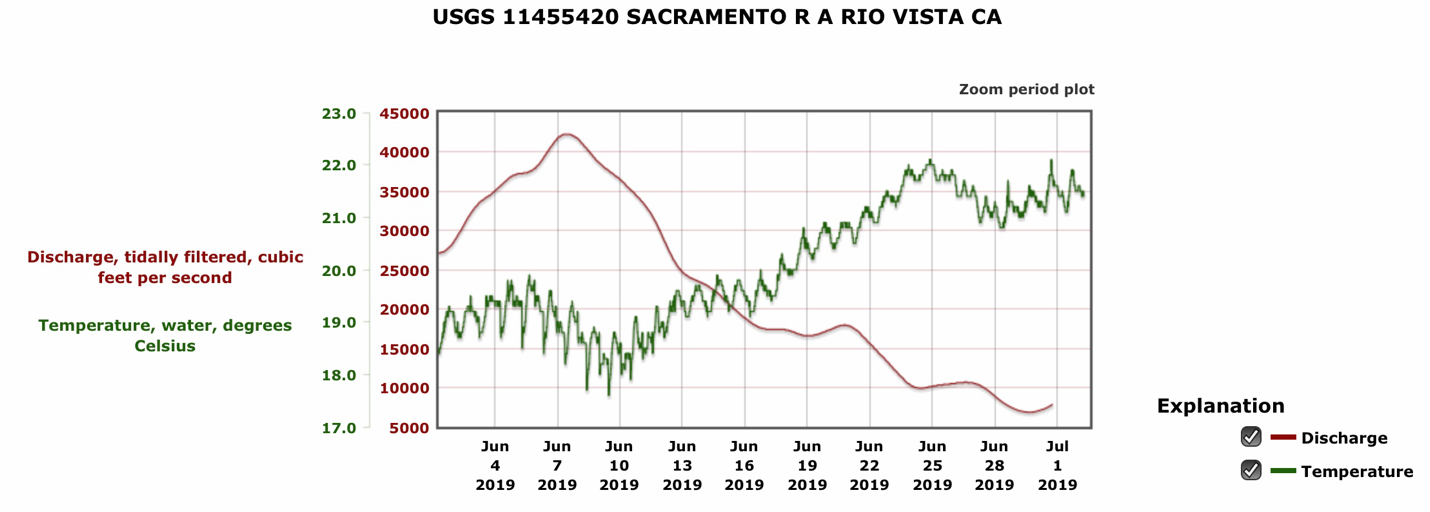
Figure 5. Water temperature and salinity (EC) in the lower Sacramento River channel of the west Delta near Decker Island August 1, 2016 through November 1, 2018. Fall X2 was applied in August-September 2017 (red outlined box). Note lower salinity and slightly lower water temperature in 2017 during Fall X2 application compared to 2016 and 2018 without Fall X2.
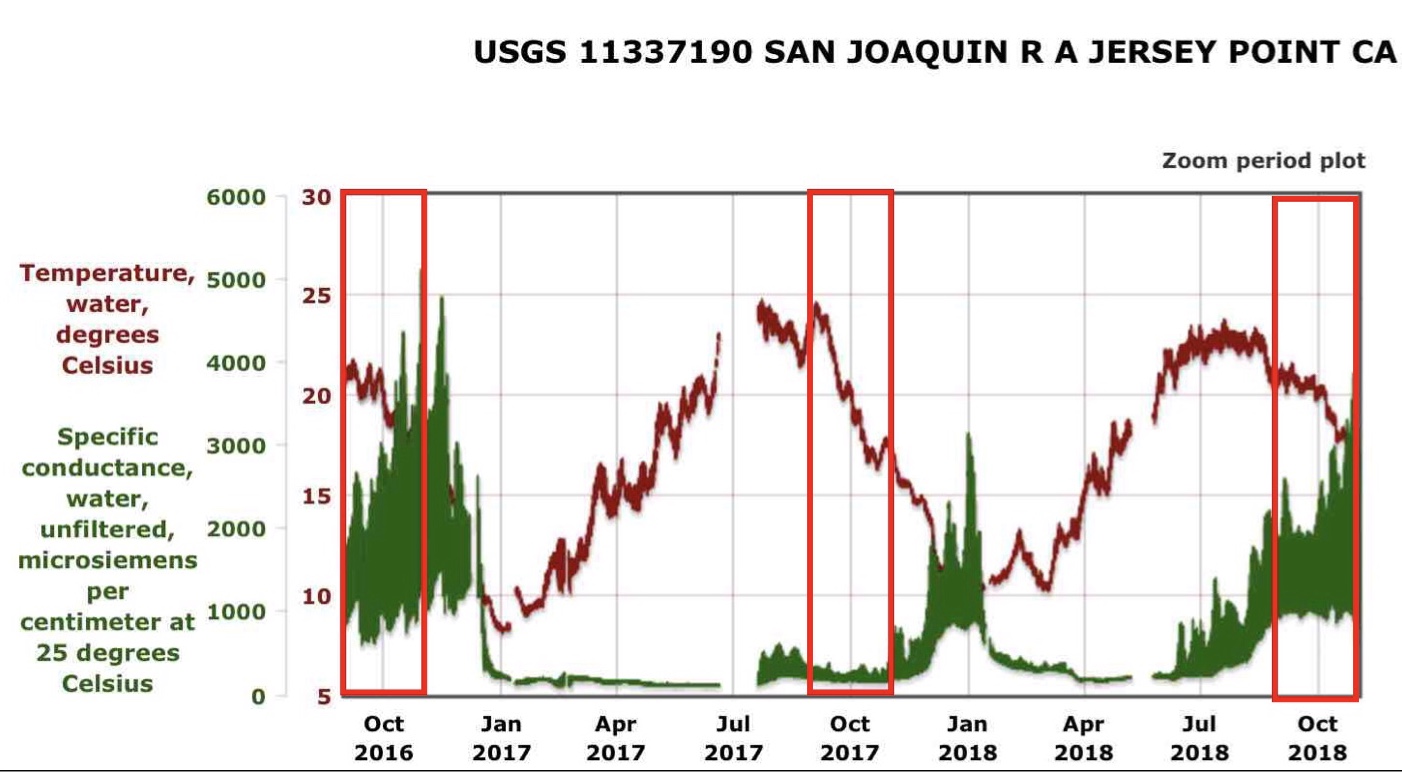
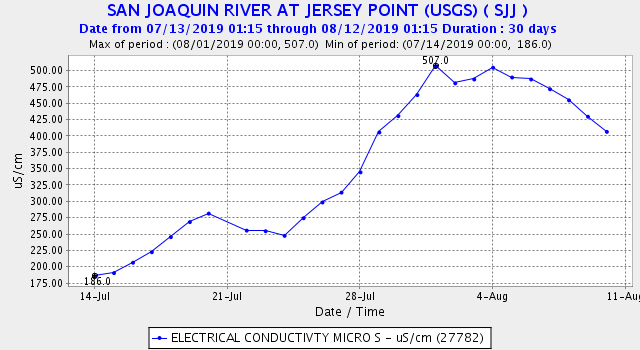
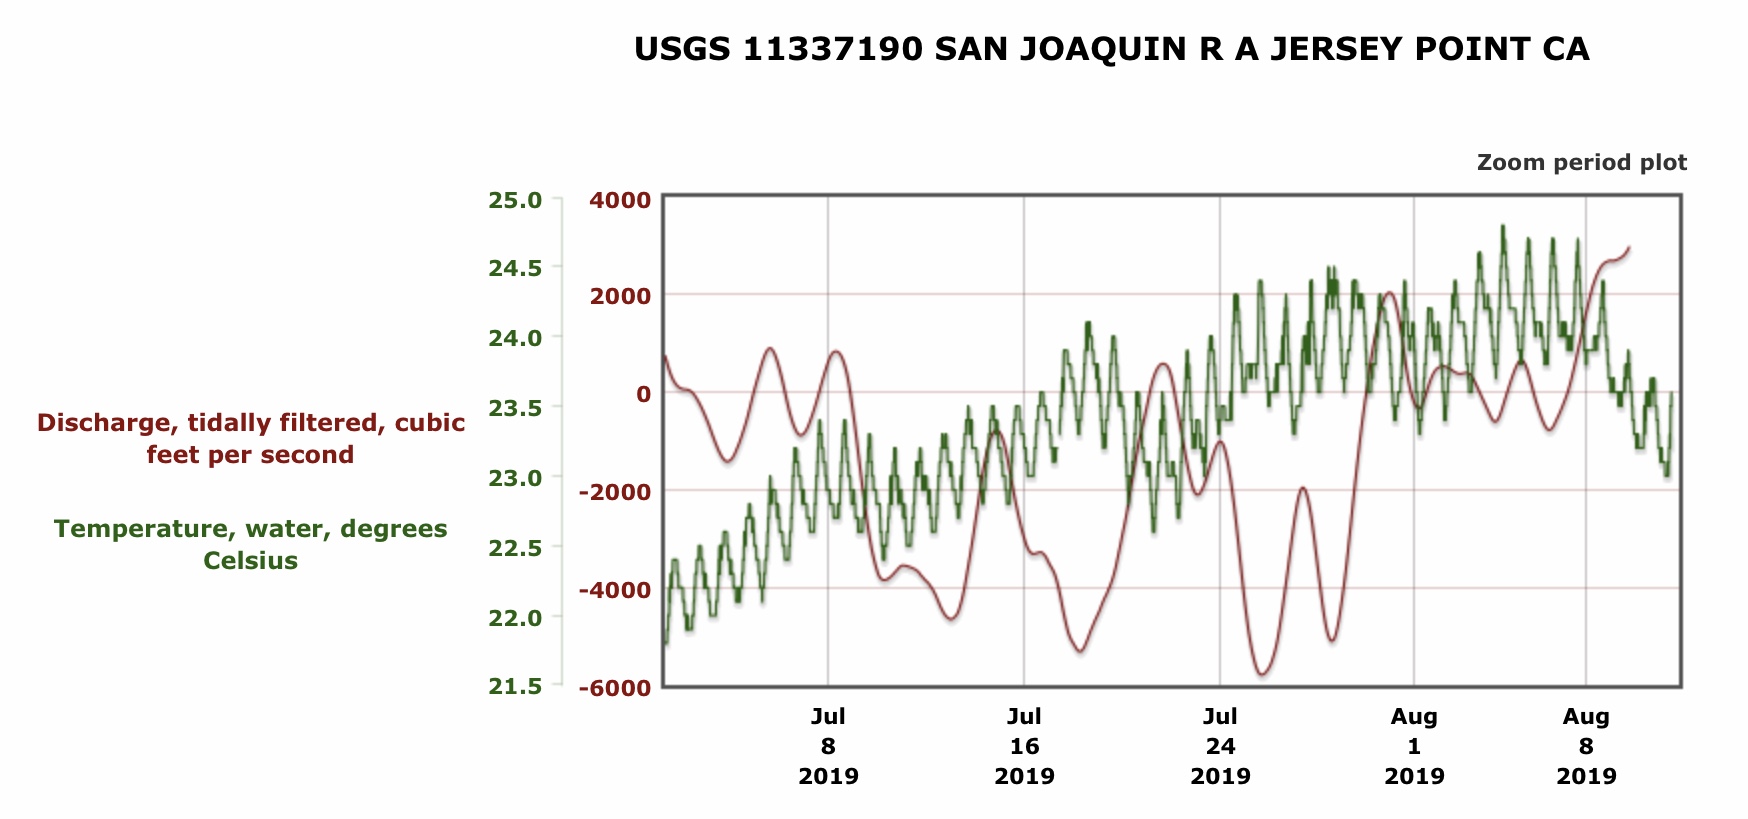
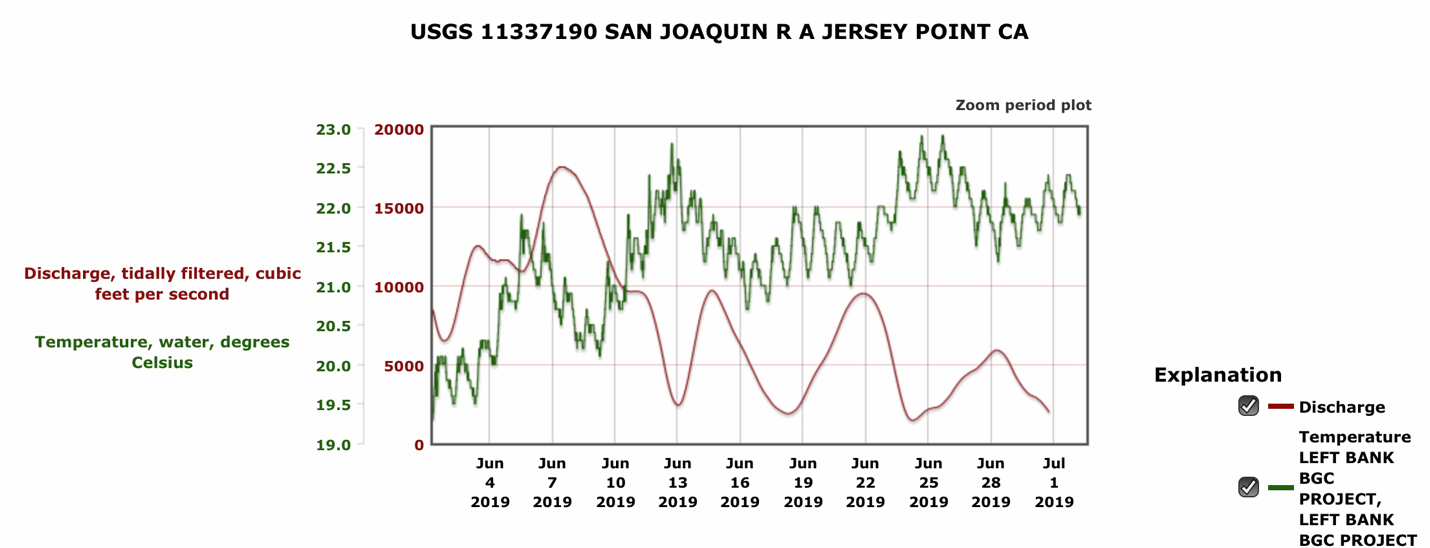
Figure 6. Water temperature and salinity (EC) in the lower San Joaquin River channels near Jersey Point in the western Delta from August 1, 2016 through November 1, 2018. Fall X2 was applied in August-September 2017 (red outlined box). Note lower salinity and slightly lower water temperature in 2017 during Fall X2 application compared to 2016 and 2018 without Fall X2.