The much anticipated salmon season opener on the Sacramento River will be a bust, just as it was last year.
USA Fishing reports on July 15, 2017: “The Central Valley rivers open to salmon fishing on Sunday July 16th. The good news is that reservoirs are full and we have cold water and much higher releases than we have seen (for the opener) in years.”
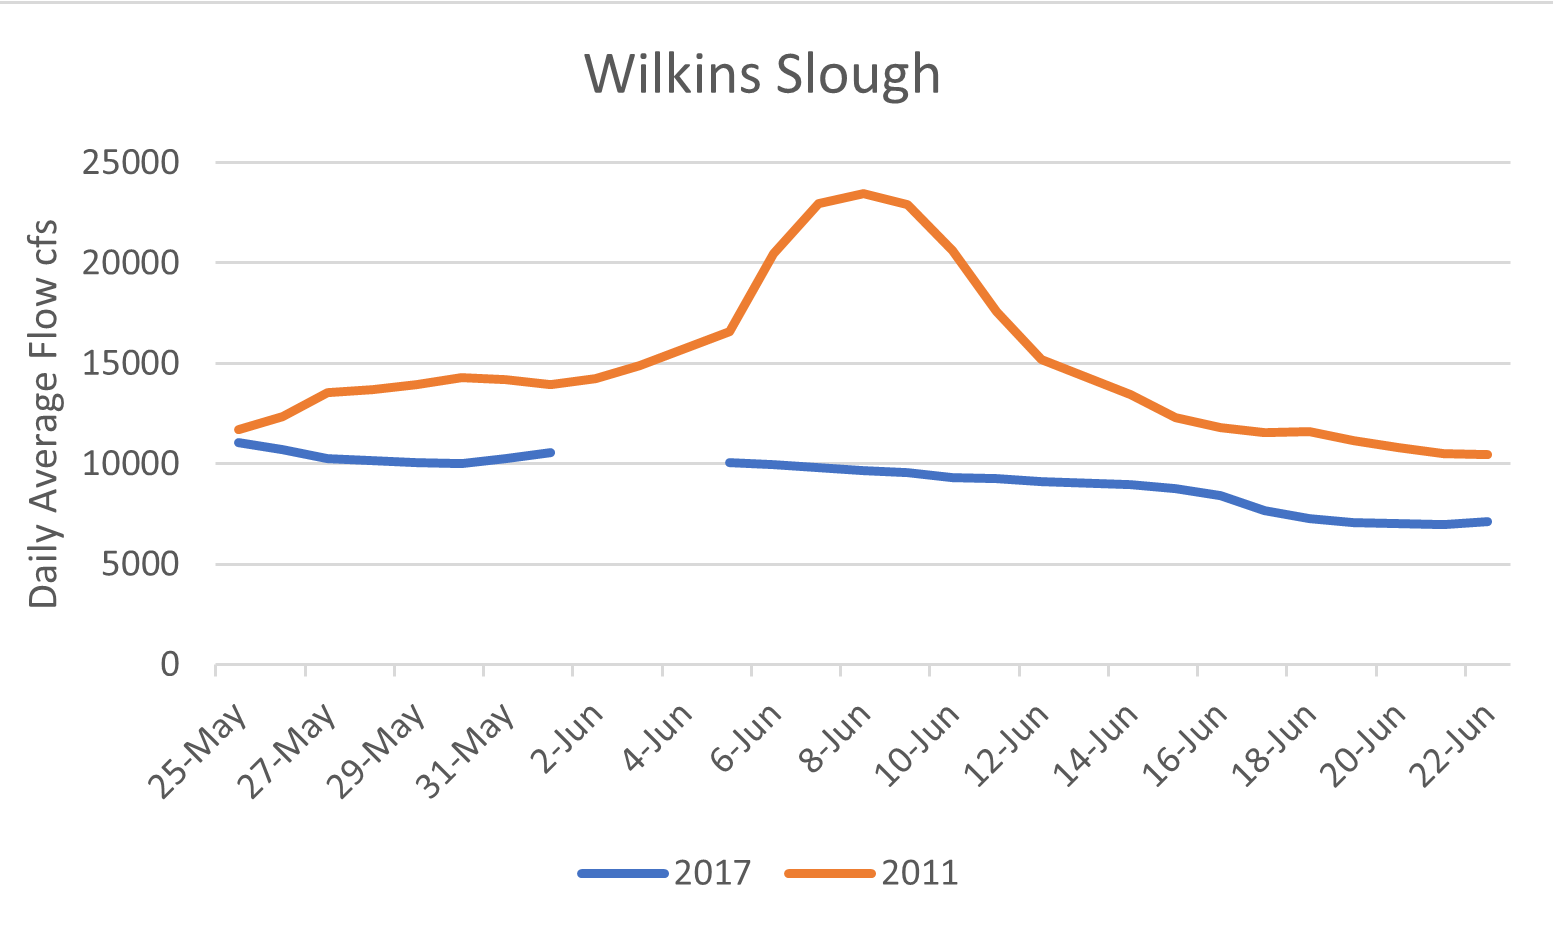
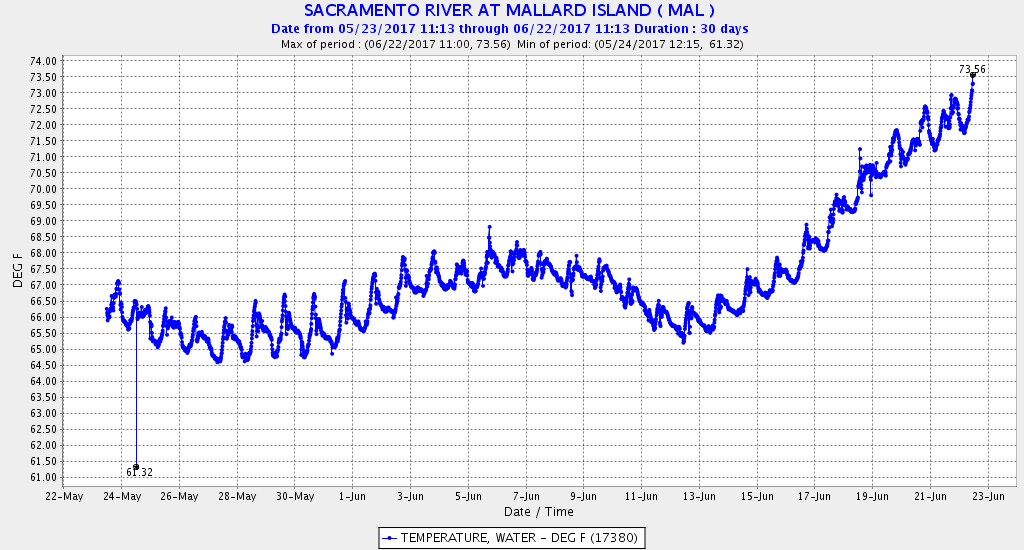
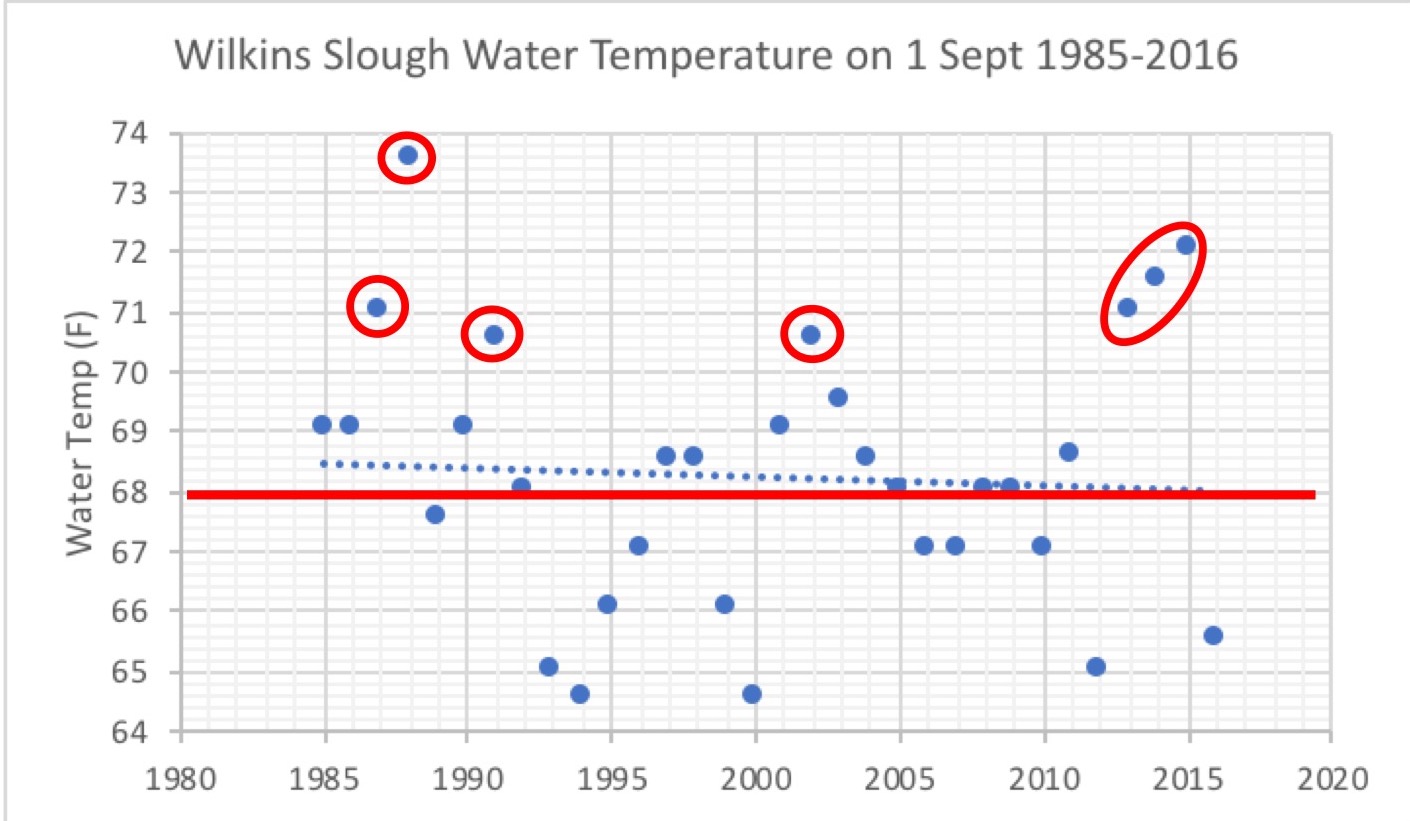
The sad news is that despite record inflow to reservoirs, the “new norm” in the lower Sacramento River is low water, high water temperatures, and no salmon during summer. This “new norm” is a consequence of the fact that federal and state regulators have changed the rules as they are applied on the ground, with little or no public input. Federal EPA and State water quality standards are no longer being enforced. The summer 68oF limit for the lower Sacramento River between Red Bluff and the Delta no longer applies. The “new norm” is 72-75oF (22-24oC), as is evident in Figures 1 and 2, below. This new norm is in direct contrast to 2006 and 2011, the last two wet years (Figures 3 and 4). The apparent reason is an absolute prioritization of using Shasta Reservoir storage for water contractors and winter-run salmon. Fall-run salmon, the backbone of ocean and river salmon fishing alike, no longer rate protection. Shasta Reservoir is just about full, but the Bureau of Reclamation is using none of the water stored there to maintain water temperatures in 200 miles of the lower Sacramento River.
Why are flows and water temperatures important in the lower 200 miles of the Sacramento River? In spring, millions of upper river hatchery and wild salmon and steelhead smolts pass through the lower river on their way to the ocean. Also in spring, white and green sturgeon spawn and rear in the lower river. Adult winter-run and spring-run salmon also pass upstream through the lower river during the spring on their way to upper river and tributary spawning grounds. In summer, adult fall-run salmon begin their upstream run in July, with a peak in August-September. The lower river is home to rearing juvenile salmon, steelhead, and sturgeon all summer; high water temperatures and low flows are detrimental to their survival and favorable to predators. High water temperatures and low flows in the river also increase the likelihood of higher water temperatures and lower flows through the Delta to the Bay, leading to poorer survival of longfin smelt, Delta smelt, and other native Delta fishes.

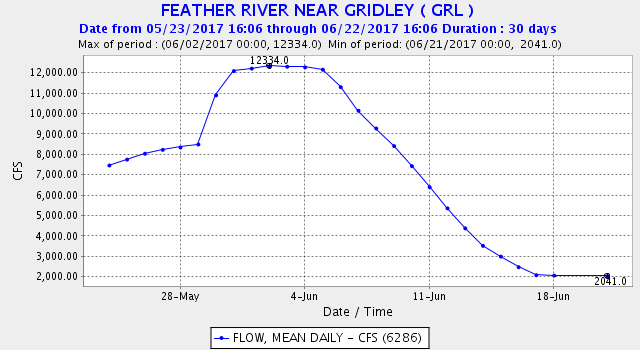
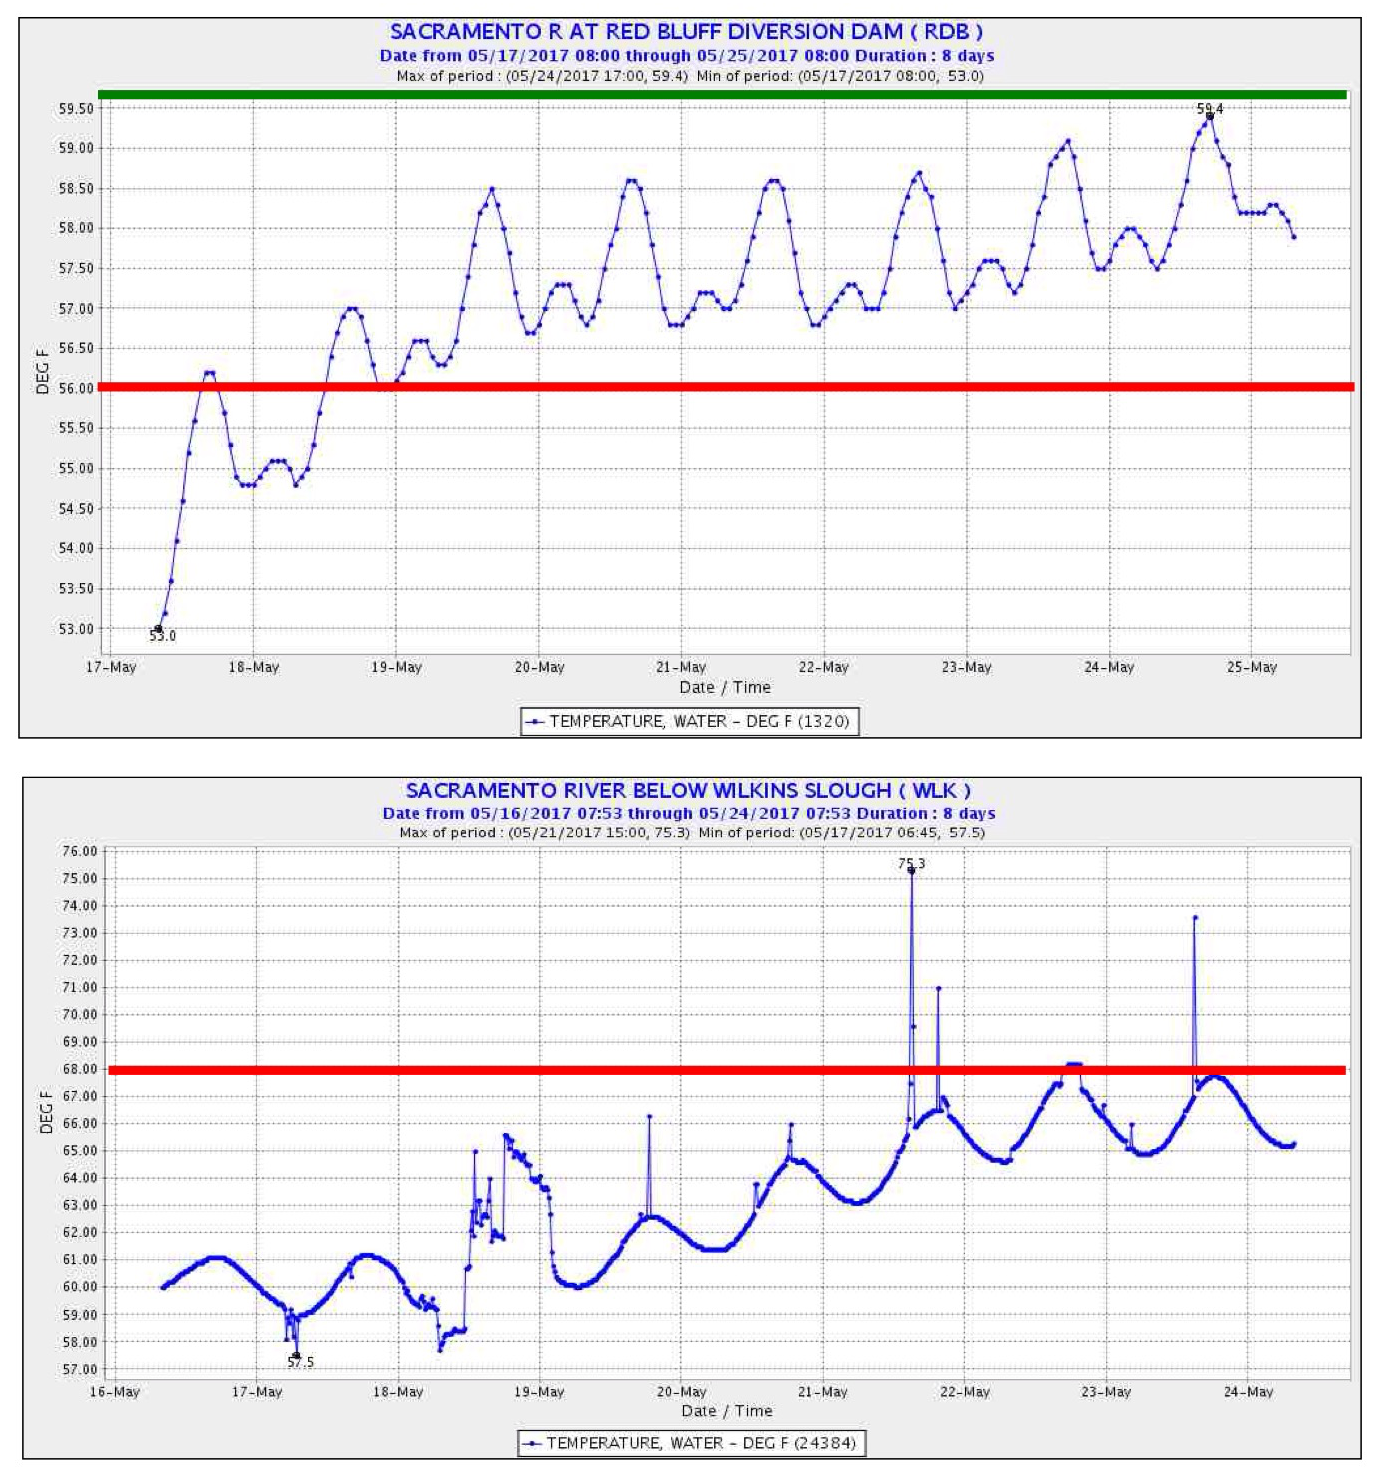
Figure 1. Water temperature (daily high and low) and flow at Wilkins Slough of lower Sacramento River, June-July 2017. Source for all figures: https://waterdata.usgs.gov/nwis/
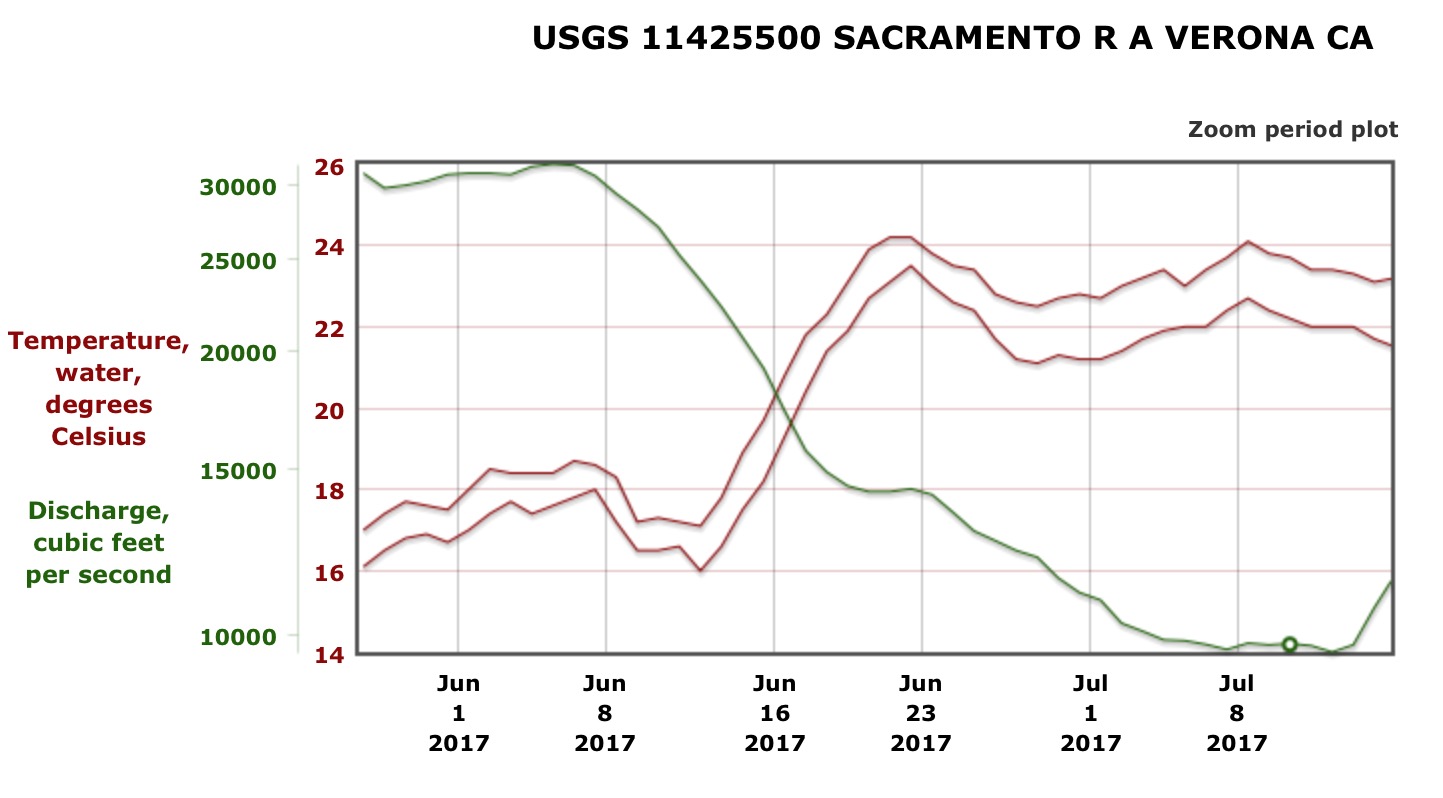
Figure 2. Water temperature (daily high and low) and flow at Verona of lower Sacramento River, June-July 2017.
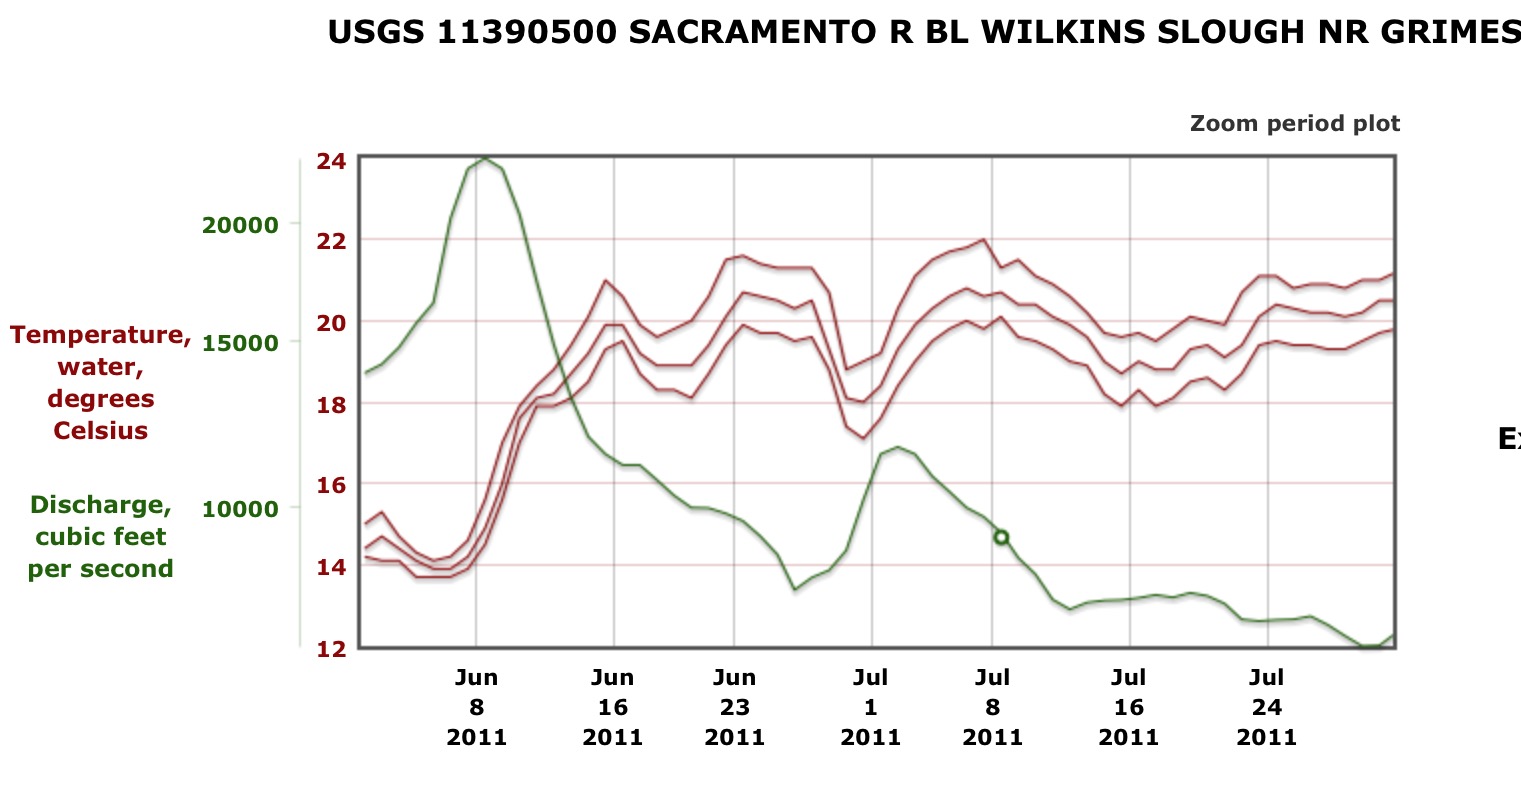
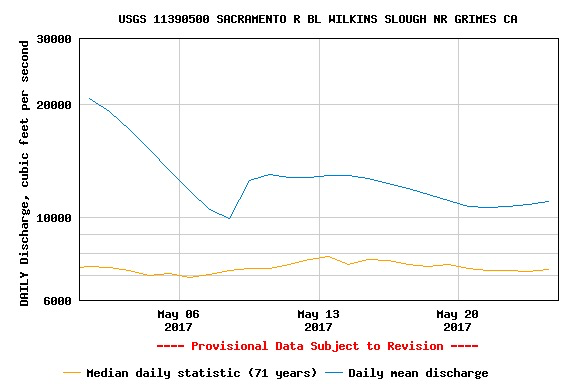
Figure 3. Water temperature (daily high, median, and low) and flow at Wilkins Slough of lower Sacramento River, June-July 2011.
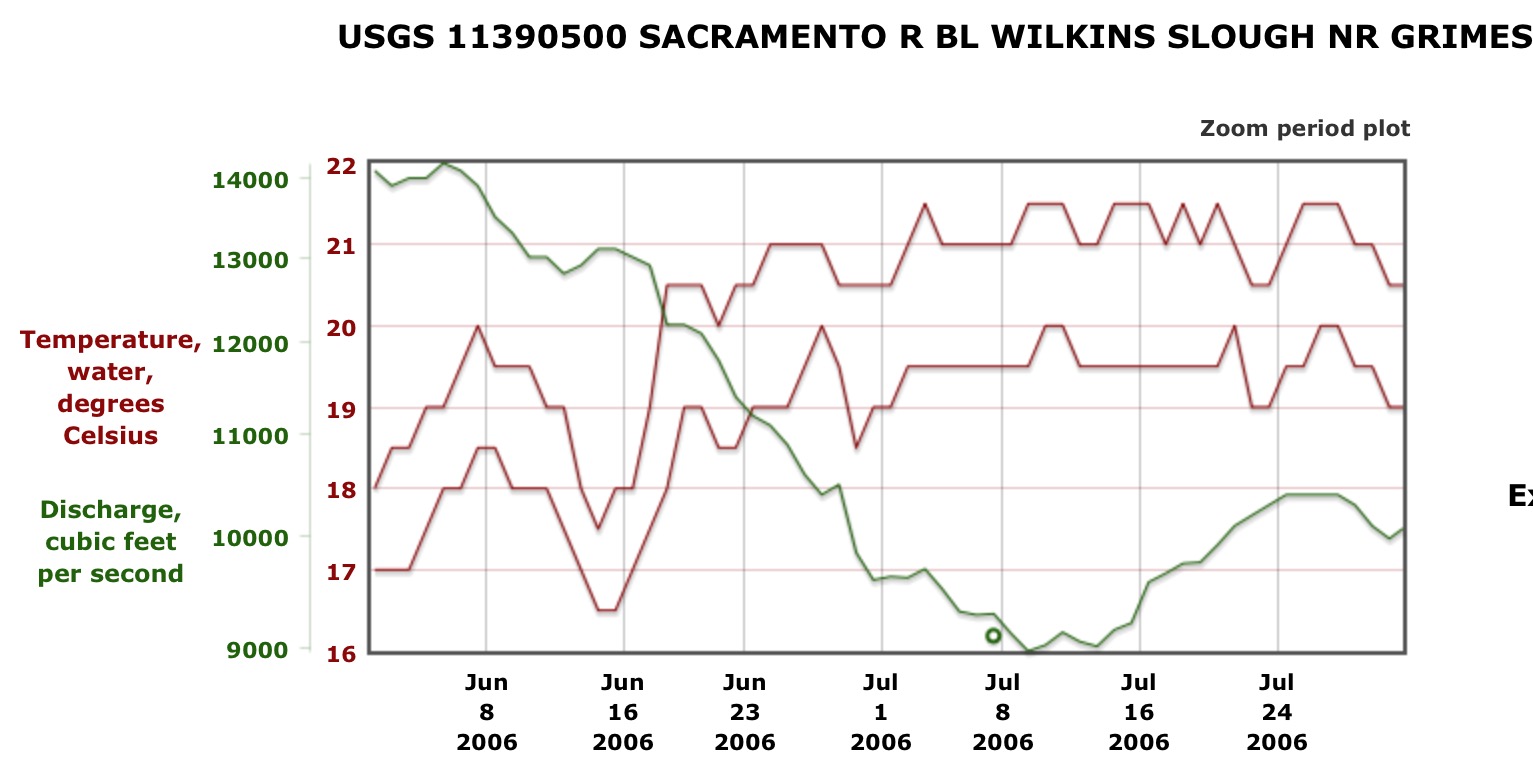
Figure 4. Water temperature (daily high and low) and flow at Wilkins Slough of lower Sacramento River, June-July 2006.