On August 11, Jason Peltier, executive director of the San Luis-Delta Mendota Water Authority, offered comments on a letter from environmental groups to the State Board that requested more water for Delta Smelt. Below, I provide some of Mr. Peltier’s statements, and a response to each:
1. “As environmental special interests request the State Water Resources Control Board expand failed policies on Delta Smelt, Californians are calling on the Board to implement new science-based, common sense approaches to protect the species. It is disheartening to see once credible environmental organizations calling for a “more of the same” approach – one that has so miserably failed for a quarter century – in a misguided attempt to help the imperiled delta smelt.”
Comment: The environmental organizations were proposing what the state has also offered as its new strategy for the Delta Smelt. It is not the old misguided “failed” strategy of diverting more and more water and providing less and less Delta outflow to the Bay. The state’s new strategy derives from some of the same actions suggested in this past April’s science workshop on Delta Smelt held at UC Davis, which Mr. Peltier attended.
2. “[t]he Projects have compensated for Mother Nature’s stinginess with water released from reservoirs, making the Delta far fresher than it would have been naturally.”
Fact: Just the “natural” summer inflow to Shasta Reservoir in the past four years of drought nearly equaled the amount allocated for summer Delta outflow. If you add up all the Central Valley’s “natural” inflow it would far exceed the Delta outflow allotted, even without accounting for use above the rim reservoirs.
3. “This dedication of water for fish from what was stored for drought relief has resulted in unprecedented socio-economic and environmental harms to towns, farms, and numerous species living in the largest wetlands in the West.”
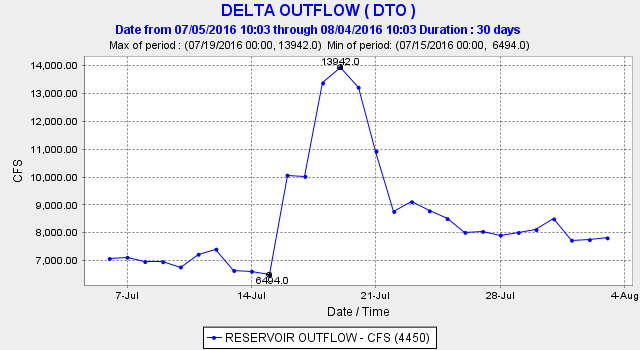
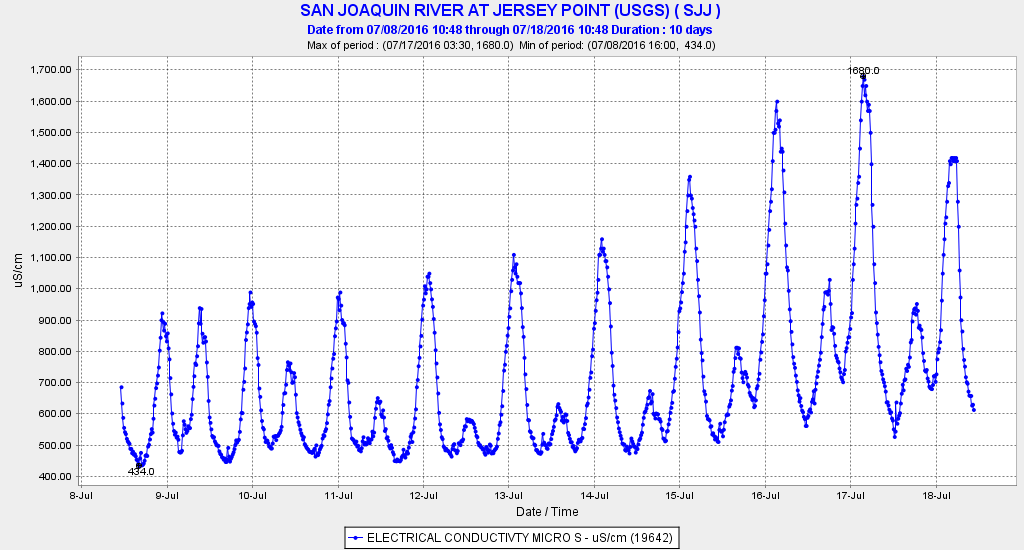
Fact: Most of the water stored is for agriculture and released for agriculture. Mr. Peltier’s organization is simply last in line for stored water and thus gets less water allocated during droughts. In June and July, nearly 30,000 cfs of water was released on average from Central Valley reservoirs, but only 7000-8000 cfs reached the Bay to repel salt intrusion. Because Shasta releases were reduced to protect salmon (not smelt), Mr. Peltier’s organization was unable to receive more than a minimal allocation. Again, this is because its water rights are junior to those of other users, not because of water allocated to smelt (none).
4. “Since the most severe cuts were imposed on the Projects nine years ago, less water has been diverted, and thus more Projects’ water has gone out to the ocean, than at any other time in the past 35 years.”
Fact: Seven of the last nine years were drought years. The only water consistently reaching the ocean in large amounts during those seven years was uncontrolled river flows and reservoir spills during and after sporadic winter storms. The only reservoir water that reached the ocean (Bay) in those seven dry years was the water necessary to hold back salt intrusion into the Delta so Delta diversions and exports remained possible.
5. “Farmers, fishermen, and environmentalists – everyone that truly cares about the status of our imperiled fisheries – should be furious.”
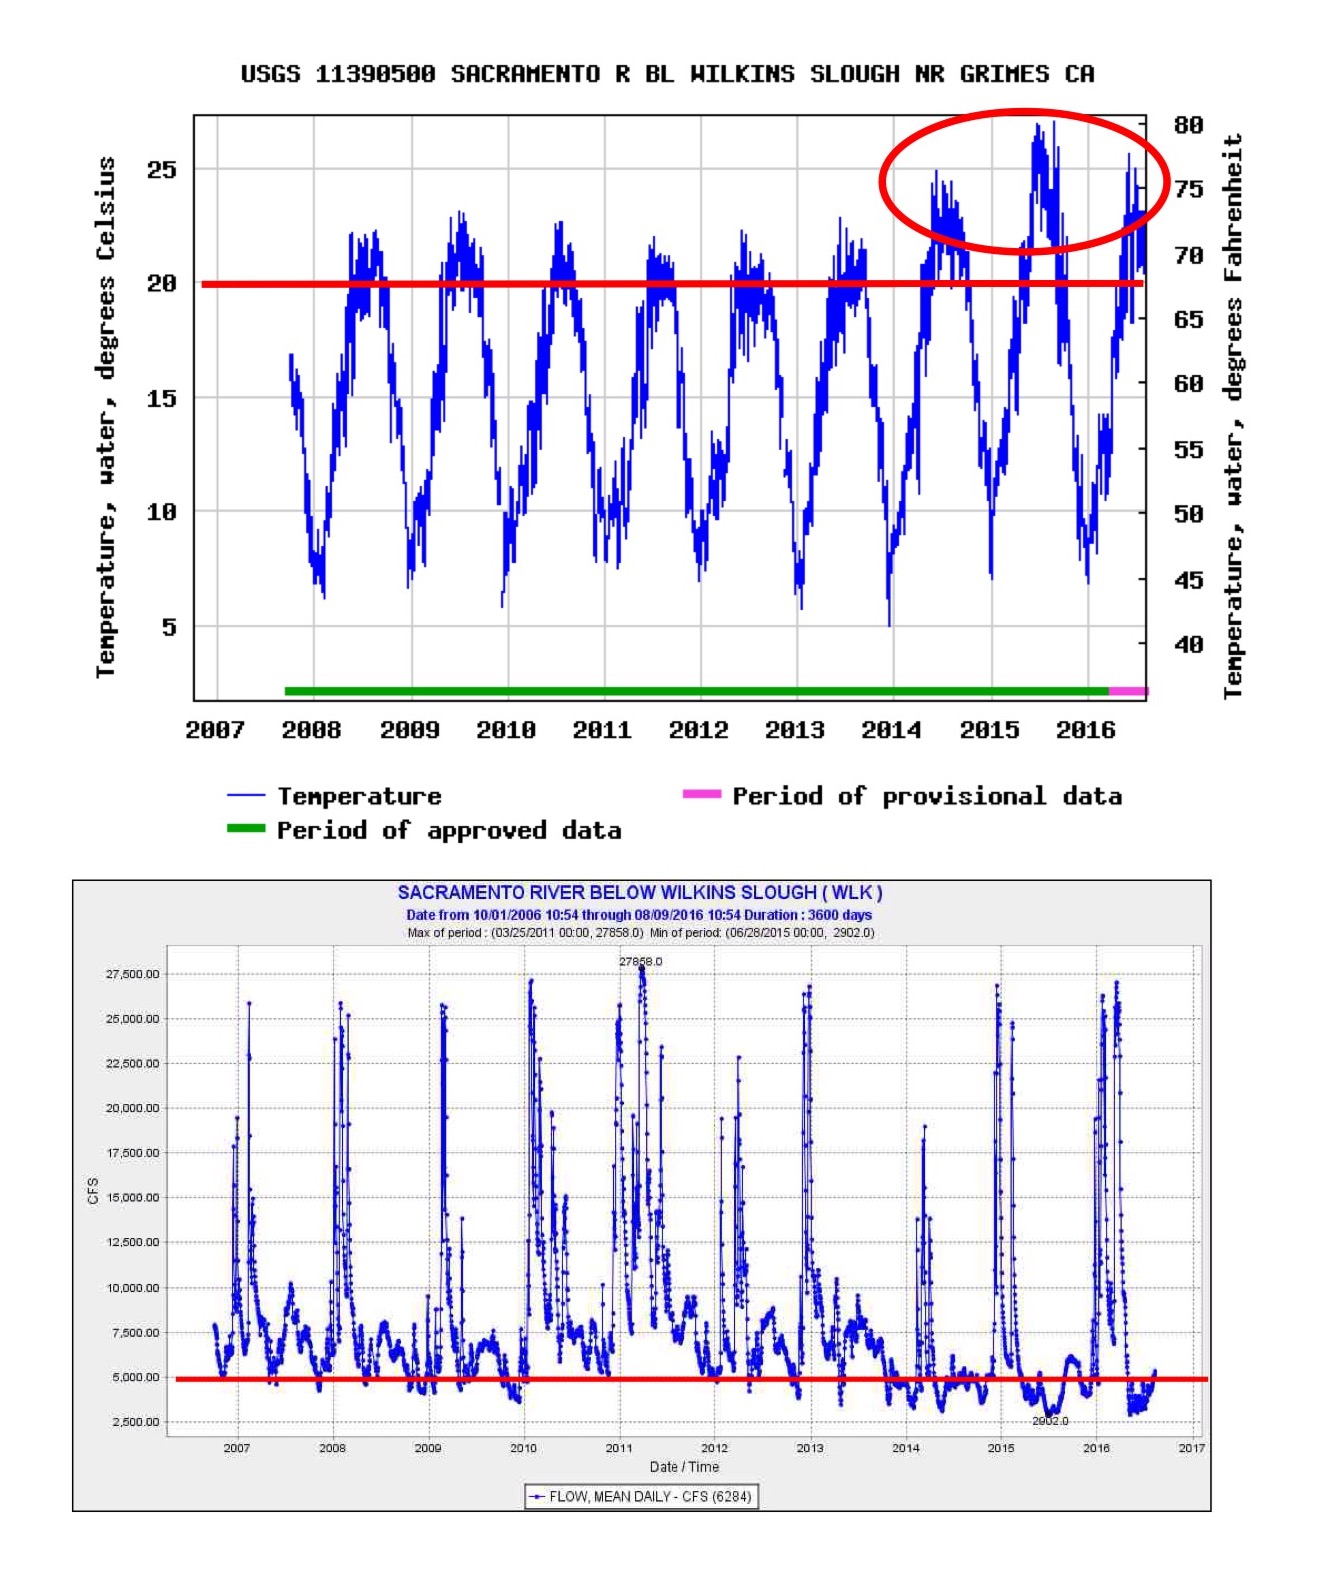
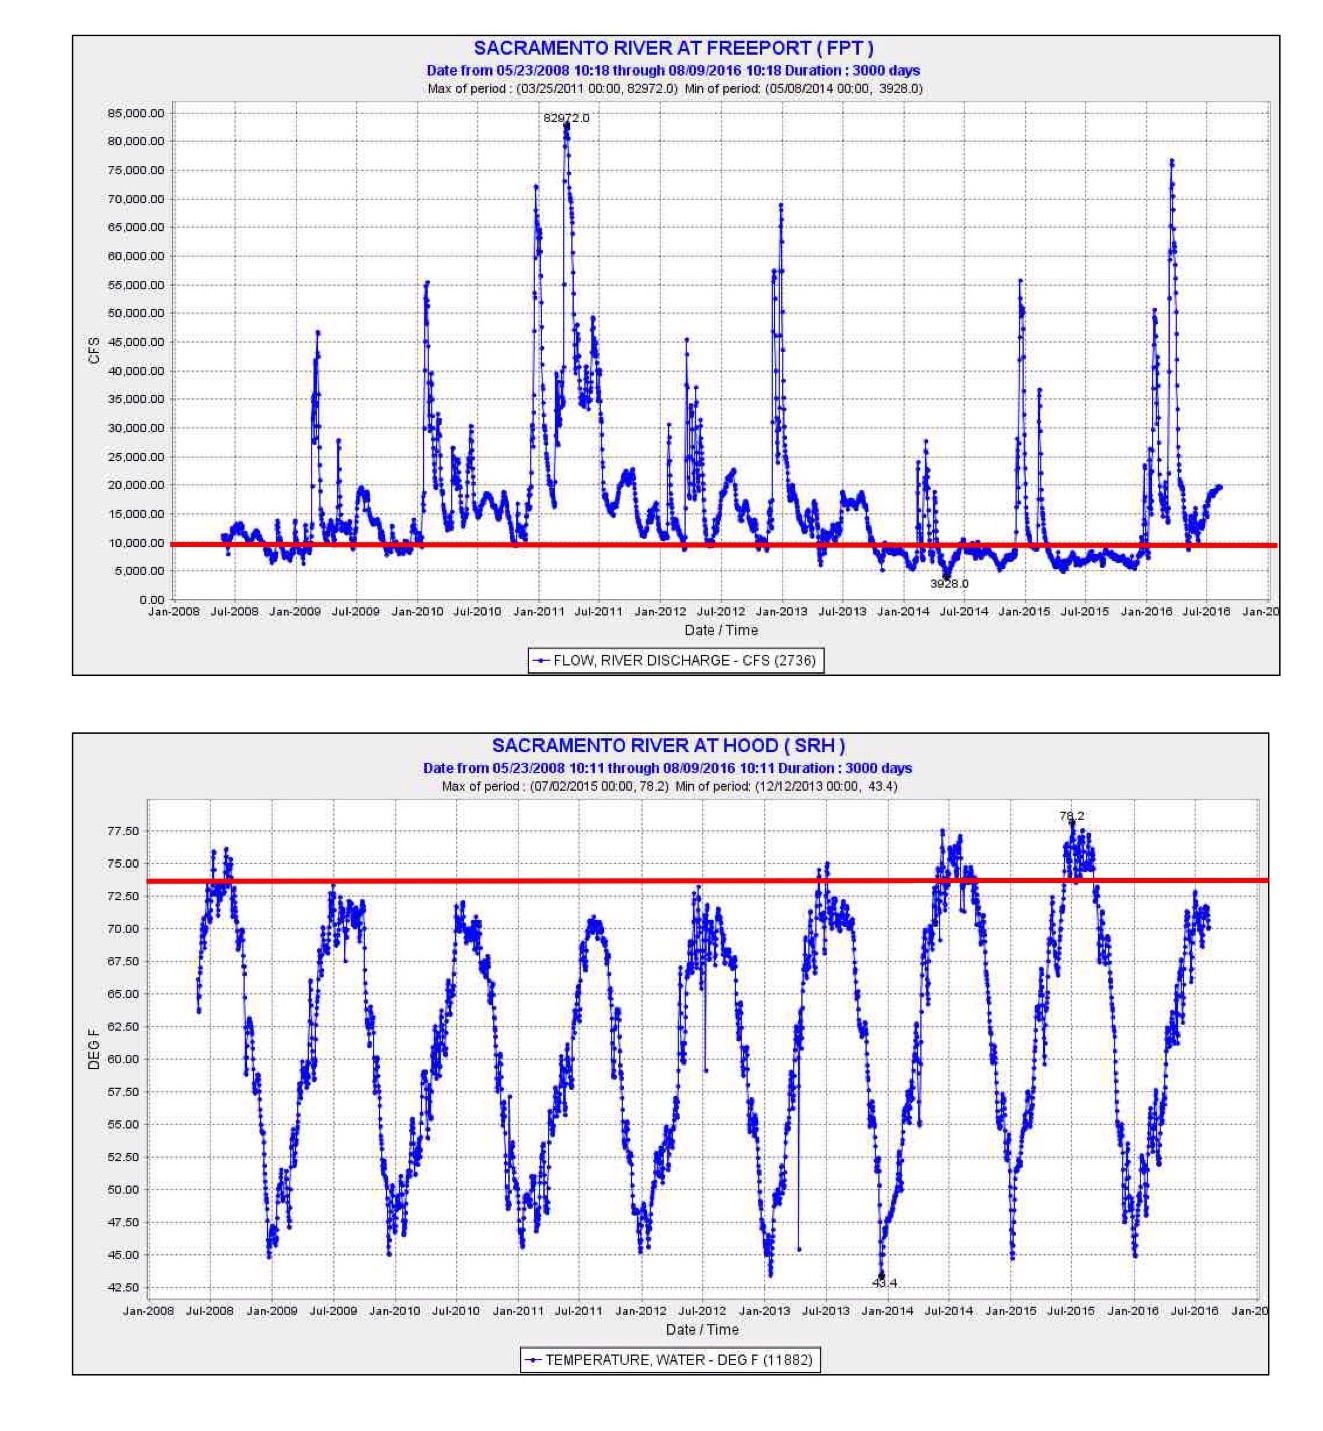
Comment: The fishermen and environmentalists are “furious” because of government mismanagement of the Shasta Reservoir cold water pool that has nearly wiped out the Sacramento salmon runs, and because of the weakening of Delta water quality standards in 2014 and 2015 that allowed excess salt into the Delta and just about exterminated the Delta smelt population.
6. “Decades old state and federal policies have failed and brought delta smelt and salmon to the brink of extinction. The last thing we need is more of the same.”
Comment: Yes, decades-old policies of increasing exports from the Delta has brought near-extinctions. It started with the massive State Water Project that came on line in the 1970’s. Yes, the last thing we need is “more of the same” – increasing exports promised with the WaterFix.
7. “Like delta smelt, we need shelter, we need food, and we need safety from predators, toxics, and invasion. The state and federal regulatory agencies have ignored for far too long the full needs of delta smelt, only willing to do what is easy, and we have all suffered for it.”
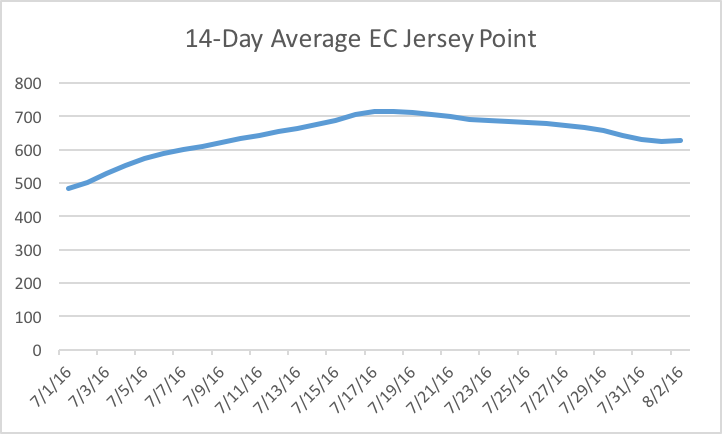
Fact: Delta smelt need the cool, brackish, wind-blown turbid waters of Suisun Bay provided when Delta outflow is sufficient to keep the low salinity zone out of the warm, confined channels of the Delta and away from its massive export pumps.
8. “We can continue to ignore decades of sound scientific advice, or we can embark on a bold new initiative, one that is transparent and inclusive of stakeholders working with state and federal agencies to save delta smelt.”
Comment: We have ignored the scientific advice. It has always been there. What “bold new initiative?”
9. “Now is not the time for desperate action, it is the time for thoughtful action.”
Fact: Giving the Delta Smelt 1000 or 2000 cfs in June and July this year – instead of nothing (Delta outflow was allocated to repel salt) – would entail only 3-6% of the water released from reservoirs and 5-10% of Delta inflow. After all, the Delta Reform Act of 2009 mandates that the state must implement the “co-equal” goals of providing a reliable water supply and protecting, restoring and enhancing the Delta ecosystem.