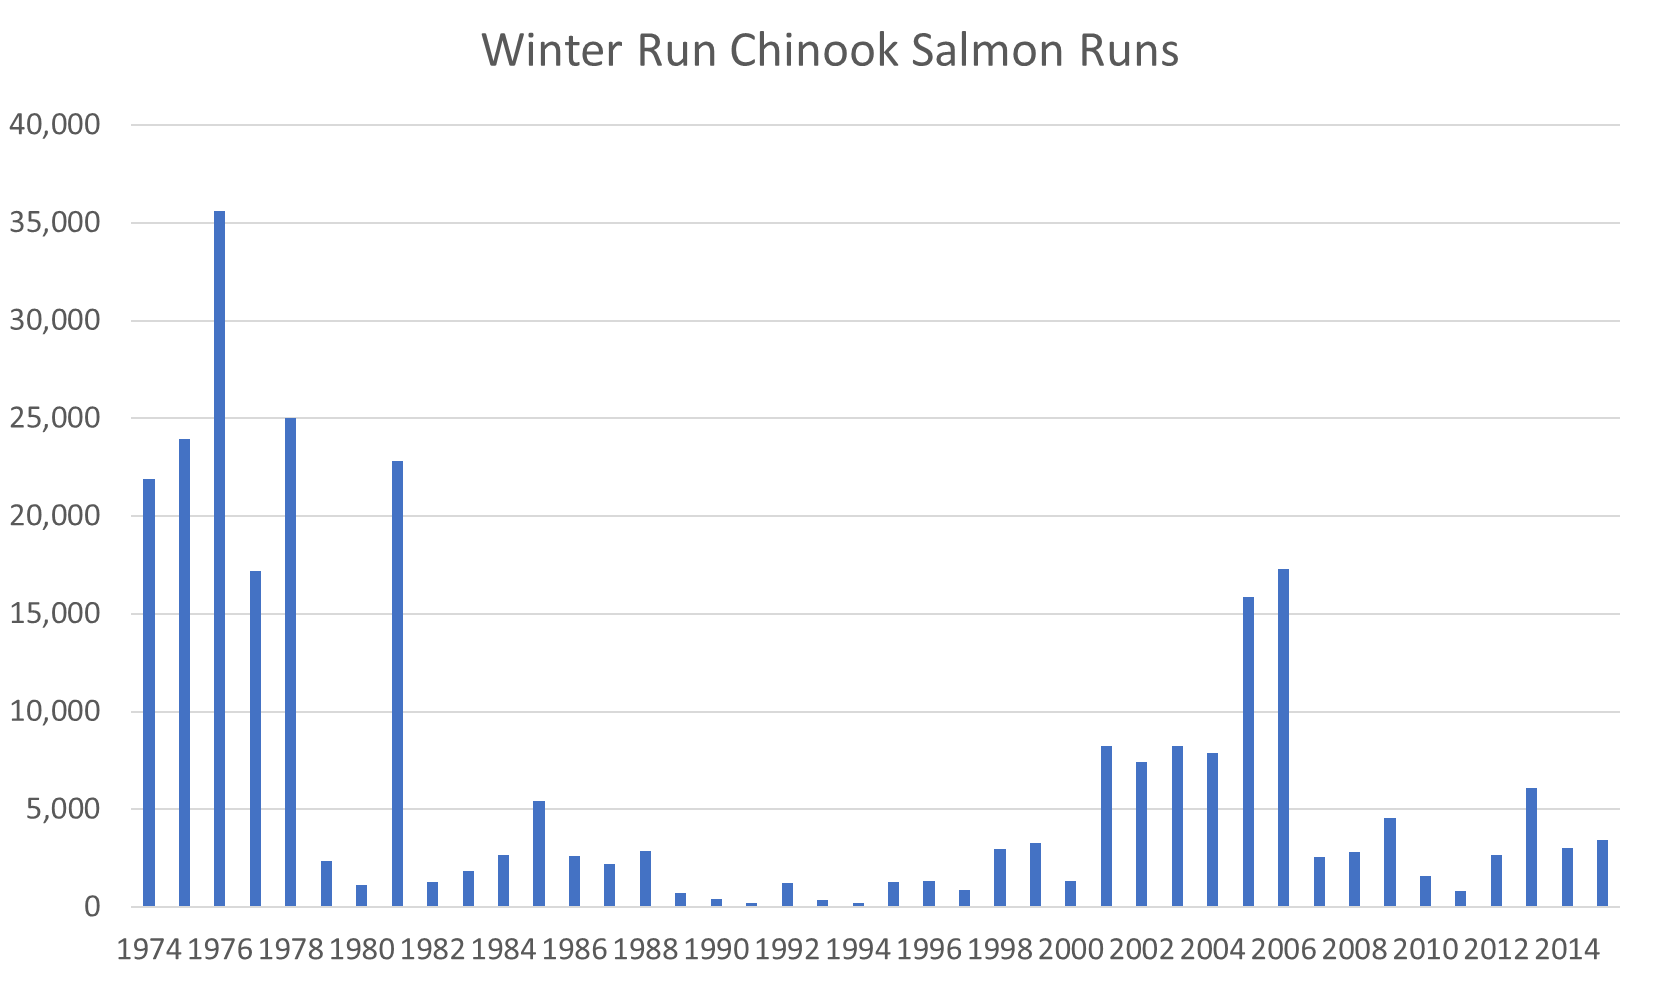
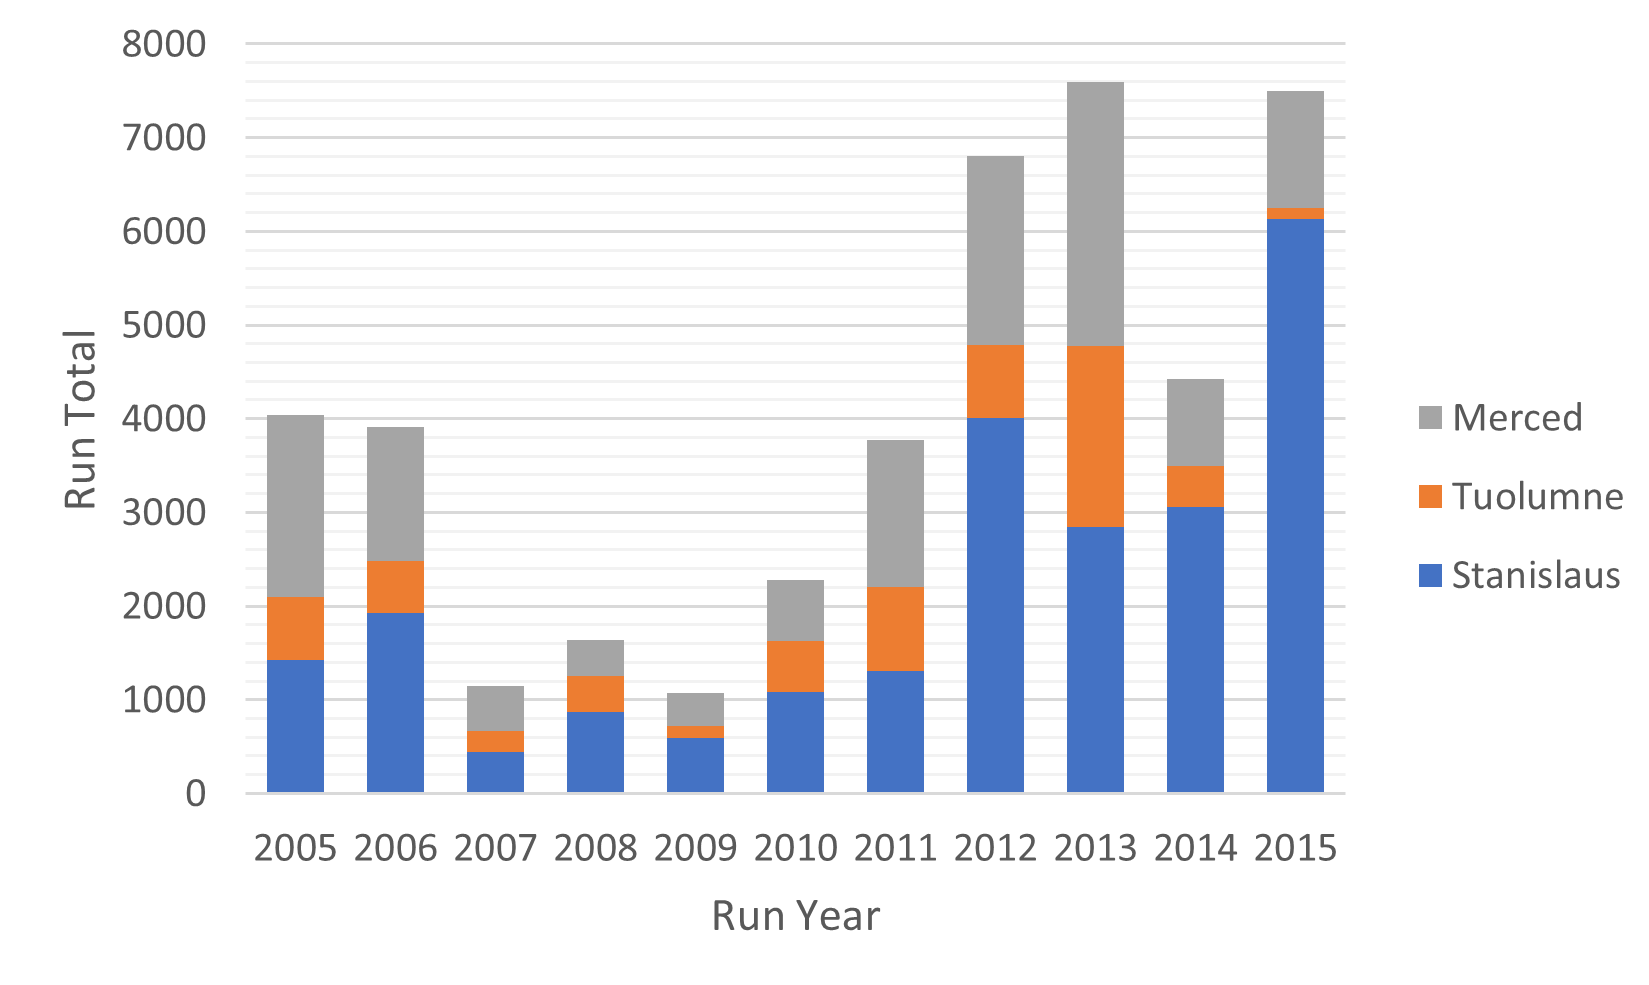
Recently, I wrote about the fall Chinook salmon runs on the San Joaquin River and its three major tributaries over the past six years. Salmon counts in San Joaquin tributaries showed an increase in returning adults in 2012-2015 compared to the devastating returns in 2007-2009. This increase occurred despite the five-year (2012-2016) drought in the San Joaquin watershed. The number of spawners in 2012-2015 was still well below the returns in the eighties and nineties that corresponded to wet water year sequences. See Figure 1.
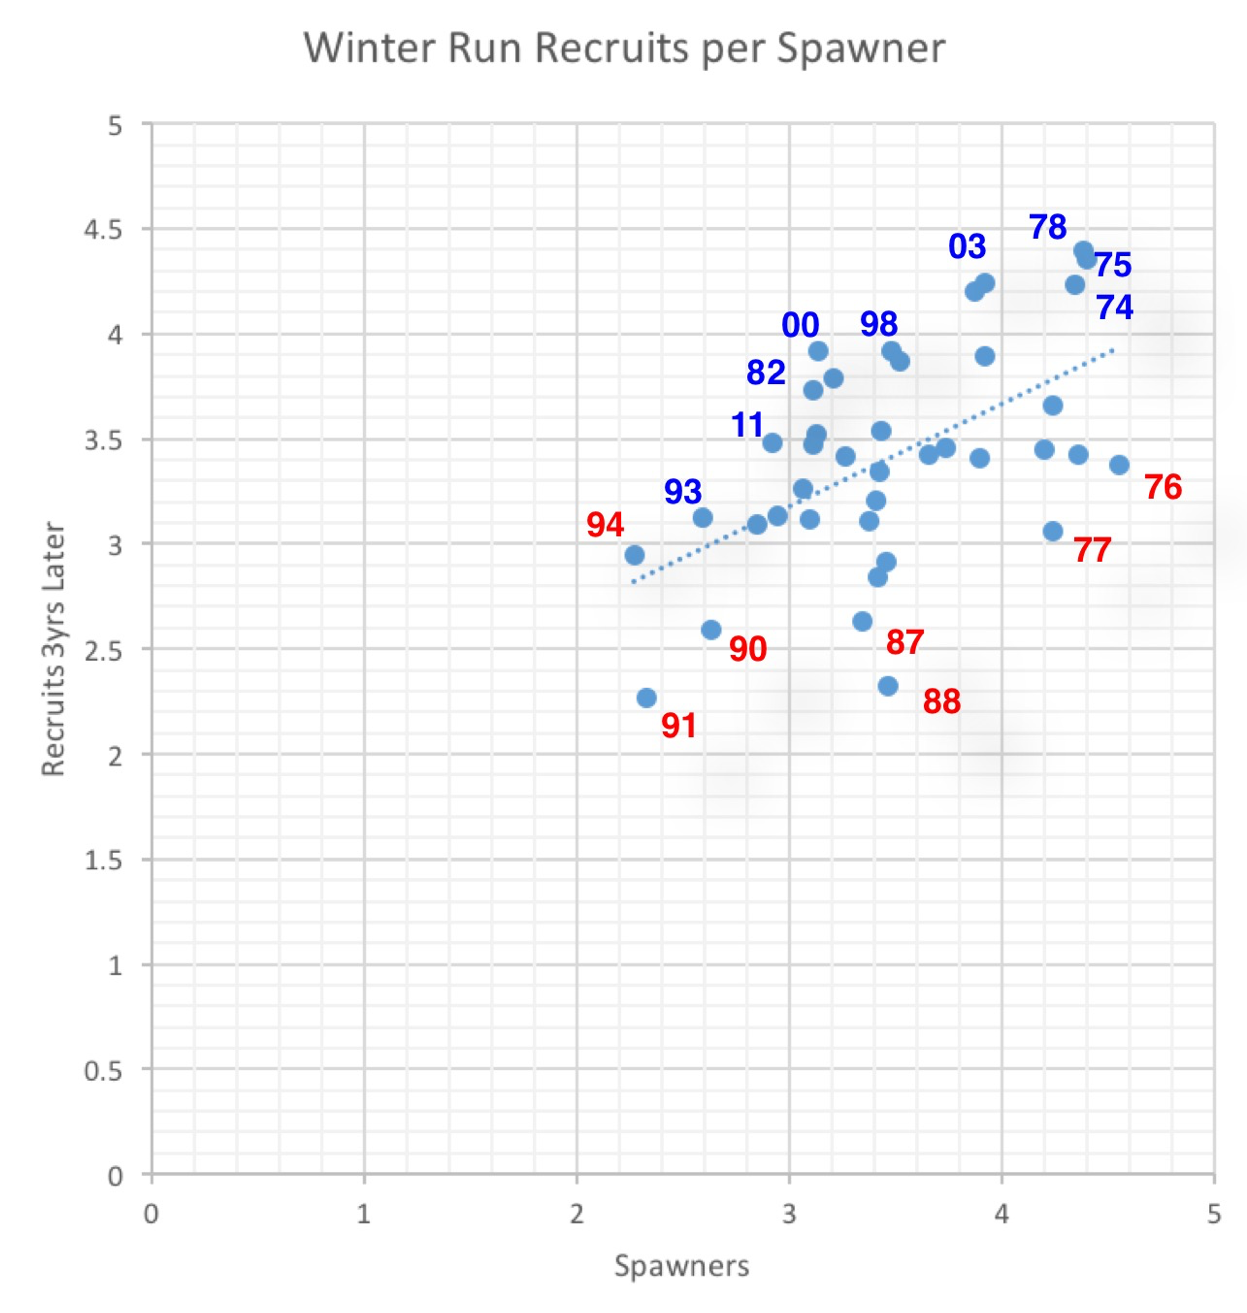
A close look at recruitment per spawner in the population over the past 40 years (Figure 2) provides clear evidence that recruitment suffers in years with dry winter-springs or dry falls. That relationship overwhelms the background relationship between spawners and recruits three years later.
- Recruitment is significantly depressed in drier years compared to wetter years. The major contributing factor is likely poor survival in winter-spring of juveniles in their first year.
- Recruitment is severely depressed for year classes rearing in critical years and returning as adults two years later in critical years (e.g., 88, 89).
- Recruitment can be depressed for year classes with good winter-spring juvenile rearing conditions but poor conditions when adults return (e.g., 05, 06).
- Recruitment can be enhanced for year classes with poor winter-spring young rearing conditions but very good fall conditions for adults returning (e.g., 81).
- Recruitment was enhanced in recent years likely as a consequence of increased flow requirements since 2009 (e.g., 09-13).
- There is an underlying positive spawner/recruit relationship, but it is overwhelmed by the effect on recruitment of flow-related habitat conditions.
- Poor ocean conditions in 2005-2006 likely contributed to poor recruitment.
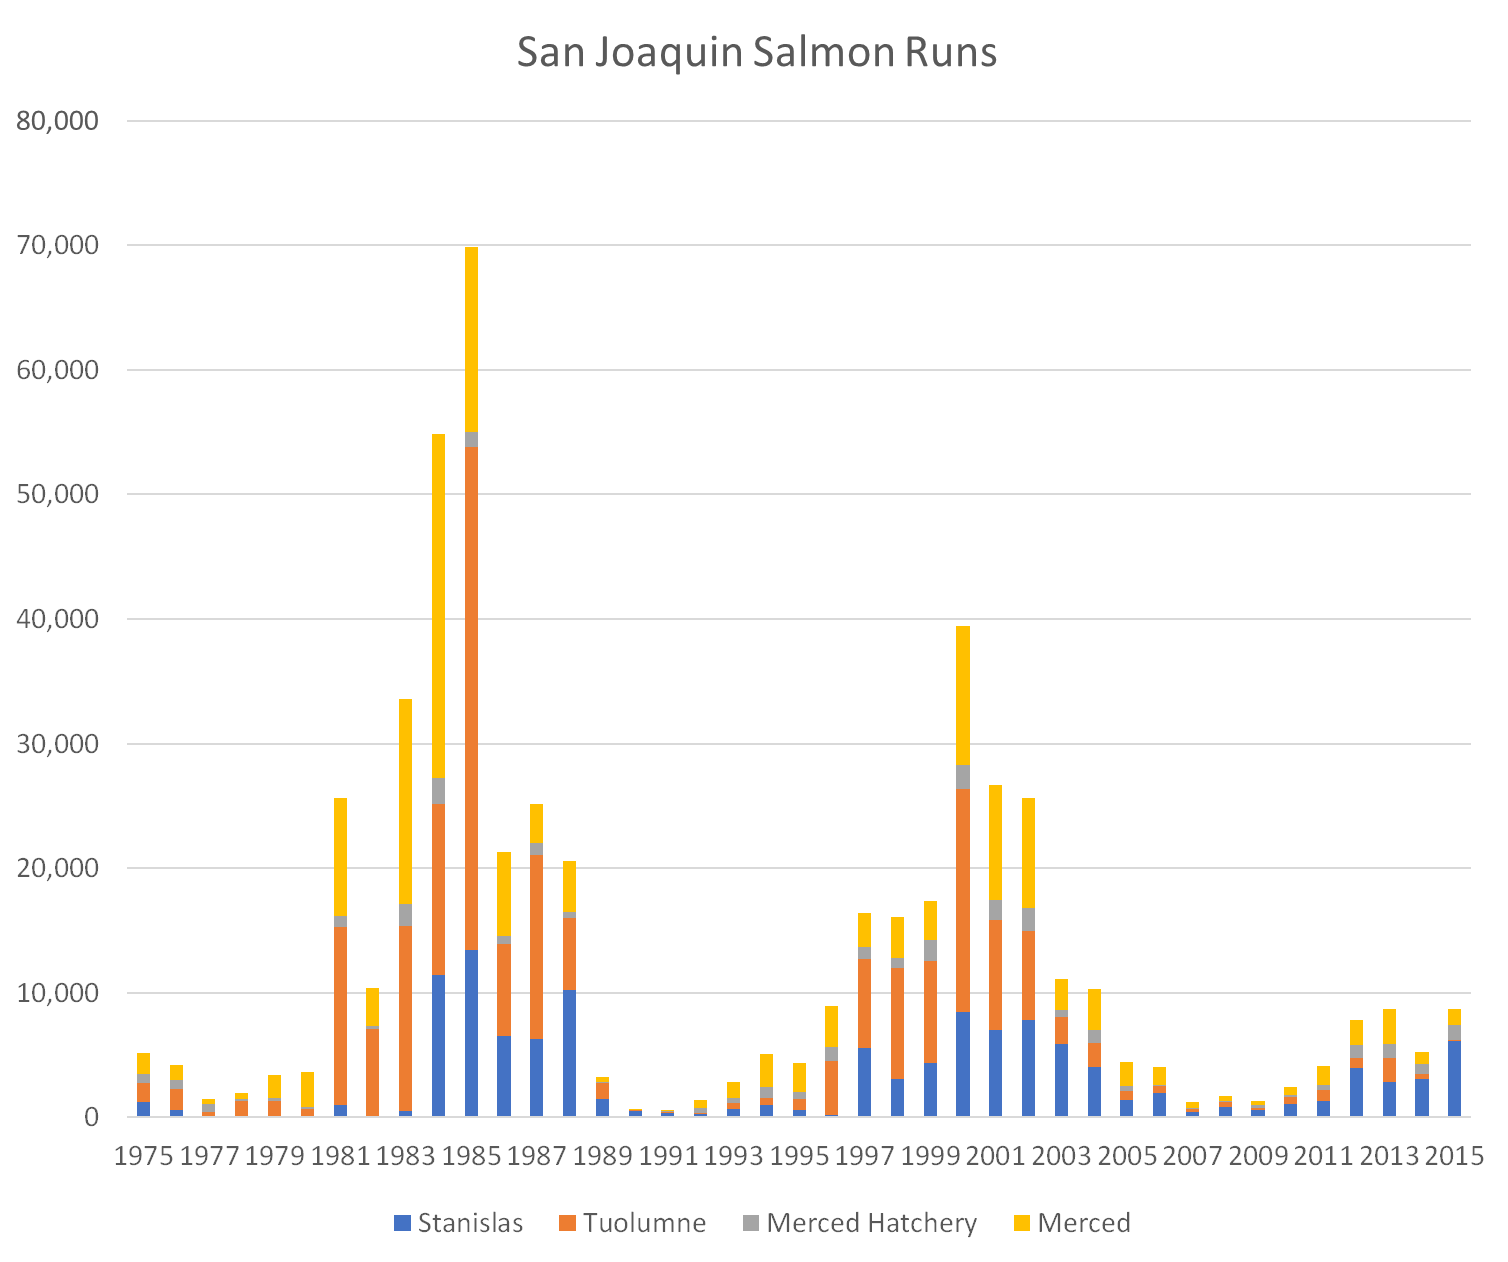
Figure 1. Chinook salmon runs in the San Joaquin River as comprised by its three spawning tributaries from 1975-2015. Data source: CDFW.
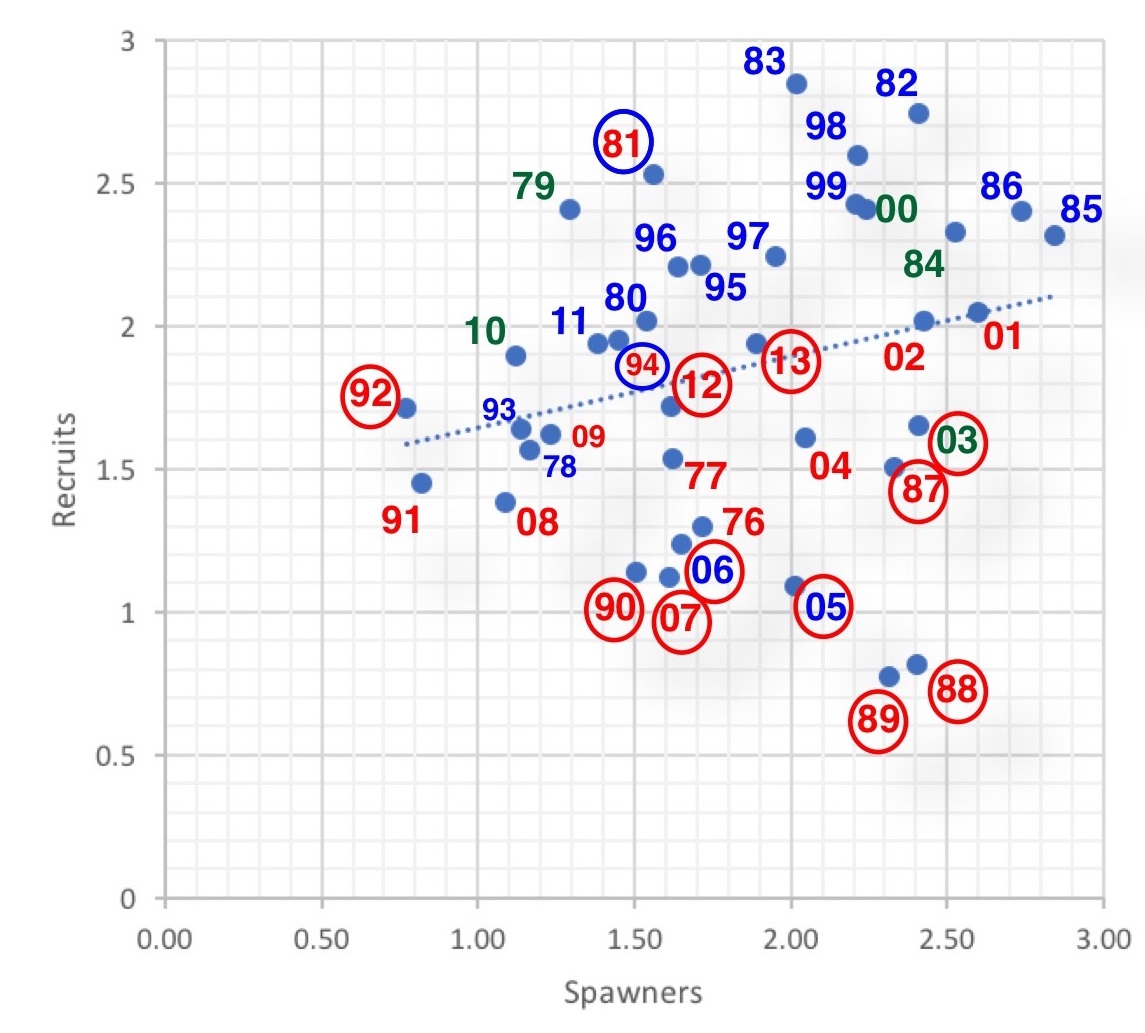
Figure 2. Recruits per spawners relationship ((log10X)-2) for San Joaquin River fall run Chinook salmon 1976-2015. The year shown is the year that the salmon were rearing as juveniles in the rivers in their first year of life. (For example: year 13 represents the progeny of the fall 2012 spawn; these juveniles in 2013 would have spawned as 3-year-old adults in 2015). Red years are critical and dry water years. Blue years are wet water years. Green years are normal water years. Red circles represent years when fall conditions during spawning would have reduced recruitment (for example: year 13 red circle indicates poor fall conditions during the fall of 2015). Blue circles represent years when fall conditions were good when recruits returned. (For example: year 81 has blue circle because 1983 fall conditions were good/wet year). Note that year 14 is as yet unavailable for inclusion in the dataset because run counts for fall 2016 are not yet available.