Increased Delta exports by the federal Bureau of Reclamation in early April resulted in increased salvage of salmon and longfin smelt at the Central Valley Project’s south Delta Tracy Pumping Plant. Salmon smolts salvaged were predominately from the San Joaquin spring-run salmon recovery program hatchery (Figures 1 and 2). Longfin smelt salvage increased in mid-April (Figure 3) as young longfin reached salvageable size (~25 mm).
Salvage at the State Water Project was much lower in April as the California Department of Water Resources’ (DWR) reduced exports to try to offset the impacts of Reclamation’s increased pumping (Figures 2 and 3).
The state’s Bay-Delta Water Quality Control Plan requires that exports be reduced to be no higher than the San Joaquin River flow at Vernalis from April 15 through May 15. The Bureau of Reclamation and the California Department of Water Resources (DWR) were allowed to move those dates up in 2020, so that the month-long reduction began on April 10 (Figure 4). The average Vernalis flow was about 1500 cfs in mid-April, which is why exports wound down as required (Figure 3).
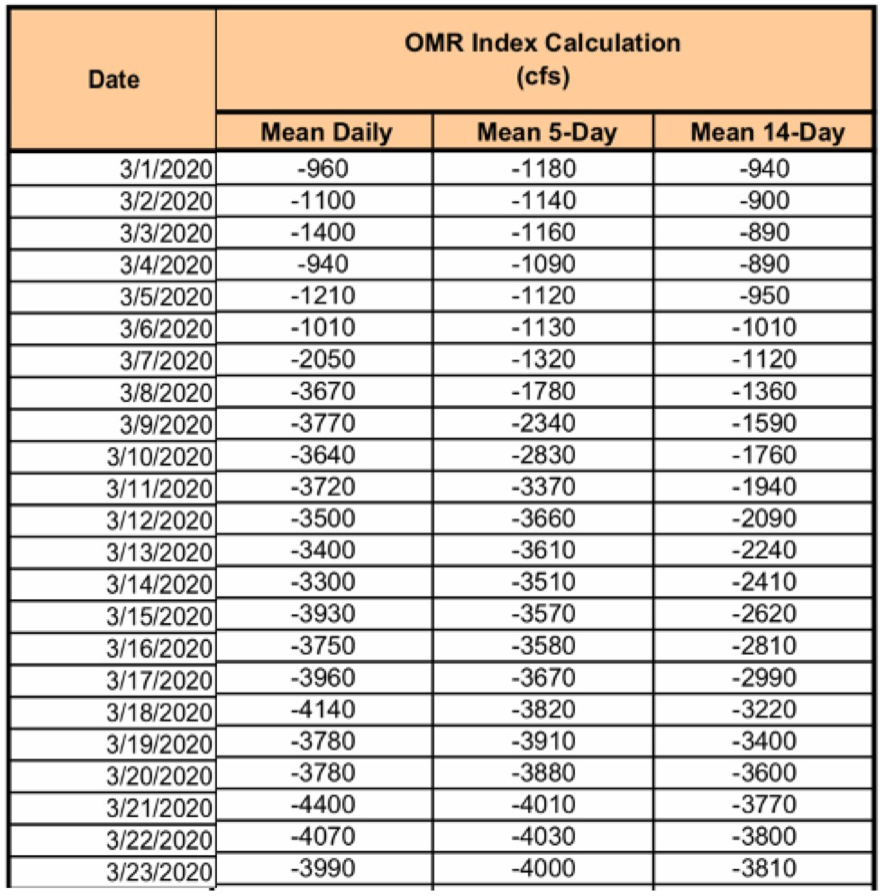
High exports in early April drew migrating salmon and longfin smelt into the south Delta. Old and Middle River (OMR) flows reached their limit of -5000 cfs (Figure 4). Thus, even after Reclamation and DWR reduced exports on April 10, salvage of both salmon and smelt continued to be high for a week, tapering down to lower levels on April 20.
State and federal exports should not have been ramped up in late March and early April. Had they been given the opportunity, the joint state and federal smelt and salmon science working groups would have recommended a range of -1500 to -2500 cfs OMR limit given the risks to salmon and smelt. However, in the epoch of the 2020 federal Biological Opinions for Delta operations, Reclamation has chosen to export as much as allowed by its view of the letter of the law. California’s view of the law is different: on April 21, 2020, California sought an injunction as part of its ongoing lawsuit against Reclamation’s operations under the new BiOps. See https://oag.ca.gov/system/files/attachments/press-docs/Memorandum%20in%20support%20of%20Preliminary%20Injunction.pdf and https://oag.ca.gov/system/files/attachments/press-docs/CNRA%20et%20al.%20v.%20Ross%20et%20al.%20FAC.pdf
If we want to save salmon and smelt, we simply must reduce exports in winter and spring, especially in drier years, as was generally standard procedure over the past decade under the 2008-09 federal Biological Opinions.
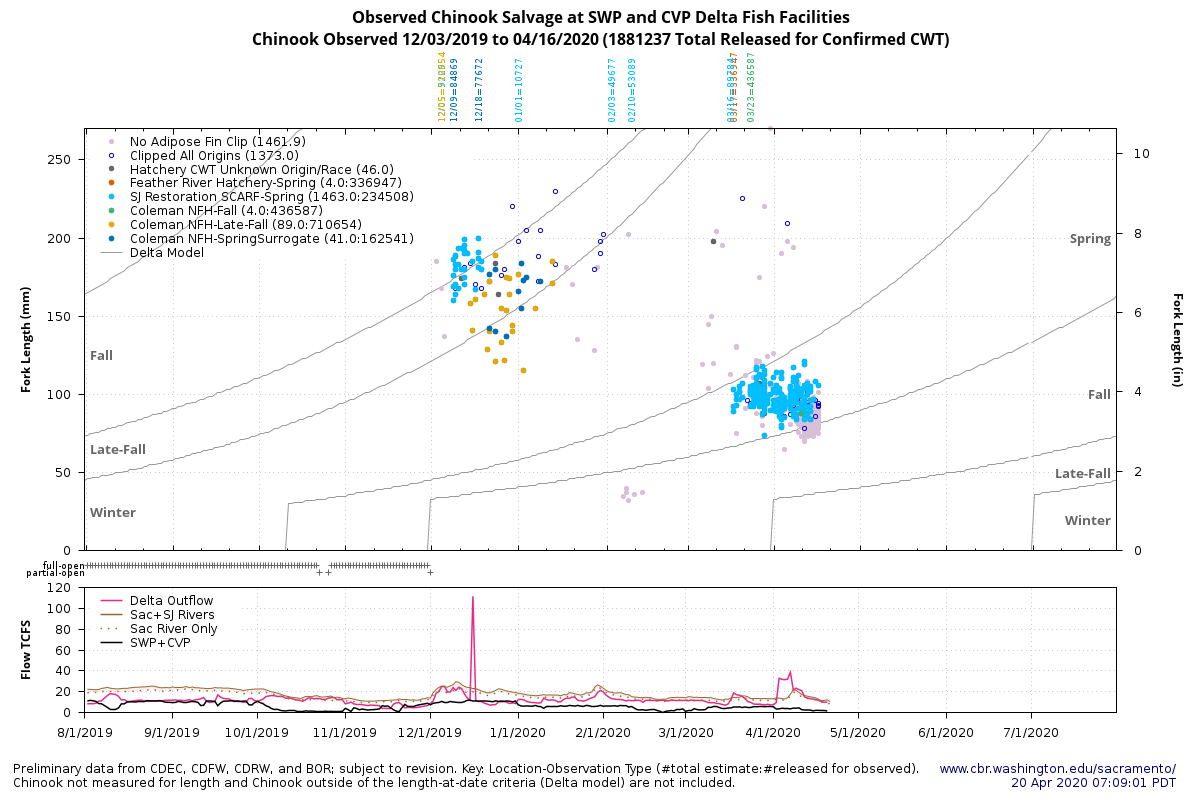
Figure 1. Salvage of salmon in water year 2020. The blue dots represent salvage of San Joaquin spring-run hatchery smolts.
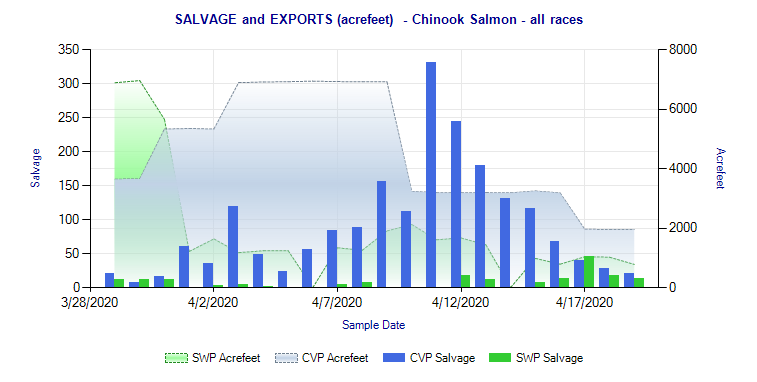
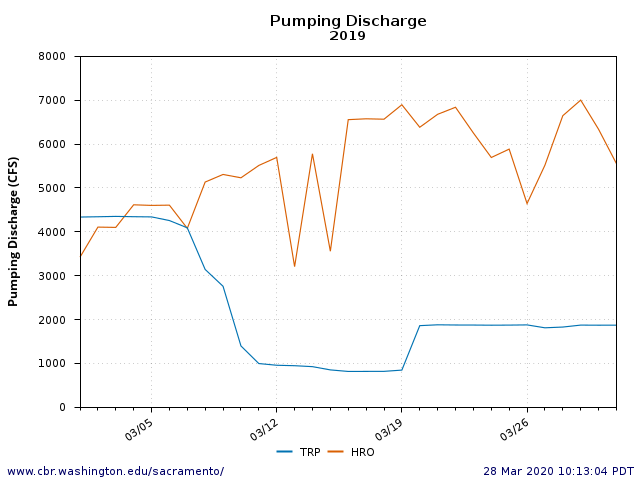
Figure 2. Late March and April 2020 daily Delta export rates and salvage of young salmon.
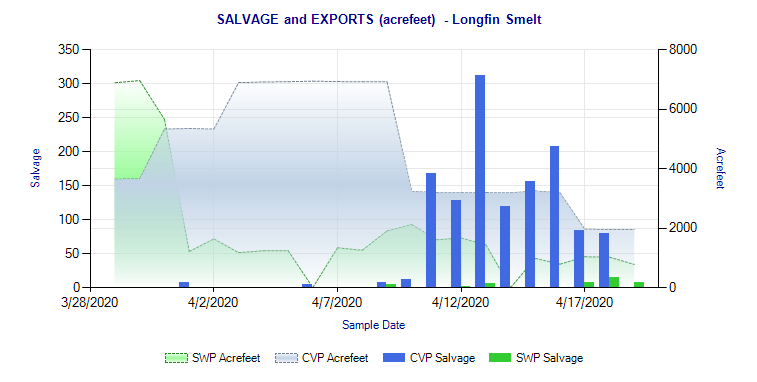
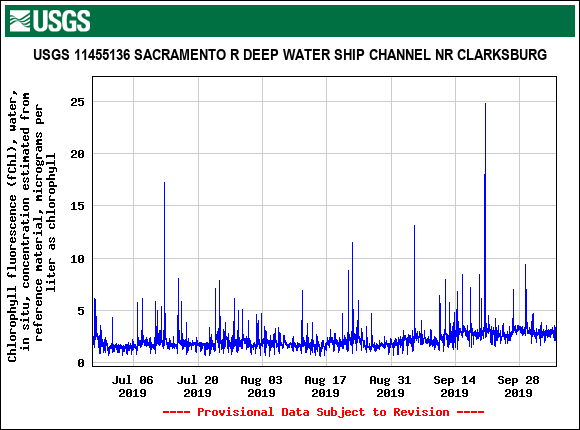
Figure 3. April 2020 daily Delta export rates and salvage of young longfin smelt at south Delta export facilities
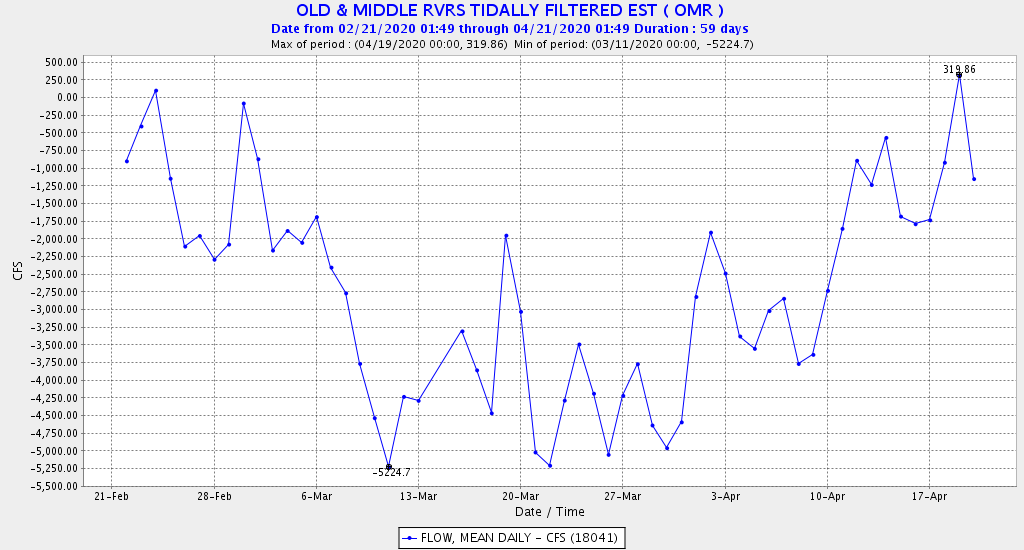
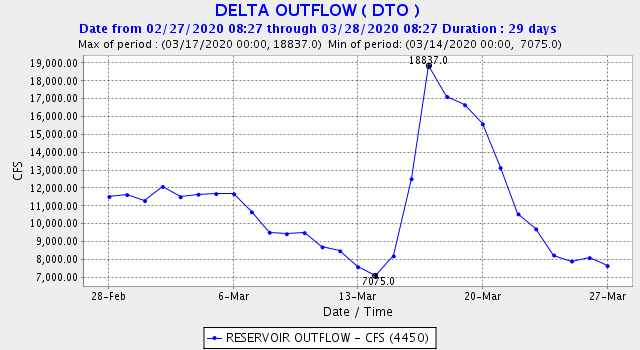
Figure 4. Old and Middle River (OMR) flow in the central Delta in 2020.