The Delta Cross Channel (DCC) (Figure 1) is closed in spring to minimize the diversion of juvenile salmon from the Sacramento River into the central Delta. However, opening the DCC in May and June will help reduce the detrimental effects of drought on Delta Smelt and Delta water quality.
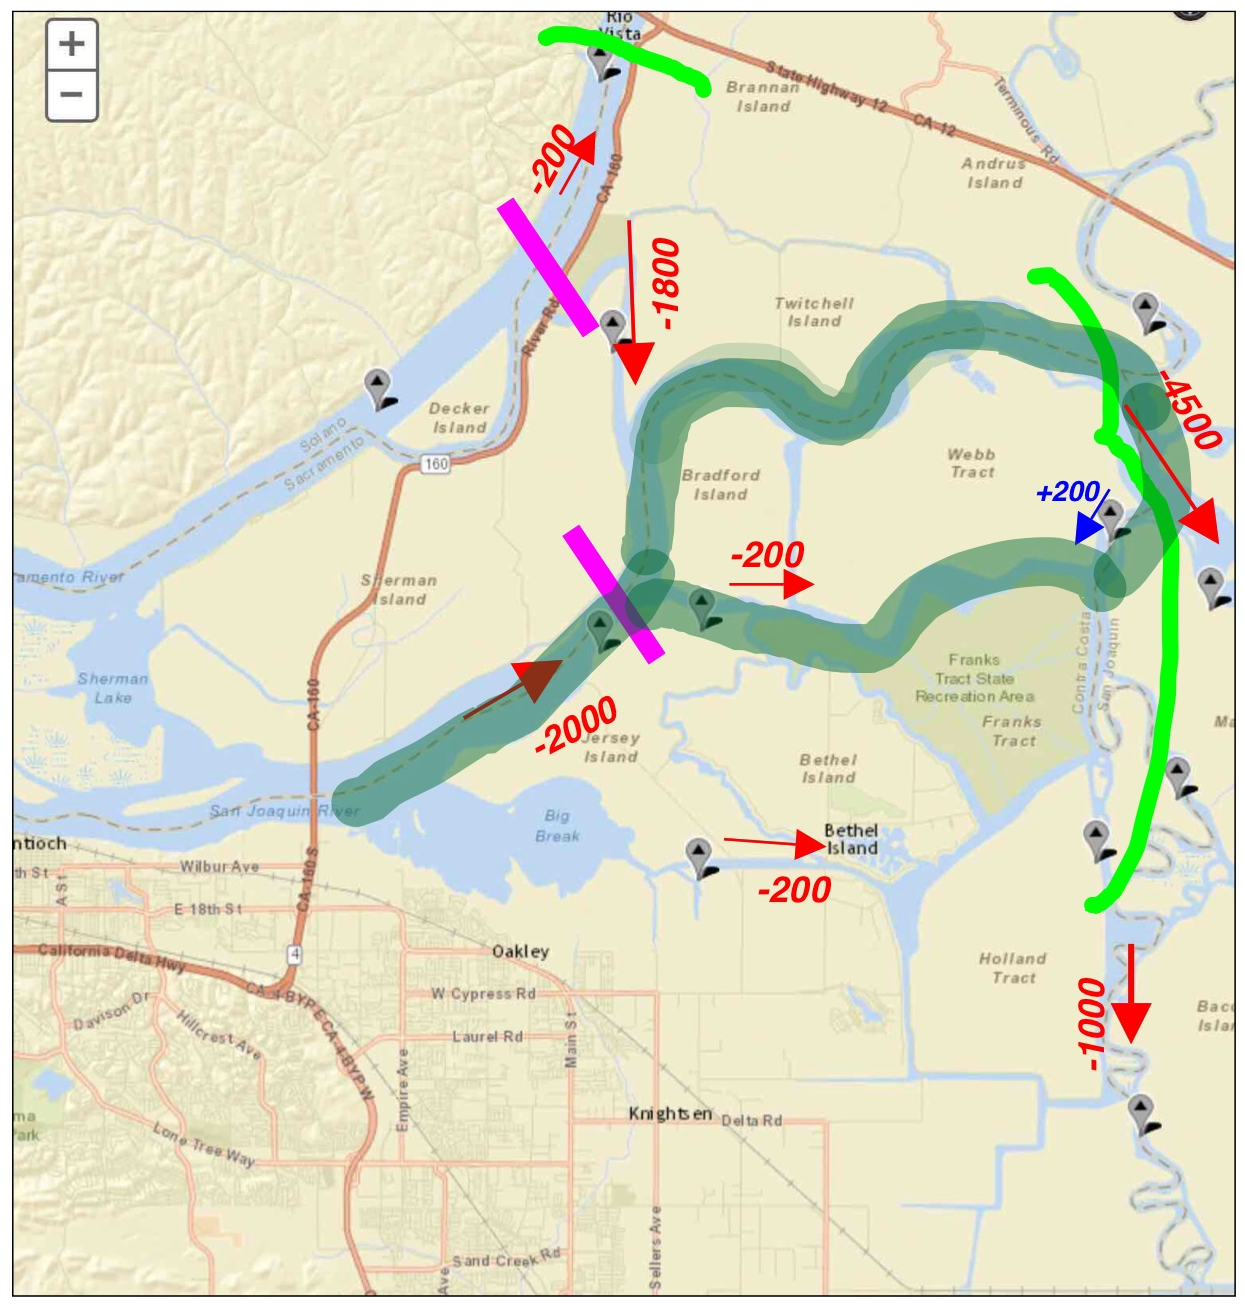
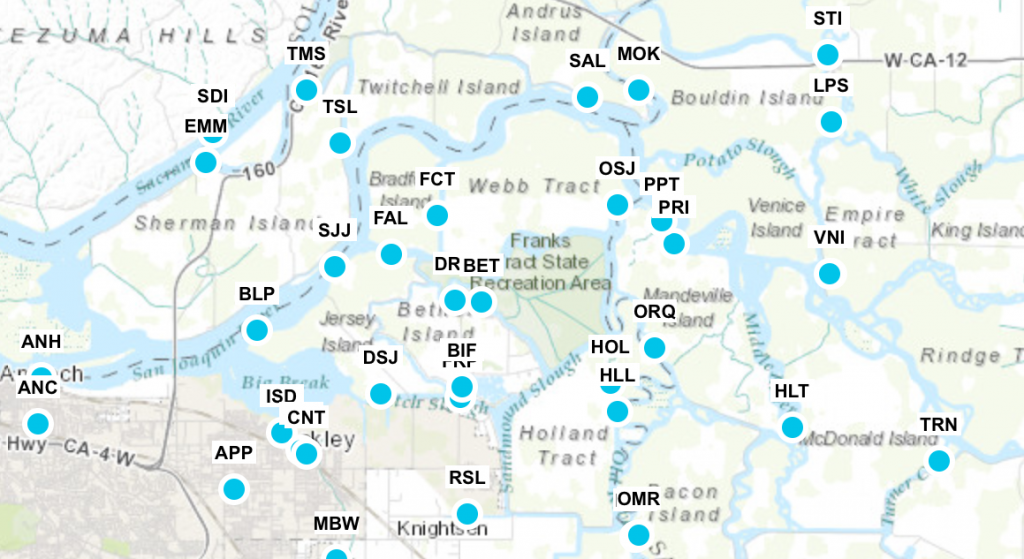
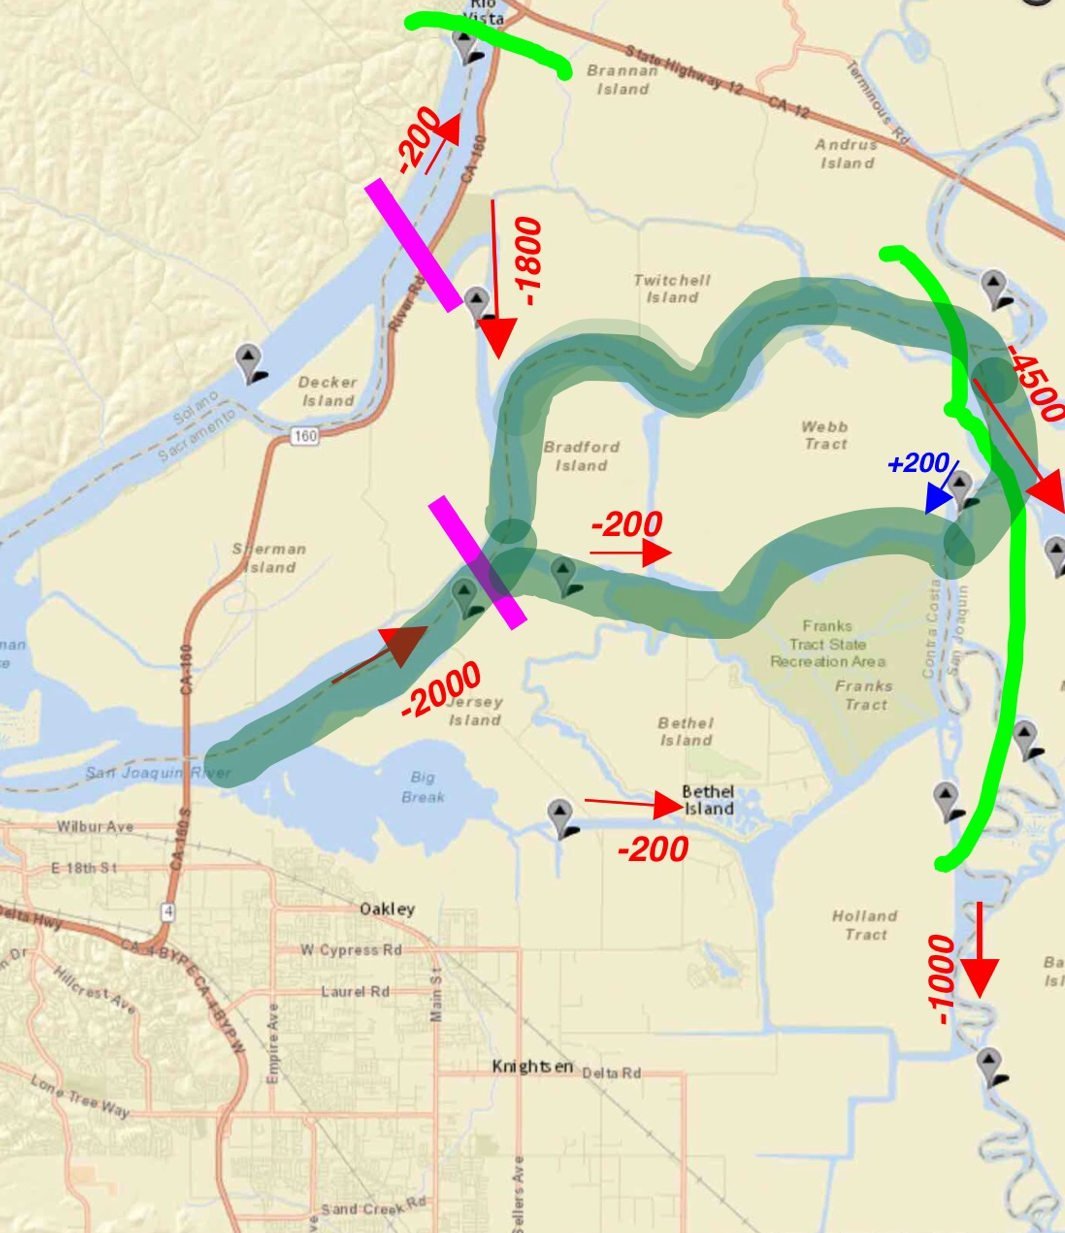
With San Joaquin River inflows to the Delta at extreme lows and the DCC closed, fresh water flow to the south Delta export pumps comes primarily from the Sacramento River via Threemile Slough (TSL) and Georgiana Slough (GGS) (Figure 2). Net flows from both these sloughs are south toward the state and federal pumping plants via Old and Middle Rivers. Delta Smelt enter the central Delta via Threemile Slough. Salmon, sturgeon, steelhead, and striped bass young enter the central Delta via Georgiana Slough as well as Threemile Slough. Opening the DCC will change Delta net flow patterns and contribute to net downstream flows in the lower San Joaquin River in the central Delta (Figure 2), thus benefitting all the fish entering the central Delta including those migrating downstream from the San Joaquin and its tributaries. With the DCC open, less salt will intrude into the central Delta with the more positive net flows of the lower San Joaquin River. Less of the Low Salinity Zone and its concentrations of pelagic fishes including smelt will flow or be tidally pumped upstream into the central Delta. More of south Delta exports will come directly from the Sacramento River via the DCC, rather than through Threemile Slough or Georgiana Slough, or fromthe Low Salinity Zone.
Yes, the late spring migrations of young wild salmon and steelhead, as well as larval Striped Bass and sturgeon from their spring spawns will enter the Central Delta via the DCC, but fewer will enter via Threemile and Georgiana sloughs. Those that do enter the central Delta will benefit from higher net positive downstream flows in the lower San Joaquin River channel to the Bay. Opening the gates only in daytime may provide many of the above benefits while minimizing impacts (Perry et. Al. 2013, 2015).
Perry, R. W., P. L. Brandes, J. R. Burau, P. T. Sandstrom & J. R. Skalski. 2015.
Effect of Tides, River Flow, and Gate Operations on Entrainment of Juvenile Salmon into the Interior Sacramento–San Joaquin River Delta
Transactions of the American Fisheries Society. Volume 144, Issue 3, 2015, pages 445- 455.
Perry, R. W., P. L. Brandes, J. R. Burau, A. P. Klimley, B. MacFarlane, C. Michel, and J. R. Skalski. 2013. Sensitivity of survival to migration routes used by juvenile Chinook Salmon to negotiate the Sacramento–San Joaquin River Delta. Environmental Biology of Fishes 96:381–392.
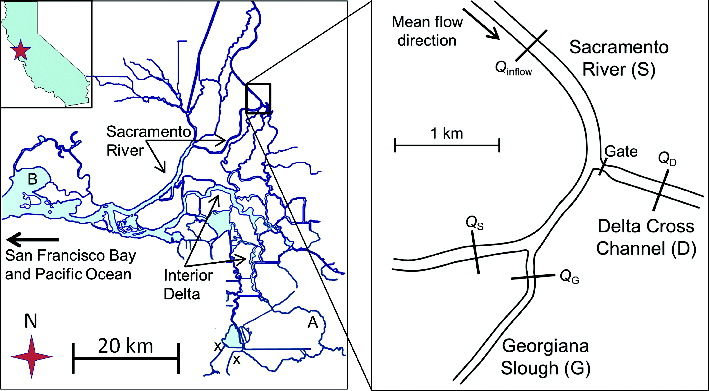
Figure 1. Location of Delta Cross Channel gate.

Figure 2. Central Delta net flow changes from opening Delta Cross Channel (DLC in map). Blue arrows are increased net flows. Red arrows signify decrease in net flows. Blue dots indicate CDWR CDEC flow gages. (Base Map Source: CDEC)