The California Department of Water Resources (DWR) and the U.S. Bureau of Reclamation (Reclamation) released a Central Valley Drought Contingency Plan Update on August 31, 2021, stating:: “Project operations are still tracking with the operations forecast included in the July Drought Plan addendum. August has been fairly typical, with operations primarily controlled by system-wide depletions and Delta salinity.” This is like a dispatch from the captain of the Titanic saying: the ship was tracking course since the last report, and yes, it hit the iceberg. As is fairly typical under such circumstances, it sunk, primarily due to the hole in the hull.
The “depletions” that caused the current gaping hole in Shasta Reservoir’s storage and the resulting lethal downstream water temperatures, to reach full effect in September, didn’t just happen. These glibly described “depletions” are primarily the excessive deliveries to Sacramento River Settlement Contractors to which this blog, CSPA, and others have been vociferously objecting since March. And, of course, what is sunk is not the good ship Reclamation. It is the year’s cohorts of Sacramento River salmon, just like in the disasters of 2014 and 2015.
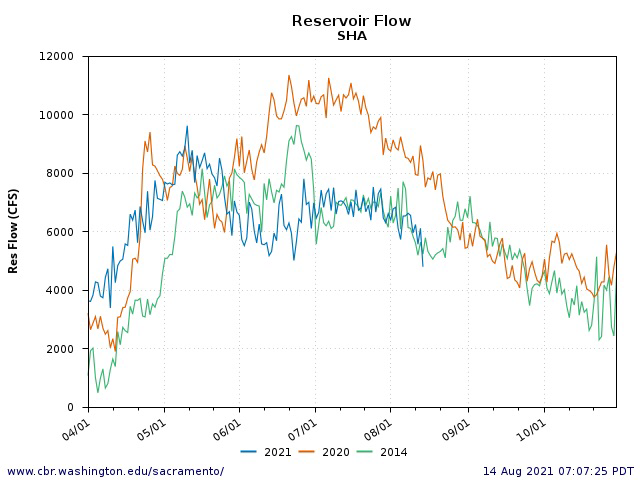
Shasta-Keswick Storage Releases to the Upper Sacramento River
In 2021, Reclamation has not heeded the lessons learned in the 2013-2015 drought. In 2021, Reclamation has not even implemented the feeble salmon-saving drought actions it applied in 2014 and 2015.
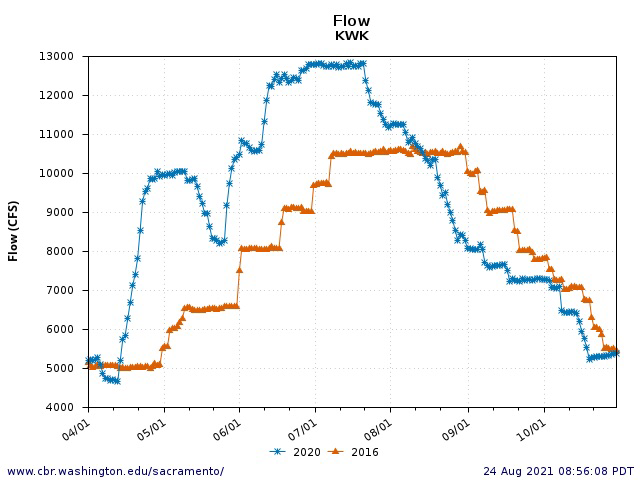
- April-May Keswick storage releases were higher in 2021 than 2014 (+257 TAF) and 2015 (+185 TAF) (Figure 1). Reclamation restricted releases in 2014 and 2015 in April-May to preserve Shasta’s cold-water pool. It did no such thing in 2021.
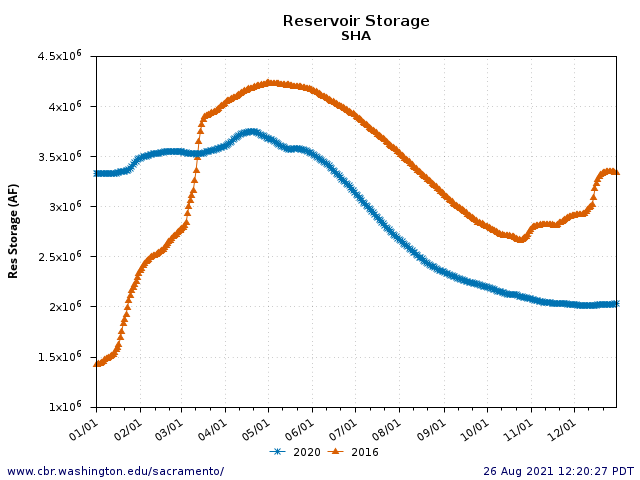
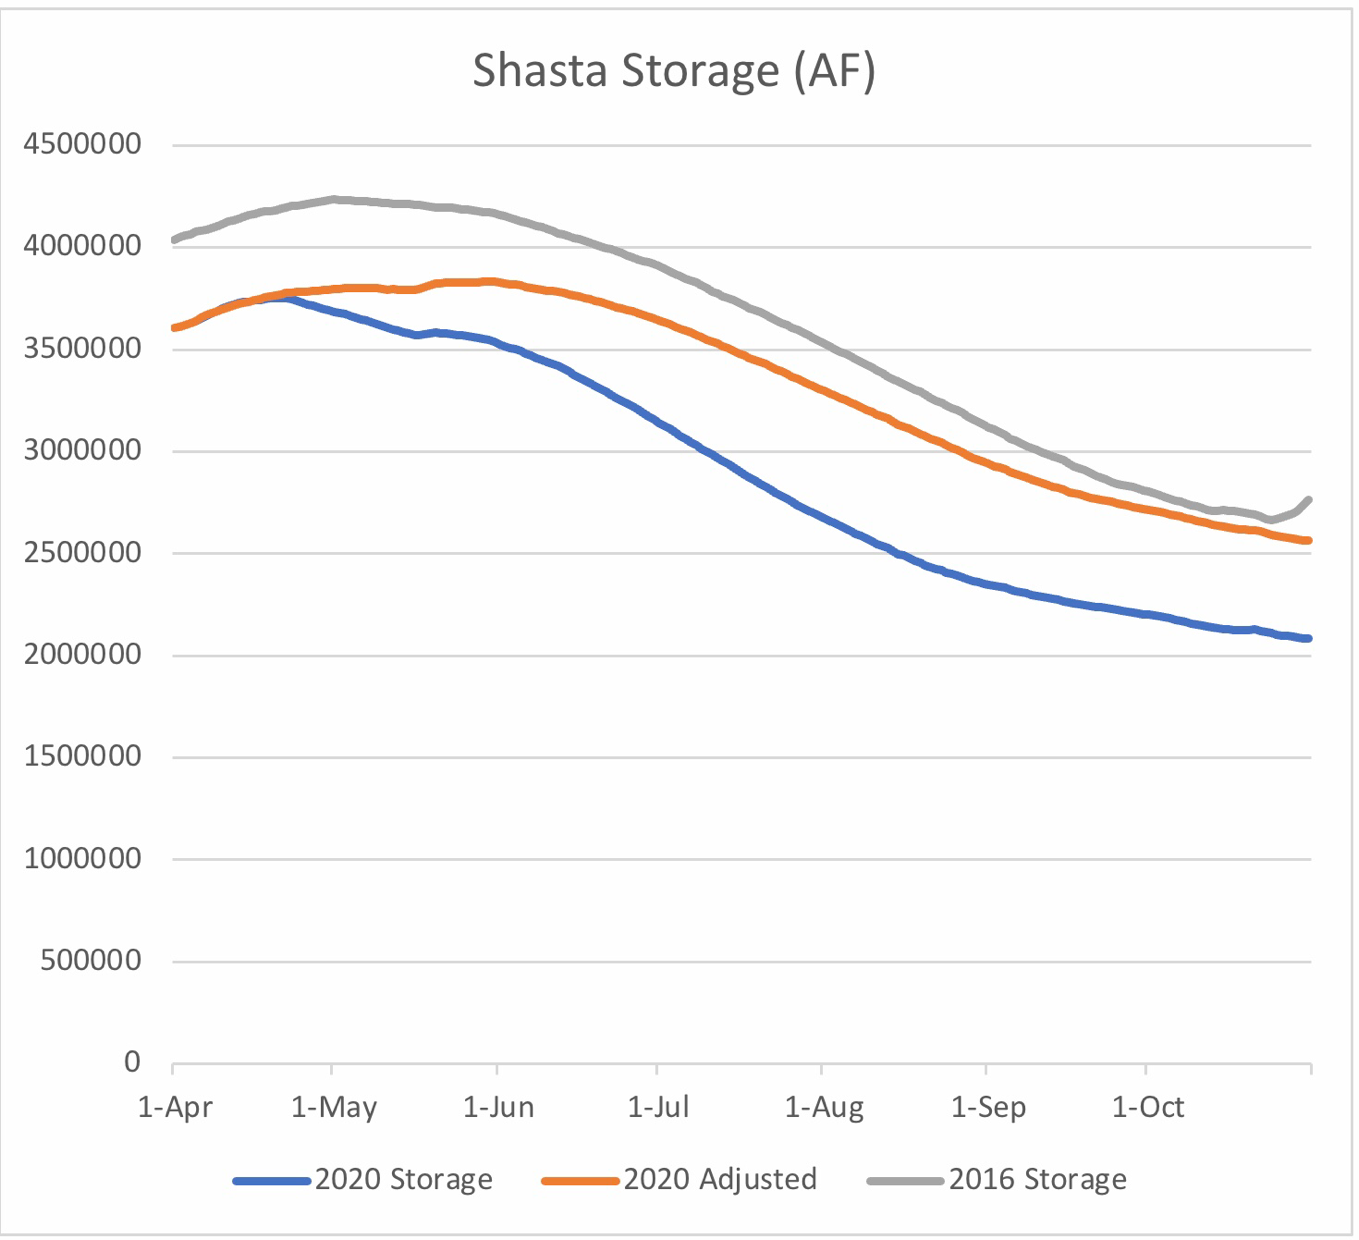
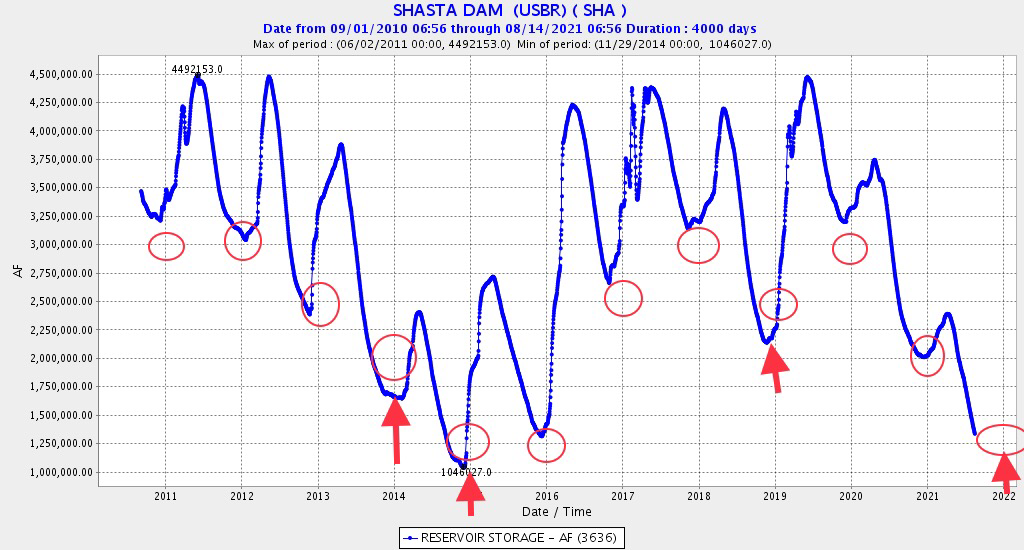
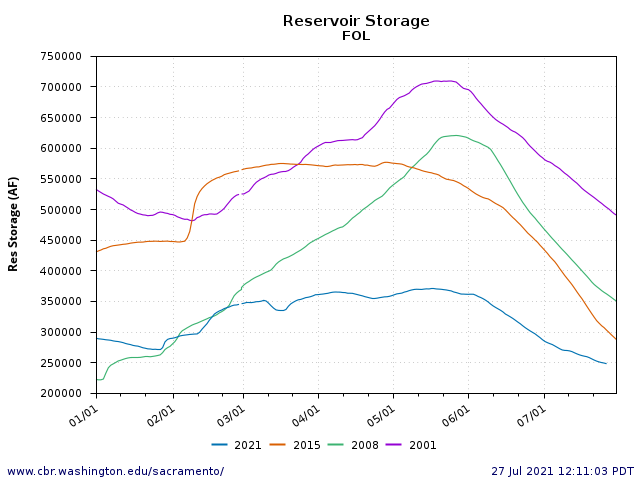
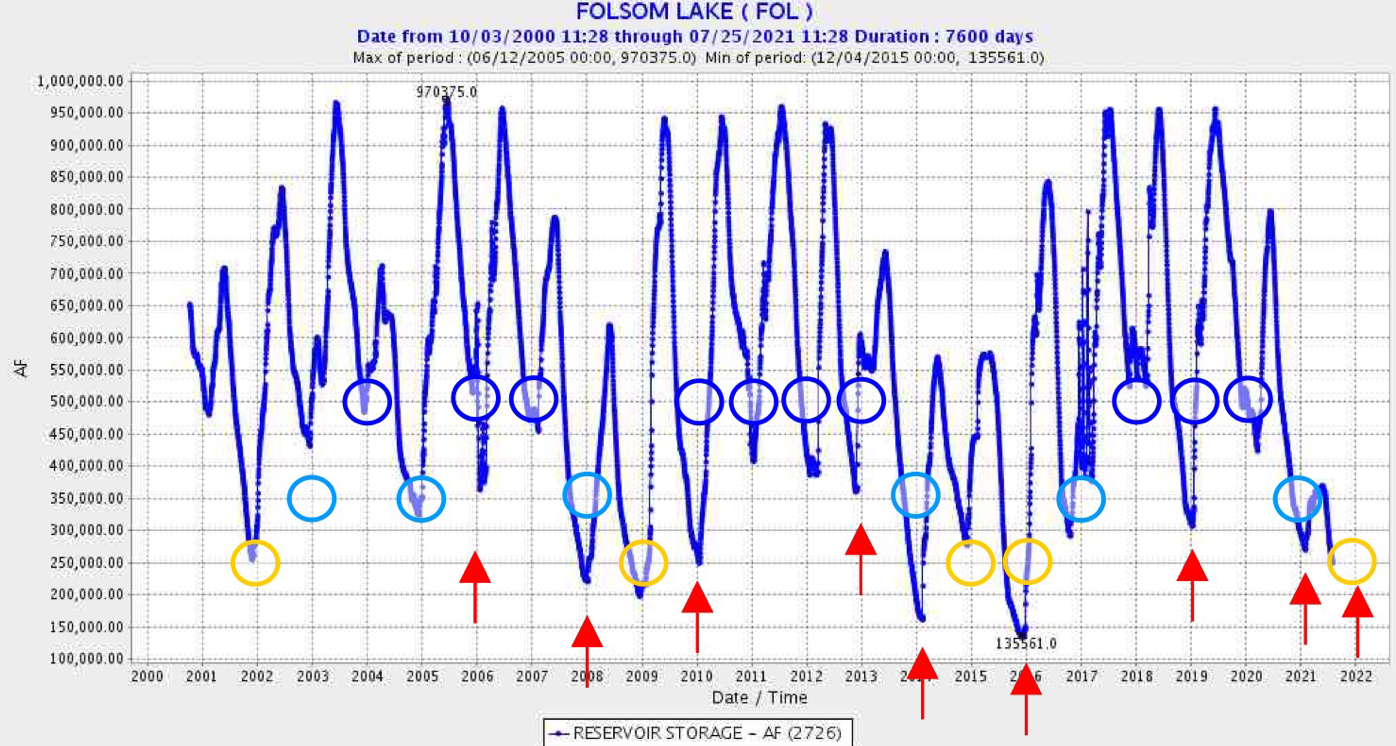
- The higher releases in 2021 led to depleted storage in Shasta Reservoir (Figure 2). Storage at the end of May 2021 was 200 TAF lower than in May 2014, after having been 200 TAF higher at the beginning of April.
- The measures to maintain steady flow/stage and water temperature prescribed for drought year 2015 were not applied in 2021. In 2021 operations reverted to the 2014 regime, or worse.
Spawning Conditions for Winter Run Salmon
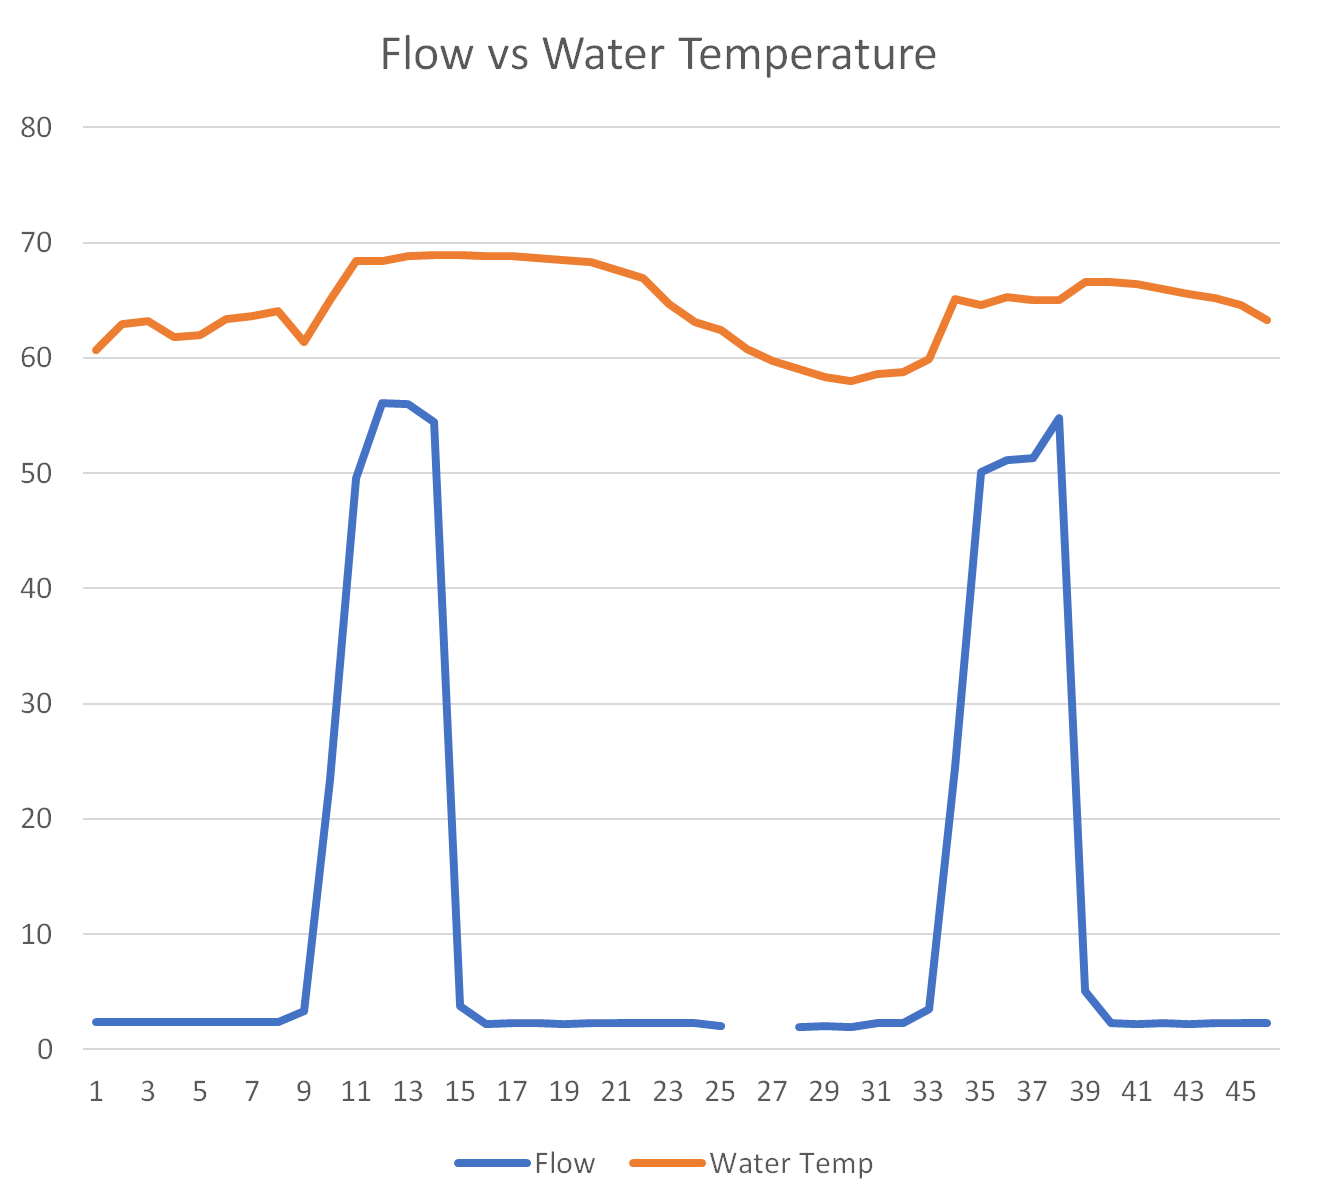
Winter-run salmon spawn from April to August, with a June-July peak in the ten miles of river downstream of Keswick Dam. Early season (April-May) flow and water temperature conditions were erratic in 2014, 2015, and 2021 (Figures 1-4). Rising flows and water temperatures stimulate the spawning migration and maturation leading up to the spawn. Water temperature above 65ºF hinder migrations and stress adult spawners. Water temperatures above 60ºF delay spawning and stress eggs in female salmon and eggs/embryos in redds.
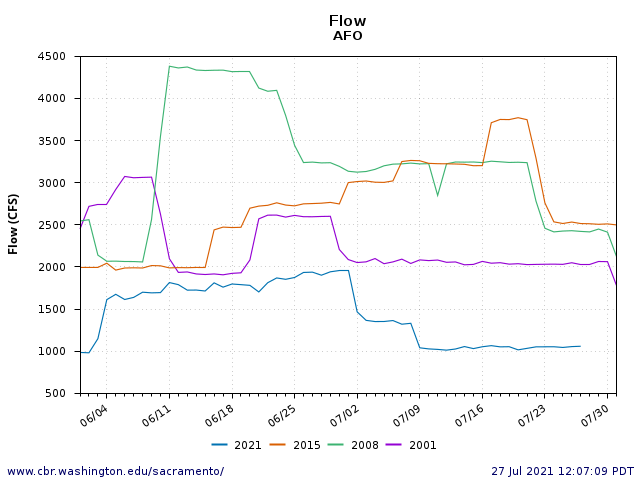
- Conditions in 2014 proved devastating for the salmon spawn because of high water temperatures in late summer as Reclamation lost access to Shasta’s cold-water pool due to low storage. In addition, a late summer drop of 2-3 feet in the stage height of the Sacramento River downstream of Keswick Dam caused spawning interruption and redd stranding (Figure 3).
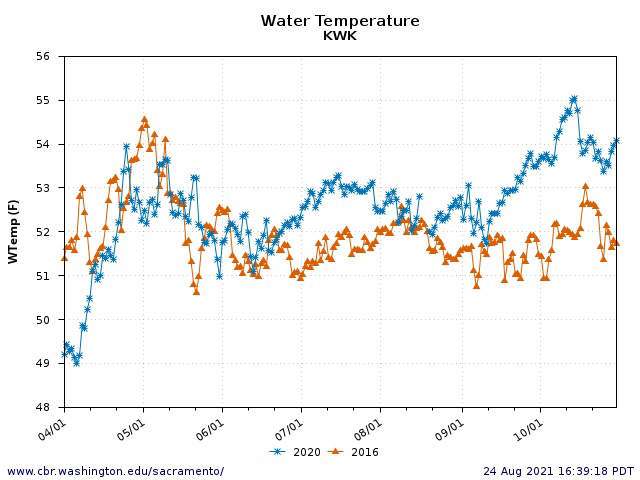
- Despite concerted efforts in 2015 to retain storage, to maintain steady flows (and stage), and to sustain colder water releases, water temperature proved too high (>55ºF) for good egg/embryo survival. The lesson learned led to the current target for good survival of <53ºF in Keswick releases.
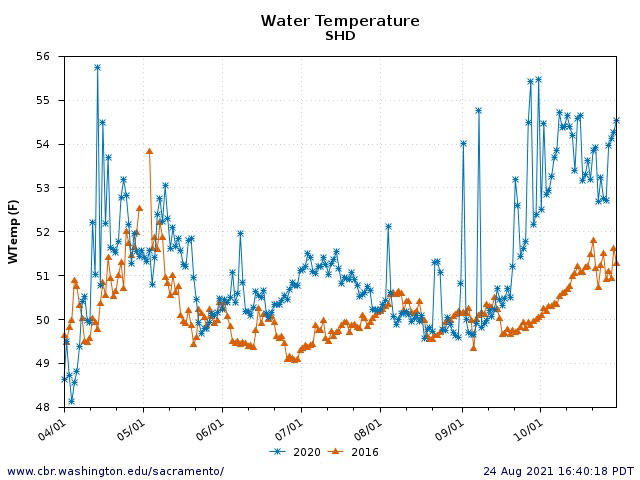
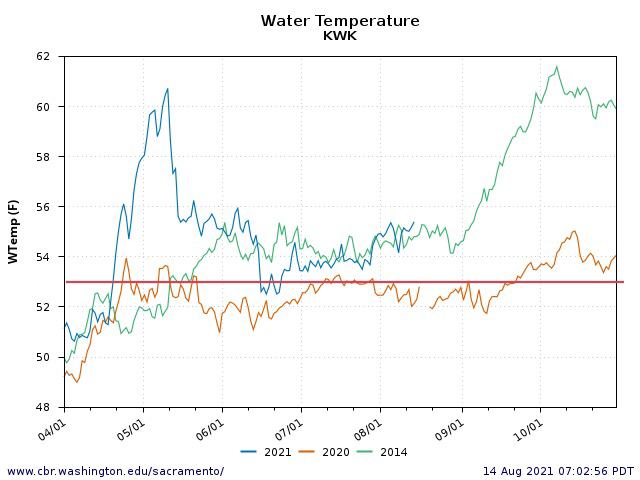
- Operations in 2021 were devastating, starting with high spring water temperatures, followed by a short period of good conditions in late June designed to stimulate spawning, before higher water temperature (Figure 4) and falling stage height greeted later winter-run spawners and egg/embryos/fry in redds.
Migration Conditions for Adult Salmon in Lower Sacramento River
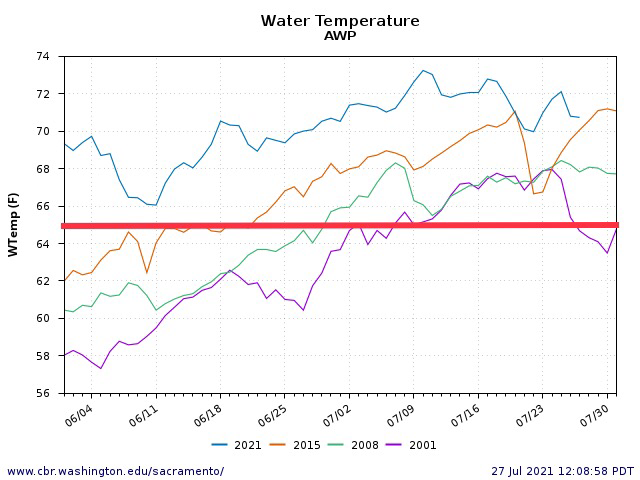
Water temperatures in the lower Sacramento River 100-200 miles downstream of Shasta Dam remained far from typical in 2021 (Figure 5). For the most part, water temperature from May through August were above the minimum stress level of 68ºF, and above the 72ºF avoidance level for weeks at a time. These conditions not only affected the late migration of winter-run salmon, but also that of the spring-run (in spring) and fall-run (in summer) who spawn in early fall.
Summary
In summary, Reclamation’s operations of Shasta Reservoir have been as bad in 2021 as they were in 2014 and 2015, or worse.
Future posts will discuss more aspects of the failures of Reclamation’s Shasta operations in 2021.
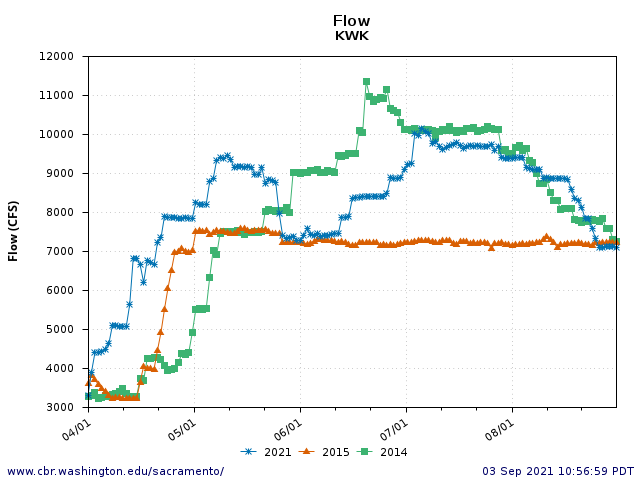
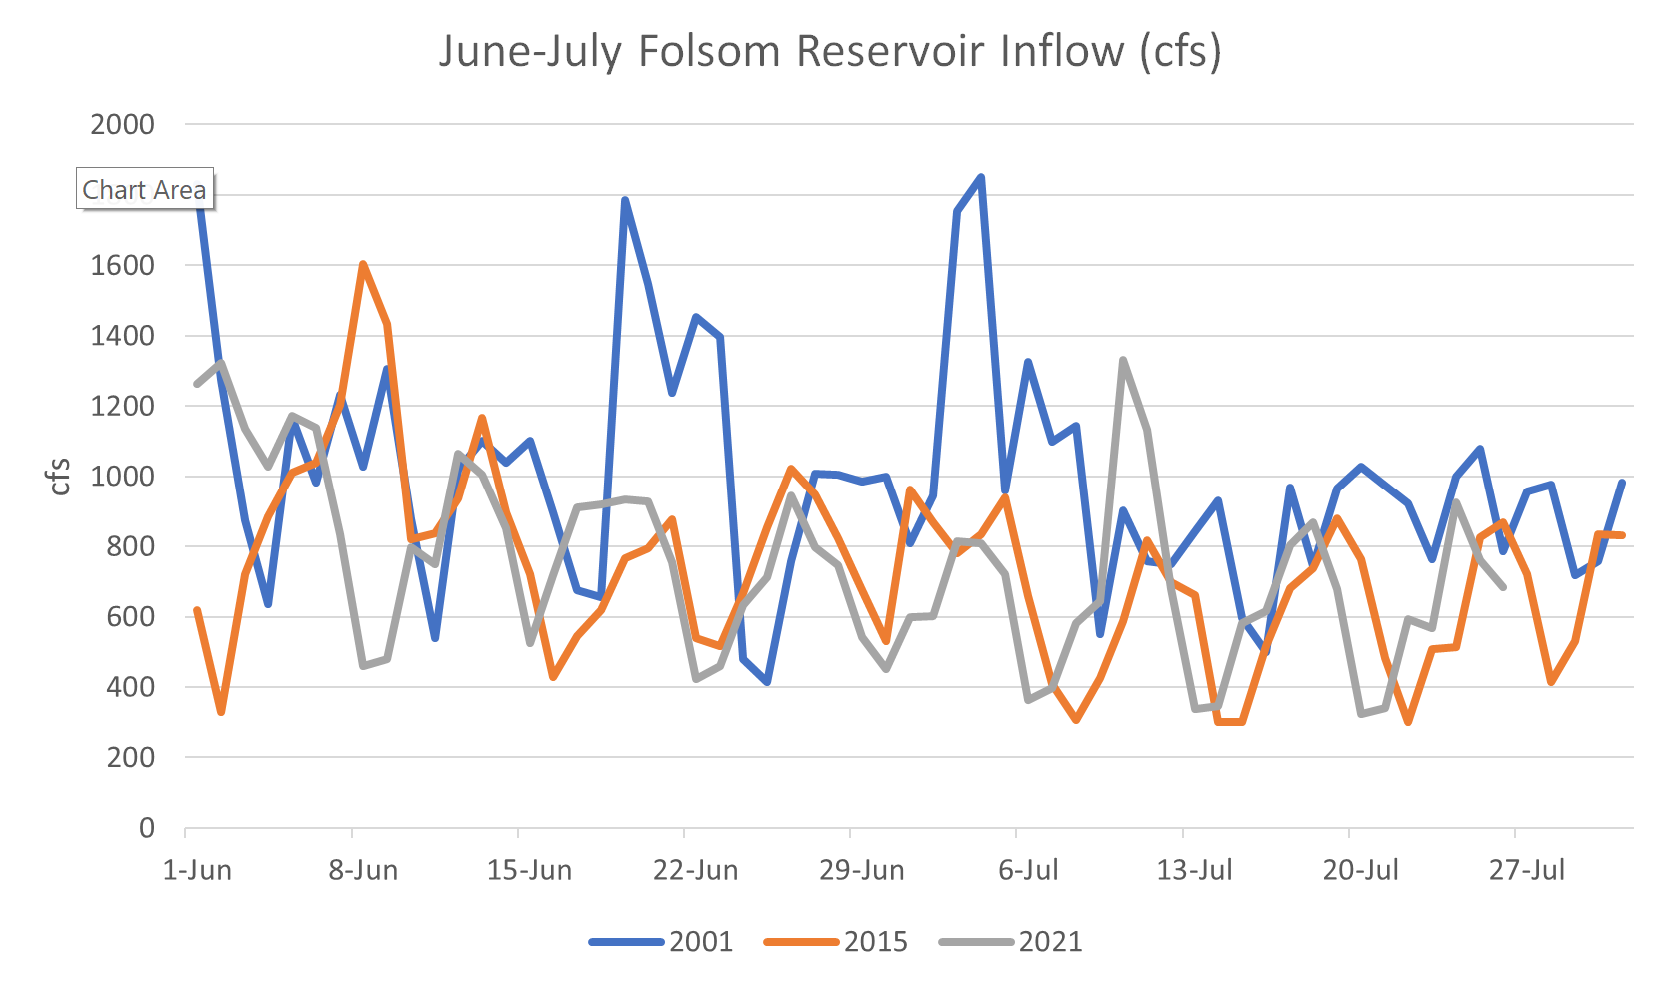
Figure 1. Water releases from Keswick Dam (river mile 300) to the lower Sacramento River near Redding CA, April-August 2014, 2015, and 2021.
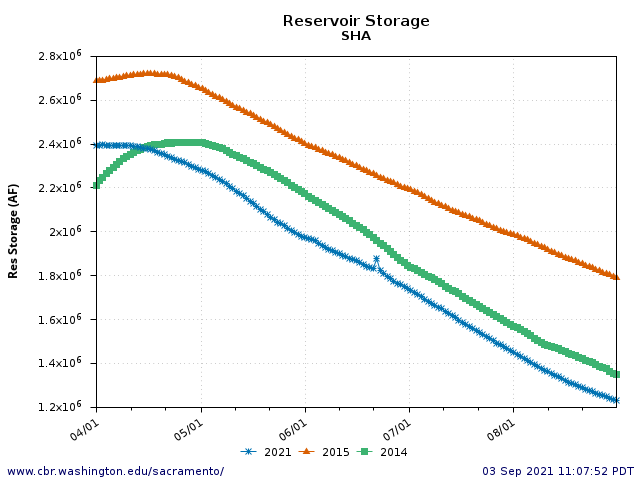
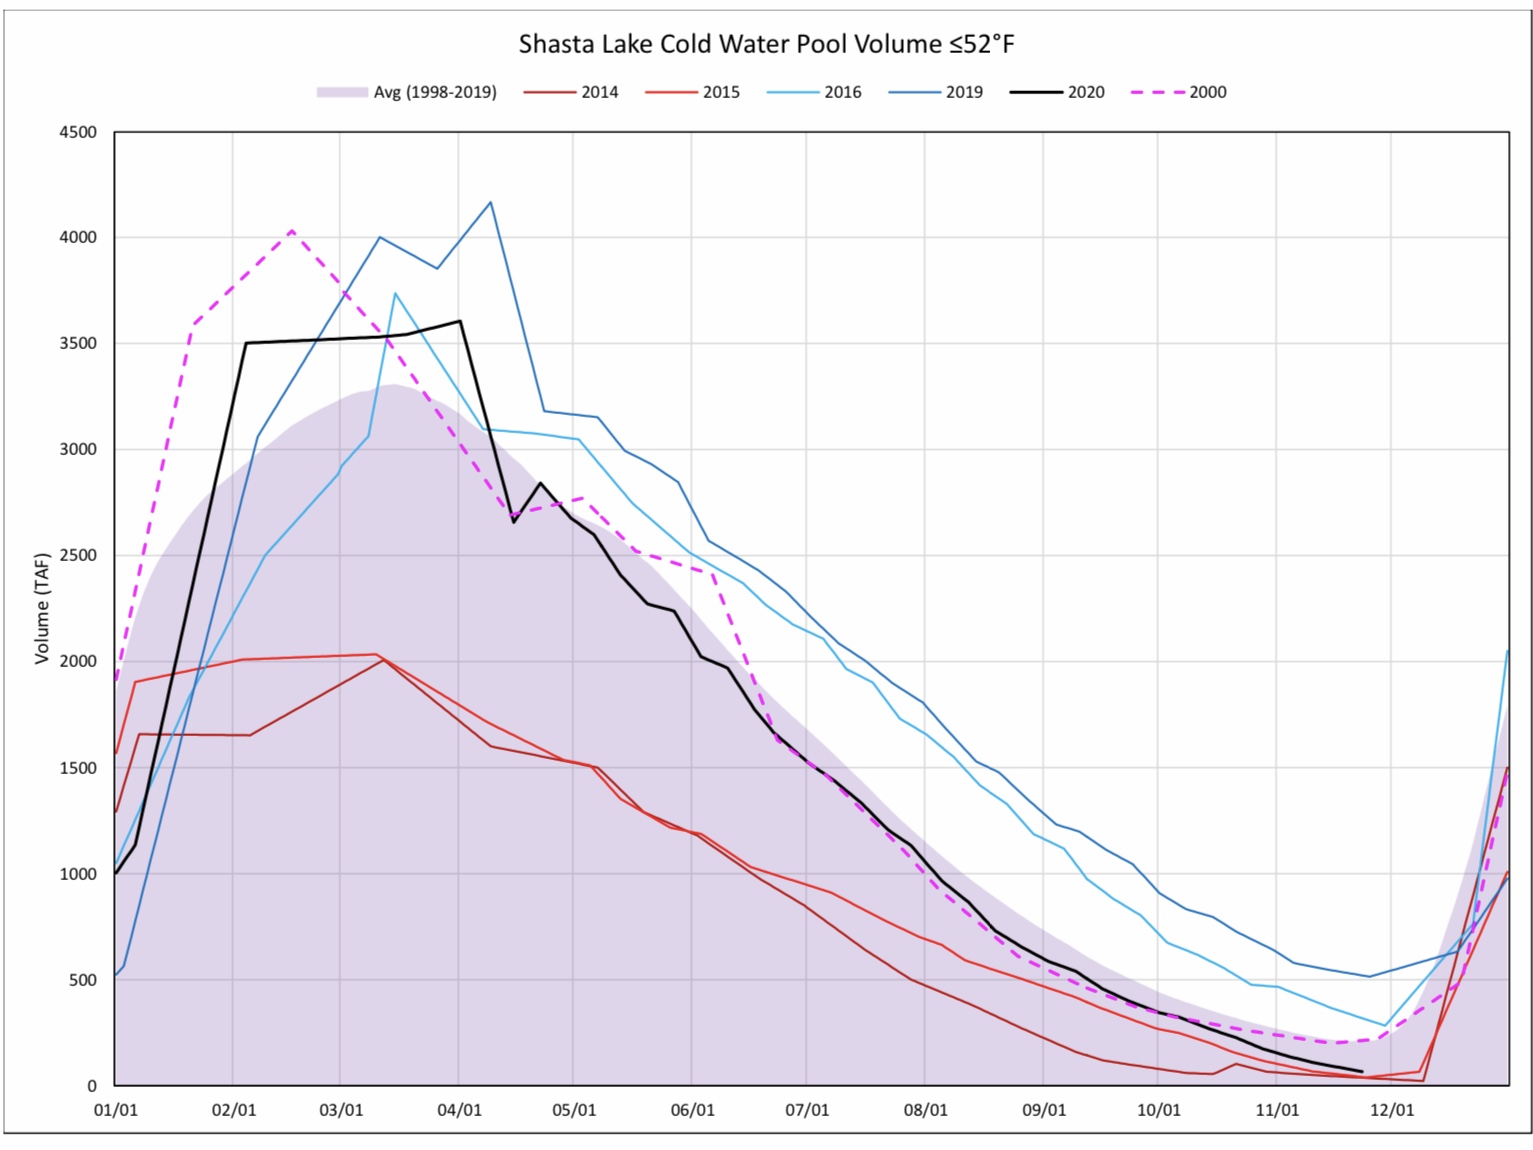
Figure 2. Shasta Reservoir storage (acre-feet) April-August in 2014, 2015, and 2021.
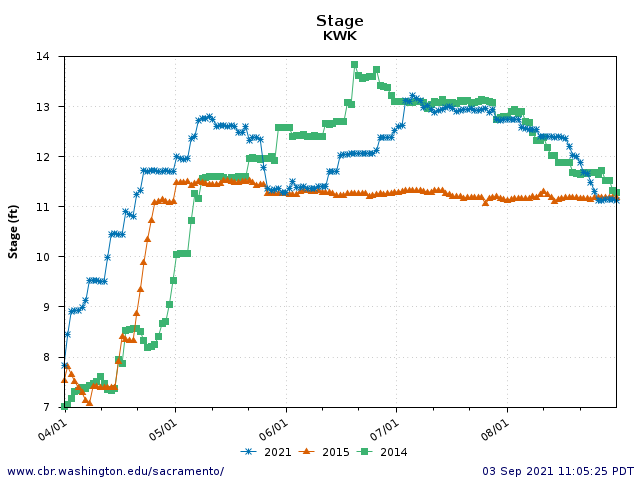
Figure 3. River Stage in Sacramento River below Keswick Dam April-August in 2014, 2015, and 2021.
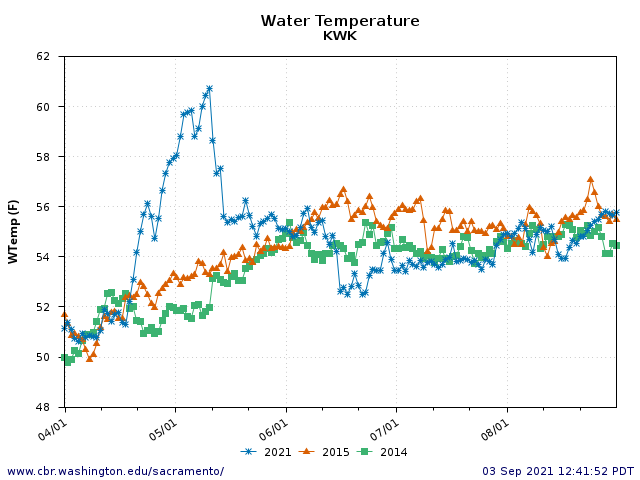
Figure 4. Water temperature in Sacramento River below Keswick Dam April-August 2014, 2015, and 2021.
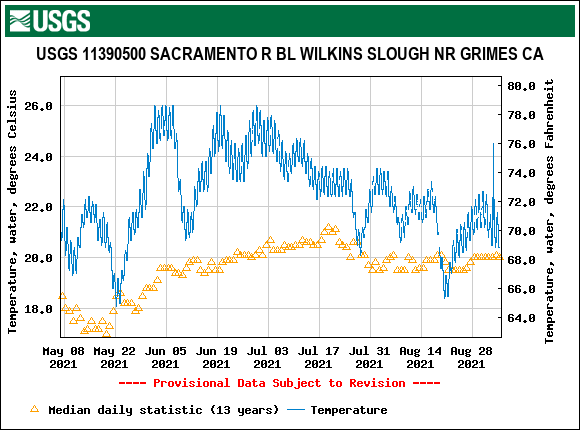
Figure 5. Water temperature in the lower Sacramento River at Wilkins Slough (river mile 120) May-August 2021, along with average for past 13 years. Note that the State’s year-round water quality standard for the lower Sacramento River is for water temperature to remain below 68ºF.