Longfin Smelt February 2018

In April 30, 2017 post on longfin smelt, I wrote that it appeared that longfin were making a comeback after the 2012-2015 drought. In this post I compare the 2017 comeback to those in the two previous wet years, 2006 and 2011.

First: The number of adult longfin smelt collected in the December 2017 trawl survey (Figure 1) was substantially less than the number collected in the December 2011 survey (Figure 2).

Second: The number (density) of larval longfin smelt collected in the late January 2018 larval fish survey (Figure 3) was substantially less than the number collected in the late January 2012 survey (Figure 4).

Third: The 2017 index, though higher than the dry years that immediately preceded 2017 and indicative of some recovery, remained below the recent wet years (06, 11) and continued a long-term trend of progressively lower indices (Figures 5 and 6).

Figure 1. Catch distribution of adult longfin smelt in the December 2017 trawl survey. Source: CDFW survey online report.

Figure 2. Catch distribution of adult longfin smelt in the December 2011 trawl survey. Source: CDFW survey online report.

Figure 3. Catch distribution of larval longfin smelt in the late January 2018 larval fish survey. Source: CDFW survey online report.

Figure 4. Catch distribution of larval longfin smelt in the late January 2012 larval fish survey. Source: CDFW survey online report.

Figure 5. Fall Midwater Trawl Index for Longfin Smelt, 1967-2017. Source: CDFW FMWT Survey.

Figure 6. Longfin Recruits (Fall Midwater Trawl Index) vs Spawners (Index from two years prior) in Log10 scale. Note the progressive decline in recruits in the last three wet years (06, 11, 17). The relationship is very strong and highly statistically significant. Taking into account Delta outflow in winter-spring makes the relationship even stronger. Recruits per spawner are dramatically lower in drier, low-outflow years (red years). Source: http://calsport.org/fisheriesblog/?p=1360 .

Measures to Save the Delta and Delta Smelt

The key to saving the Bay-Delta Estuary and its native fish community is keeping the Low Salinity Zone (LSZ) and its brackish water out of the Delta, especially the south Delta where the federal and state project pumps are located.  The native fish of the estuary, both in the Bay and Delta, depend on potency or productivity of the LSZ.  Much research has shown that low Delta freshwater outflow allows the LSZ to move into the Delta, to the detriment of overall ecological productivity and of the survival and production of native fish (and most pelagic species and their food supply).  Allowing the LSZ to move into the Delta allows the export of the LSZ from the south Delta, to the detriment of native fish and their critical habitats.  Increased salinity also harms agricultural and municipal water supplies.

Keeping the LSZ out of the Delta means keeping salinity (as measured by electrical conductivity or EC) below 500 EC.  The 500 EC level is sometimes called the “salt front” or the upstream head of the LSZ.  Another measure of the LSZ is X2, the heart of the LSZ, approximately 3800 EC.  The State Board has defined the Emmaton gage on the Sacramento River channel and Jersey Point gage on the San Joaquin River channel as the western edge of the Delta in terms of Delta agriculture and set wet year standards of a maximum 500 EC for the spring to fall irrigation season.  These standards have kept the LSZ out of the Delta in summer of wet years to the benefit of Delta agriculture and native fishes (and non-native striped bass).  However, the standard is also needed in the non-irrigation season when high Delta exports often occur.

Suggested measures to save the Delta:

  1. Do not allow south Delta exports to exceed a minimum (often prescribed as 1500 cfs) when Jersey Point and Emmaton gages exceed 500 EC.
  2. Place barriers on False River and Dutch Slough channels when their gages may exceed 500 EC.
  3. Open the Delta Cross Channel (DCC) to maintain a balanced EC at the Jersey Point and Emmaton gages and ensure positive outflow from the Delta at Jersey Point (often referred to as a positive QWEST). Closure of the DCC when EC rises at Jersey Point is detrimental to the LSZ when south Delta exports exceed 1500 cfs.
  4. Restrict Old and Middle River (OMR) negative flows to protect salmon and smelt from export facilities when these fish are in the interior Delta under freshwater conditions per biological opinions.
  5. Install or construct a permanent Head of Old River Barrier to keep San Joaquin salmon out of the south Delta in winter-spring under all export conditions.
  6. Increase San Joaquin River flows in the February-June time period.
  7. Keep Delta outflow at 8000-10,000 cfs in the fall after wet years to keep salt out of the Delta.

Example:  Water Year 2018

This new water year with its record November (wet) and December (dry) is a good example of what is wrong with the Delta.  Despite high reservoir levels for the beginning of a new water year1, Delta outflow was allowed to fall to 5000-7000 cfs in late November (Figure 1) as Delta exports literally sucked the freshwater bubble out of the Delta.  Exports averagedover 10,000 cfs from mid-November to mid–December, a time of year when there are no Delta controls.  The LSZ encroached at Emmaton (Figure 2), Blind Point (Figure 3), False River (Figure 4) on the west side of the Delta, Dutch Slough (Figure 5), and even showed up at the Rock Slough intake of the Contra Costa Water District in the south Delta (Figure 6).  See Figure 7 for the gage locations.

In conclusion, maintaining the 10,000 cfs Delta outflow necessary to keep the salt out of the Delta this past fall would have cost approximately 250,000 acre-ft of water from either the 18,000,000 acre-ft in storage or 1,500,000 acre-ft of Delta exports.  Doing so would have gone a long way toward protecting the past year’s production of winter-run smolts and pre-spawn Delta smelt that were both concentrated in the Delta.

Figure 1. Daily average Delta outflow for 11/7/17 to 1/4/18. Note each box-cell in chart represents approximately 7000 acre-ft of water. Maintaining a target 10,000 cfs to keep salt out of the Delta would have required an additional approximately 250,000 acre-ft of storage releases or export reduction.

Figure 2. The LSZ has encroached into the Sacramento River channel of the western Delta increasingly this water year. The limit should be 500 EC.

Figure 3. The LSZ has encroached into the San Joaquin River channel of the western Delta increasingly this water year. The limit should be 500 EC.

Figure 4. The LSZ has encroached into the central Delta via the False River channel from the western Delta increasingly this water year. The limit should be 500 EC.

Figure 5. The LSZ has encroached into the central and south Delta via the Dutch Slough channel of the western Delta increasingly this water year. The limit should be 500 EC.

Figure 6. The LSZ has encroached into the central and south Delta as seen at the Rock Slough gage of the south Delta increasingly this water year. The limit should be 500 EC.

Figure 7. Location of gages in above figures.

  1. As of December 1, Sacramento watershed reservoirs were 109% of average, and San Joaquin reservoirs were 150% of average.

Delta Smelt: End of 2017

In a recent post, I summarized the population dynamics of Delta smelt using the Summer Townet Index and Fall Midwater Trawl index relationships.  Since then, the California Department of Fish and Wildlife updated the Fall Midwater Trawl Index for 2017.  In turn, I update the relationships in Figures 1 and 2 below.  As I predicted in another post last fall, there was no uptick in the 2017 index, despite it being a wet year.  News articles on the subject suggest “no easy answers.”  To me it is obvious that the water project managers went out of their way to short smelt in 2017.  The prognosis for Delta smelt remains grim.

Figure 1. Log vs Log plot of fall FMWT Index of Delta smelt as related to the prior summer STN Index of abundance for that year. Blue years are wet water years (Oct-Sept). Green years are normal water years. Red years are dry and critical water years. Year types are as determined by the California Department of Water Resources for the Sacramento River runoff to the Bay-Delta Estuary (http://cdec.water.ca.gov/cgi-progs/iodir/WSIHIST).

Figure 2. Log vs Log plot of fall FMWT Index of Delta smelt (recruits) vs previous fall index (spawners). Blue years are wet water years. Green years are normal water years. Red years are dry and critical water years. Year types are as determined by the California Department of Water Resources for the Sacramento River runoff to the Bay-Delta Estuary (http://cdec.water.ca.gov/cgi-progs/iodir/WSIHIST).


WaterFix USFWS Biological Opinion Conclusions on Delta Smelt

The US Fish and Wildlife Service’s biological opinion (USFWS BO) on the proposed “California WaterFix” (Delta Twin-Tunnels Project or CWF) concludes that the CWF will not jeopardize protected Delta smelt in the Bay-Delta.  In this post, I address the conclusions in the USFWS BO on the potential effects of WaterFix on Delta smelt.  This is another post in a series of posts on the WaterFix.

BO conclusion, p. 252.

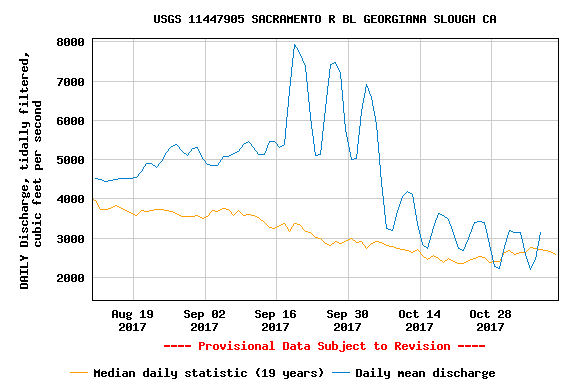
Comment: The north Delta diversions (NDD) will increase tidal flows and upstream reverse flows below the NDD intakes. Adult smelt will migrate further upstream on their spawning run on average than they can under existing conditions. Thus, their likelihood of spawning nearer the NDD is greater. There would be more smelt spawners diverted from the Cache Slough area to the Sacramento River upstream of Cache Slough. The only impediment to such upstream movement and to spawning upstream of the project area would be loss to impingement or predation at the NDD diversion intakes. These effects would be significant risks to the population.

BO conclusion, p. 258.

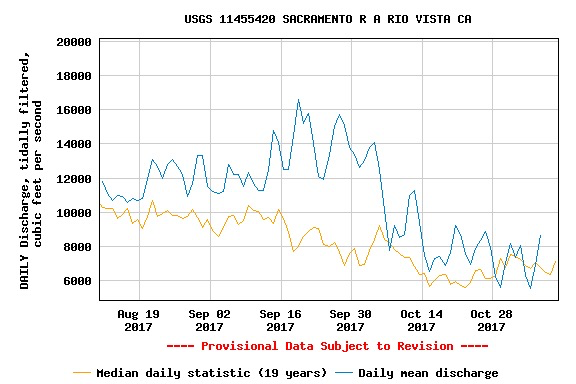
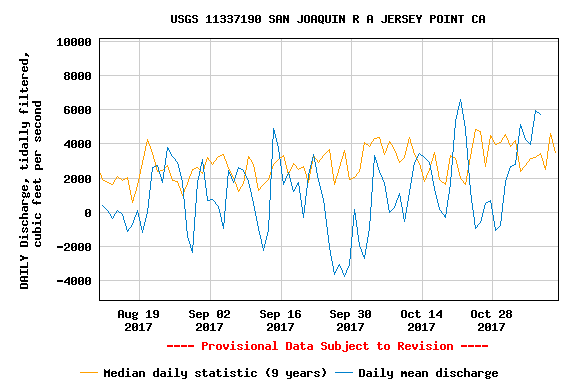
Comment: These analyses did not take into account reduced freshwater inflow into the interior, central, western, and south Delta because of the diversions at the NDD intakes. South Delta exports would remain similar to existing constrained spring exports (~6,000 cfs) and high summer exports (no NDD exports). With less inflow to the lower Delta, the Low Salinity Zone in the lower Sacramento and San Joaquin channels would be expected to be further upstream, and entrainment potential from False River and lower Old River would be greater. Delta outflows would be lower, especially in drier years. Specified summer operations focused on south Delta exports would continue existing high summer risk to smelt and their habitat, especially if more spawning occurs in the lower San Joaquin River channel. Lower freshwater inflow will lead to higher salinities and warmer spring-summer Delta conditions, to the detriment of Delta smelt. Existing high summer impacts to Delta smelt would increase because of the more-upstream springtime distribution of smelt.

BO conclusion, p. 262.

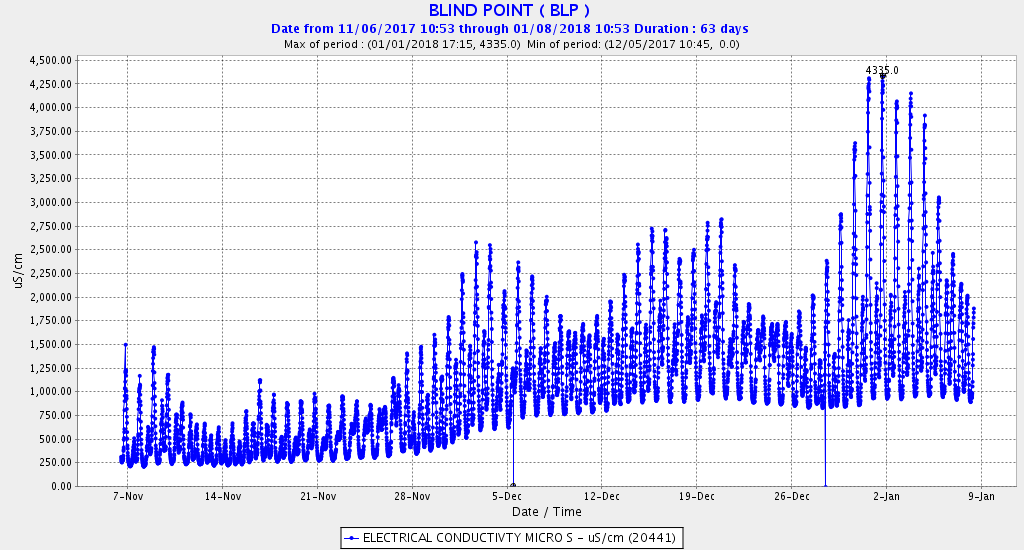
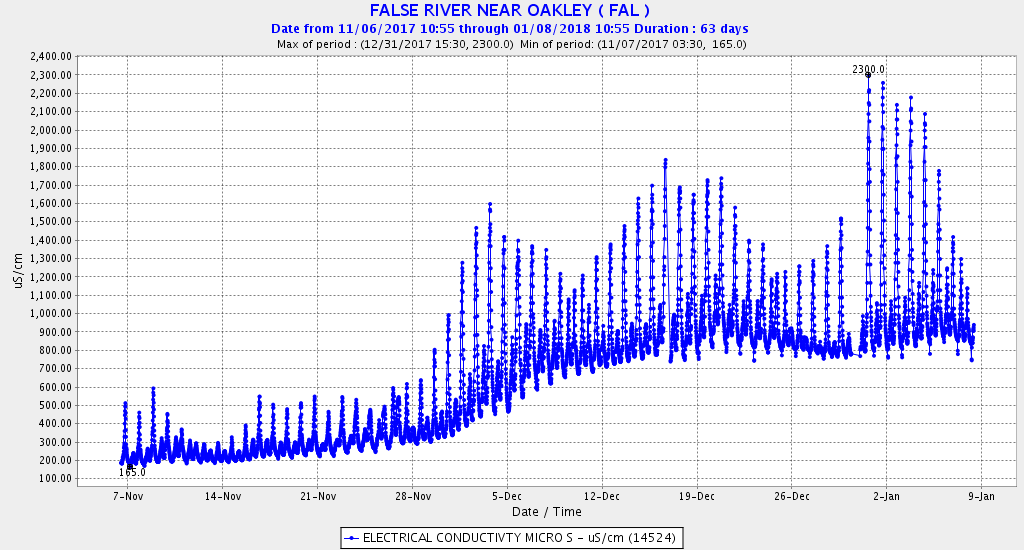
Comment: The removal of a significant portion of freshwater inflow at the proposed NDD will not improve “transport flow function”. OMR effects will intensify with the LSZ further upstream in the lower San Joaquin River channel. The amount of smelt pulled through Three-Mile Slough and the amount transported tidally in the lower San Joaquin River from Antioch to Jersey Point via False River will increase. If OMR will not change in April-May, the primary smelt larval period, then larval impacts will be much worse without the fresh water diverted at the NDD.

BO conclusion, p. 262.

Comment: The 25oC restriction will come much earlier in spring without the freshwater inflow that is removed at the NDD. The change in LSZ position (more upstream) and water temperature (higher) will be generally detrimental to Delta smelt survival.

BO conclusion, p. 263.

Comment: Based on such past commitments and the performance of Reclamation and DWR, this one must also be taken with a grain of salt.” Without a clear understanding of factors affecting Delta smelt, as exemplified in this assessment, it is unlikely that the USFWS could protect Delta smelt under WaterFix operations.

BO conclusion, p. 272.

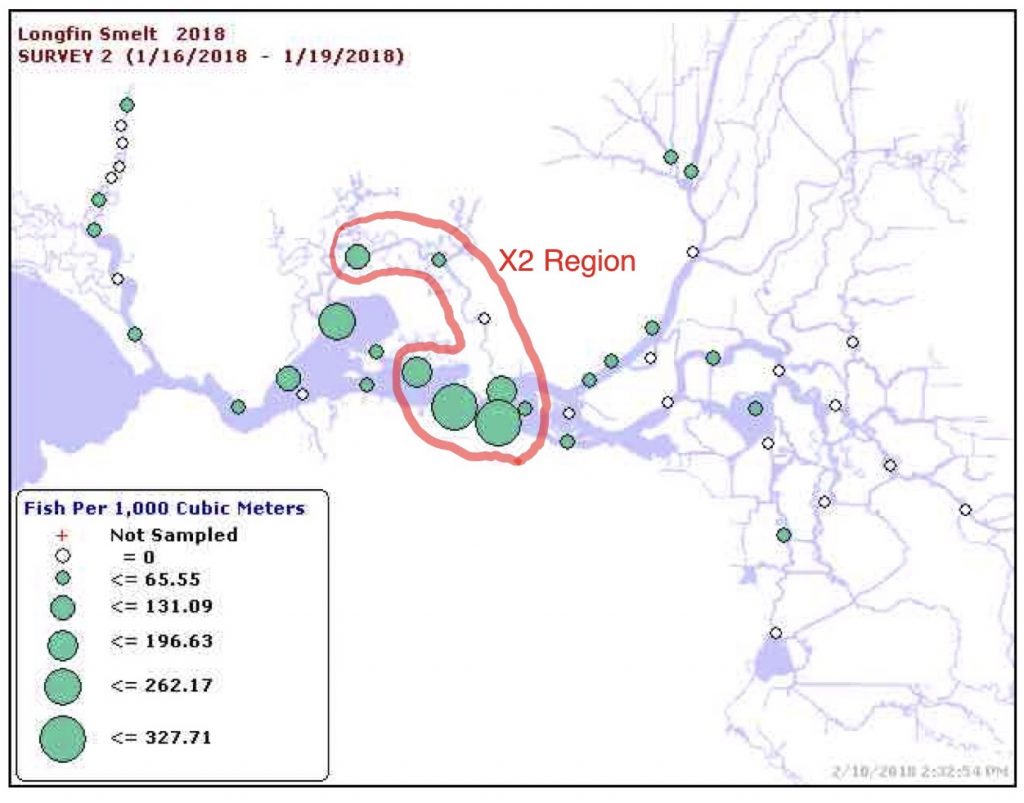
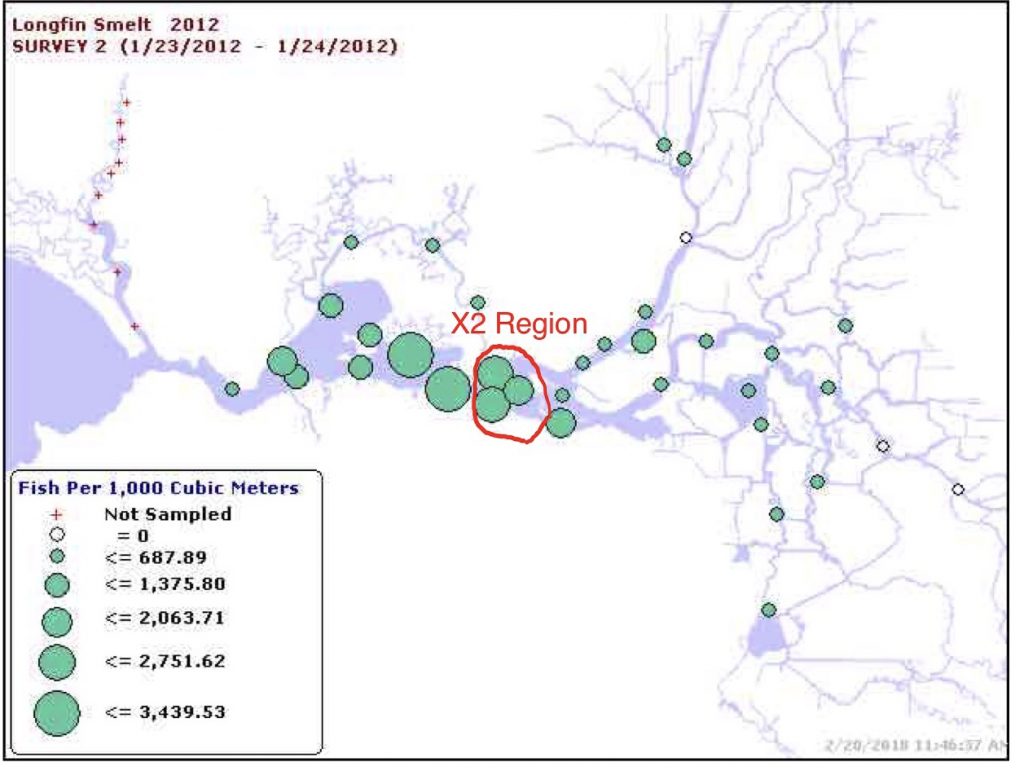
Comment: Water Year 2017 was the second year since the 2008 BO RPA on Fall Wet Year X2 came into play. In 2011, its application appeared to have positive effects.1 Yet in September 2017, the USFWS approved the provision’s removal. How are we to believe the commitment to employ the RPA in the future?

BO conclusion, p. 274.

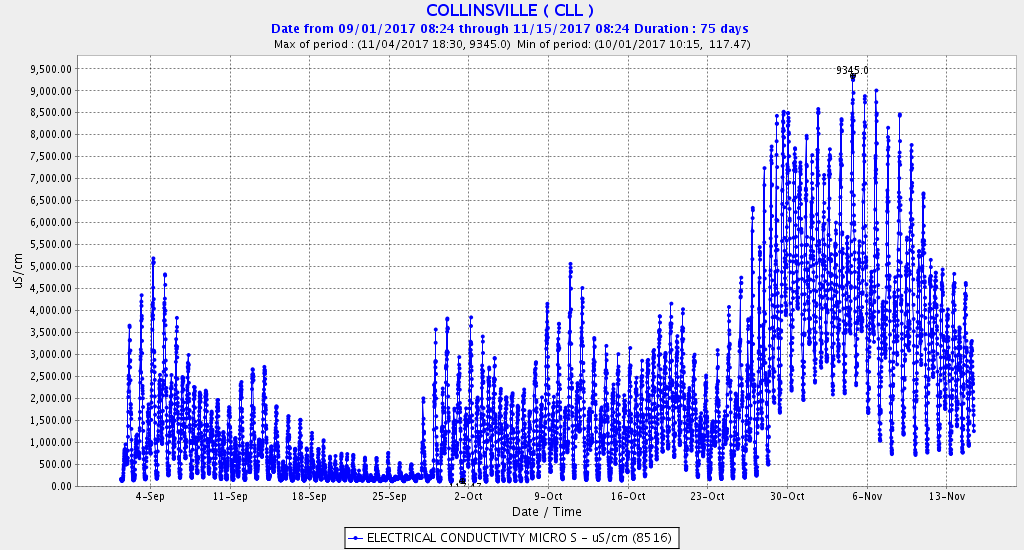
Comment: The reduction of freshwater inflow to the Delta below the NDD will move the low salinity zone (LSZ) upstream and contract its size (volume and surface area). This will have serious adverse effects on smelt and their critical habitat.

BO conclusion, p. 274.

Comment: Reduction of freshwater inflow into the Delta can increase Delta water temperatures several degrees, to the detriment of smelt survival. Not only are water temperatures increased by lower net flows, but the LSZ is warmer when it is located further upstream from the Bay and its cooler air temperatures.

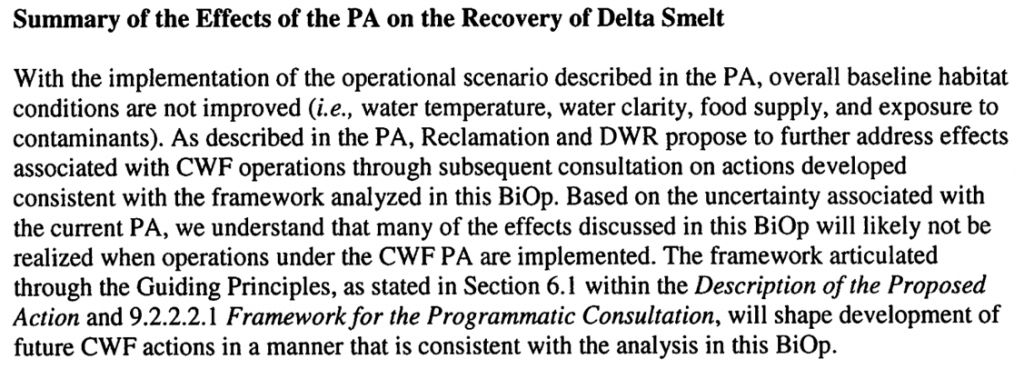
BO conclusion, p. 298.

Comment: Recognizing the uncertainty is no excuse for approving the proposed action (PA). There are no guarantees that predicted effects “will likely not be realized” or that future actions will protect smelt. It is more likely that recovery of Delta smelt will be further from reality with WaterFix.

More on Fall X2 Adaptive Management

In an October 11 post, I discussed the state of California’s decision to maintain fall Delta outflow to the Bay (Fall X2). The 2008 Delta Smelt Biological Opinion (BO) requires that the State Water Project and the Central Valley Project keep the low salinity zone (X2) at km 74, near Chipps Island, in the fall of wet years. In early October, 2017, Reclamation and DWR requested that the fisheries agencies waive this wet year requirement to allow greater south Delta exports. The US Fish and Wildlife Service approved. But several days later, the California Department of Fish and Wildlife found that the action did not comply with the California Endangered Species Act, and the California Department of Water Resources reduced its south Delta exports to maintain Fall X2 compliance.1

To help the state maintain compliance, Reclamation began weekday closings of the Delta Cross Channel (DCC) (Figure 1), opening the DCC only on weekends to facilitate boat travel (Figure 2). Closure of the DCC forces more of the Sacramento River flow down the north Delta channel (Figures 3 and 4) repelling salt intrusion in eastern Suisun Bay near Collinsville (km 81) (Figure 5). The closure occurred 10 to 12 weeks earlier than normal (usually December 15), a highly unusual and provocative manipulation of Delta hydrodynamics. Its continued application after November 1 changes the hydrodynamic effects. Now that the Fall X2 requirement has expired, Delta outflow is lower and exports are higher. Under these conditions, DCC closure contributes to greater salinity intrusion into the central Delta via the lower San Joaquin channel and False River, moving Low Salinity Zone and Delta smelt back toward the central Delta.

DCC closure also helps more Mokelumne River adult salmon better hone in on their home river by keeping Mokelumne water out of the Sacramento channel near and below the DCC.2 However, Sacramento River salmon that enter the Mokelumne forks when the DCC is open on weekends would be blocked and delayed when the DCC is closed during the week. Closing the DCC also reduces San Joaquin channel net freshwater flows (Figure 6), which may hinder migrations of Sacramento, Mokelumne, and San Joaquin river adult salmon migrating up the San Joaquin channel of the Delta.

A likely upside of this unusual manipulation of cross-Delta freshwater flow is that it serves to keep the Sacramento River channel of the Delta fresher, which is part of the intent of the Fall X2 requirement. This action has minimal cost to reservoir storage and Delta exports, and it reduces straying of returning Mokelumne River hatchery salmon. On the downside, these DCC operations disrupt Delta hydrodynamics and water quality, move the Low Salinity Zone into the central Delta threatening Delta smelt survival, and interrupt salmon migrations in the Sacramento and San Joaquin rivers. It is likely that the Delta’s adaptive managers neither monitored nor assessed these potential downside ramifications.

Figure 1. Location of Delta Cross Channel in north Delta. (Base map from CDEC)

Figure 2. Reclamation began weekday closure of the Delta Cross Channel in mid-September (flow values are 0 on seven day intervals).

Figure 3. Weekday closure of the Delta Cross Channel in mid-September increased net flow downstream of the DCC in the Sacramento River channel below Georgina Slough.

Figure 4. Weekday closure of the Delta Cross Channel in mid-September increased net flow downstream of the DCC in the Sacramento River channel at Rio Vista.

Figure 5. Weekly closures of the Delta Cross Channel helped to maintain Fall X2 below Collinsville (km 81) through October in 2017.

Figure 6. Sporadic closure of the Delta Cross Channel reduces net freshwater flow in the lower San Joaquin channel in the central and western Delta.