Questions for Bay-Delta Science

The Interagency Ecological Program (IEP) for the Bay-Delta is about to hold its annual workshop on their science program and their plans for 20161.  Science is based on hypotheses and hypothesis testing – or in other words, addressing questions.  Here are some questions that would be appropriate for the Bay-Delta Science team to address, if it is not already addressing them:

  1. Montezuma Slough is the critical waterway connecting Suisun Marsh with Suisun Bay. It begins near the confluence of the Delta outlets of the Sacramento River and San Joaquin River near Collinsville.  It ends at its outlet in west Suisun Bay near the Mothball Fleet.  It is about 16 miles long, with strong tidal flows and salinity gradients.  The salinity control structure (gates) installed in 1988 at the upper end opens on an ebb tide to let freshwater from the Sacramento River downstream into the Slough and Suisun Marsh, and closes on the flood tide to keep saltier water from entering at the bottom to replace the fresher water.  The Slough has always been an important nursery for Bay-Delta fish including longfin and Delta smelt, as well as striped bass.  In wet years it is fresh much of the year, while in drier years it is brackish.  Questions:  How has the Slough’s role changed as a nursery area, especially in spring and summer, with changes in the Bay-Delta water quality standards after 1994, with operation off the Salinity Control Structure, with implementation of biological opinions in 2008-09, and with changes related to the Temporary Urgency Change Petitions during the 2012-2015 drought?  Have changes in and to the Slough contributed to the possible extinction of the smelts and reductions in estuary productivity?
  2. Cache Slough is a backwater tributary of the lower Sacramento River channel in the northern Delta. It is the outlet of the Yolo Bypass and the outlet entrance of the Deep Water Ship Channel and Port of Sacramento. It changed permanently with the breaching of adjacent Liberty Island in the late 90’s.  In the past, it received freshwater inflow from the Port, but the Ship Channel gates were closed permanently several decades ago.  The North Bay Aqueduct diverts freshwater from the west end of the slough complex.  The Cache Slough Complex plays an important role in the north Delta ecosystem with its freshwater inputs, shallow water habitats, and large tidal exchange.  In wet years, it receives large flood flows of the Yolo Bypass of the Sacramento River.  It is an important spawning and nursery area of both smelts and splittail, and is an important nursery of salmon in winter-spring of both dry and wet years.  Many very deep holes in the complex are known habitat areas of adult and juvenile sturgeon.  The deep water of the Ship Channel appears to support a significant portion of the Delta smelt population.  The Complex has more productivity and food than the adjacent Sacramento River channel.  The Complex is thought to contribute significant nutrients and organic carbon sources to the northern Delta.  Questions:  Are plankton blooms in the Complex a function of shallow tidewaters with long residence times or high nutrients or both?  Has the role and ecology of the Complex changed over the past several decades with changes in Liberty Island, operation of the Yolo Bypass, operation of the North Bay Aqueduct and Ship Channel, and changes to Delta standards (including recent TUCP’s)?  Would proposed drought year barriers on Miners and Steamboat sloughs cause additional changes to lower Cache Slough?  Would added streamflow through the Bypass and Ship Channel provide benefits to the ecology and fisheries dependent on Cache Slough and the northern Delta?  Would more flow through the Bypass improve habitat and habitat use by young salmon moving upstream from the lower Sacramento River channel?  Is there more smelt spawning in the Complex in drought years because of salt intrusion into western Delta?  Can the isolated population element of Delta Smelt in the Complex survive the warm summer conditions?  Would the Complex benefit from more tidal marsh and supratidal floodplain?  Does the Complex benefit from nutrient inputs of local and regional treatment plants and agricultural drainage?  Do water supply diversions by agriculture and the North Bay Aqueduct affect habitat benefits to the Complex and the Delta?
  3. The Delta Cross Channel (DCC) that connects the lower Sacramento River channel in the north Delta with the San Joaquin River channel in the central Delta via the forks of the Mokelumne River can be opened or closed to control the amount of Sacramento channel water that reaches the central and south Delta. Closing the DCC forces more water and juvenile salmon down Georgiana Slough.  Questions:  Would opening the DCC in spring benefit smelt and salmon?  In particular, would salmon outmigrating from the San Joaquin River benefit?  Would Sacramento salmon that pass into central Delta via Georgiana Slough benefit from open DCC?
  4. The Head of Old River Barrier (HORB) reduces the flow of the San Joaquin River into the head of Old River near Stockton. HORB keeps most juvenile salmon that are moving down the San Joaquin channel out of Old River water that is drawn to South Delta export pumps.  However, while HORB keeps San Joaquin salmon moving toward the central Delta, the reduction of San Joaquin flow into the head or Old River increases flow toward the pumps from the central Delta (increasing negative OMR flows up to 1000 cfs).  Questions:  Would HORB function improve with installation of False River Barrier and opening of the DCC?  How would the tradeoff in export potential balance with benefits to San Joaquin salmon?
  5. The False River Barrier blocks tidal flows from the lower San Joaquin River channel at Jersey Point into Franks Tract in the Central Delta. This reduces flow of brackish water and nursery habitat of smelt into the central and south Delta in dry years.  Questions:  Would placement of the False River Barrier in spring of wet years provide benefits to smelt and Delta habitats of smelt and reduce entrainment of smelt into the south Delta?
  6. Summer Delta Outflow and Exports are unrestricted except for salinity standards based on agricultural use. Summer exports from South Delta are generally maximized unless they are restricted by high salinities in drought years (low reservoir releases during droughts).  Questions:  Would higher summer outflows that keep the LSZ west of the Delta during periods of high export protect smelt and LSZ habitat?  Should summer salinity standards be changed to protect LSZ from moving east into the central Delta?  Would higher Delta outflow in summer be beneficial to Bay nursery of many estuary and marine fish including herring and anchovy?  Would higher summer outflow improve productivity of the LSZ?
  7. Conditions for salmon rearing in the Delta during the Winter can likely be improved. Nearly all the salmon runs in the Central Valley spend part of their first year rearing in the Delta in the winter and migrating through the Delta to the Bay and ocean.  Winter Run and Late Fall Run hatchery and wild smolts come through in December-January with the first flow pulses from the upper Sacramento River.  Spring and Fall Run fry, parr, and smolts come through from January to March or even into April.  The fry and parr depend on the Delta and upper Bay, rearing there during the winter before smolting.  Questions: How can migration period flows be optimized to improve survival?  Can optimal rearing habitats be identified and improved?  How can Delta inflows from the San Joaquin River be improved during winter to enhance San Joaquin salmon survival?
  8. Delta Water quality standards are monthly, biweekly, or weekly. Questions:  What are the upsides and downsides of moving to more frequent real-time management of Delta water quality standards, as well as management of fish and fish habitat?  Have existing requirements to change operations “when fish are present” been effective?  What are the ecosystem effects of shortening the time-step for management decisions and relying on short term response for changes in operations?  What structural measures would allow managing agencies to better maintain their independence from conflicting pressures? 
  9. Smelt growth and survival could be enhanced by improving pelagic habitats within and downstream of spawning areas. Water temperature, turbidity, and zooplankton production/biomass/concentrations are key factors in growth and survival.  Question: Can Bay-Delta habitats be managed on a real-time basis to optimize smelt growth and survival?
  10. Green and White Sturgeon spawning as well as egg, larvae, and juvenile survival are dependent on flows and water temperatures in the Sacramento River between Red Bluff and the Delta. Question:  How can the middle reaches of the Sacramento River be better managed to improve sturgeon survival?
  11. Cache Slough/Yolo Bypass salmon and sturgeon adult migrations are attracted by strong tidal exchange, but those attracted may stray into Bypass tributaries (Putah and Cache Creeks) or the Colusa Basin Drain, or become stranded below Fremont Weir at the northern end of the Bypass. Young salmon enter the Bypass during Fremont Weir spills under high river flows.  Questions:  How can migration conditions be enhanced without increased straying and stranding in the Bypass?  How can the Bypass become a beneficial corridor for adult sturgeon and salmonids targeting upper Sacramento River spawning grounds?  How can more flow and young salmon be routed through the Bypass to improve growth and survival of the overall populations?
  12. San Joaquin salmon and steelhead migrations through Delta are disrupted by the nearly total loss of San Joaquin River water to exports in drier years. Questions:  Does placement of the Head of Old River Barrier enhance the signature of the River reaching the Bay?  Would enhanced San Joaquin River flow and reduced exports at key times of the year benefit migrating San Joaquin River salmon and steelhead?
  13. Delta primary and secondary productivity has declined over the past several decades. Questions:  Do exports remove nutrients, planktonic habitat, or adversely disrupt the Low Salinity Zone by entraining pelagic habitat from the west and central Delta via Dutch Slough, Threemile Slough, False River, and the mouth of Old River?  Is the replacement of an entrained LSZ and freshwater pelagic habitat by unproductive, warmer reservoir water detrimental to Delta pelagic habitat productivity?  Has the invasion of rooted and floating aquatic plants reduced pelagic habitat productivity?  Is the invasion of non-native plants related to shorter residence time and continued replacement of entrained pelagic habitat and replacement of reservoir water?  Has the invasion of aquatic plants been aided by reduced phytoplankton productivity and influx of low turbidity reservoir water?
  14. Dutch Slough and other Central Delta habitat restoration projects would expand intertidal and subtidal habitats. Questions: Would such projects expand habitats of non-native fish and aquatic plants? Would the new pelagic habitats be subject to entrainment by south Delta exports?
  15. Survival of salmon and steelhead juveniles in the Delta and lower rivers upstream of the Delta is poor because of degraded habitat, poor flows, poor water quality, and predators. Questions:  Would barging hatchery and wild salmon to the Bay particularly in drier years when flows are low improve survival and minimize straying? Would out-planting wild and hatchery salmon to more optimal Bay-Delta floodplain rearing habitats improve overall production?

The Cause of Probable Extinction of Longfin Smelt in San Francisco Bay-Delta

I left my last post on the longfin smelt decline questioning the possible role of negative changes to the Bay ecosystem in the decline of longfin smelt. Like Delta smelt, the long term decline in longfin is most certainly related to poor outflow and high exports characteristic of dry years. Dry years definitely lead to poor longfin yearly production as can be seen in Figure 1. Years 72, 76-77, 81, 87-92, 94, 03-05, 07-09, and 12-15, all historic dry years, have produced poor longfin indices.

Figure 1. Longfin smelt index from Fall Midwater Trawl Survey 1967-2014. The index in 2015 was a record low 4.

Figure 1. Longfin smelt index from Fall Midwater Trawl Survey 1967-2014. The index in 2015 was a record low 4.

The long term downward trend in wet year production (82 to 86, to 95 to 00, to 06 and 11) is a clear indication that the population is collapsing and moving toward extinction. The record low numbers in drought years 07, 14, and 15 are a further indication of a population collapse.

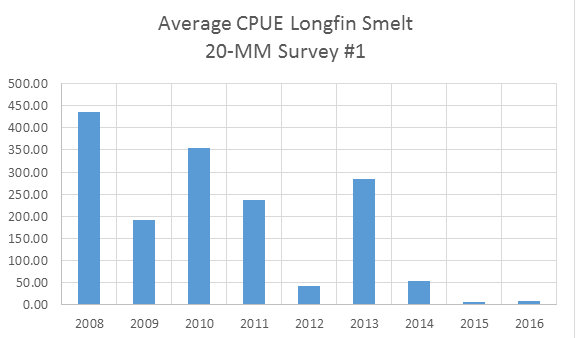
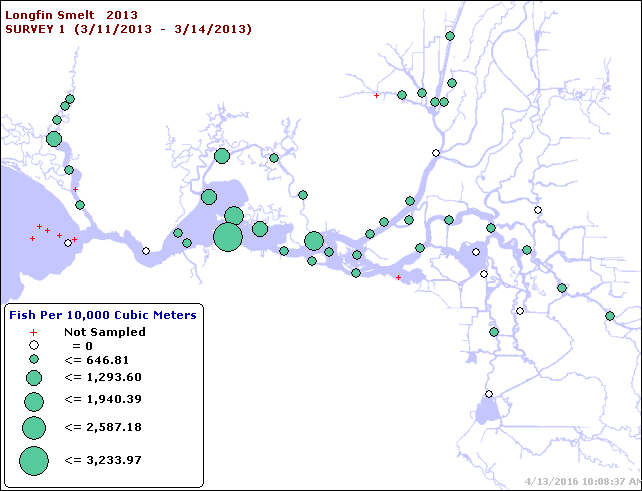
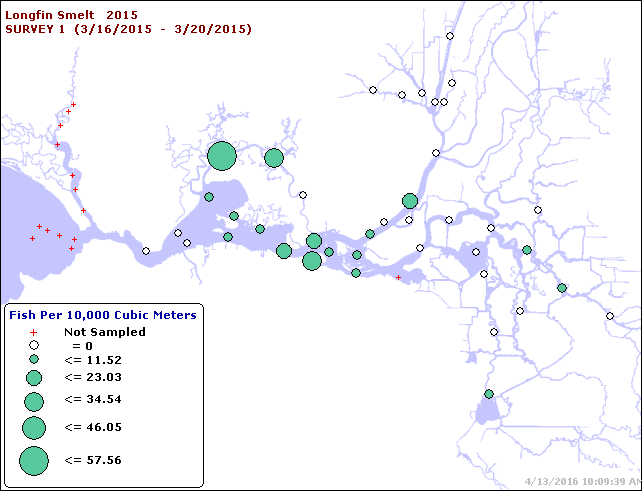
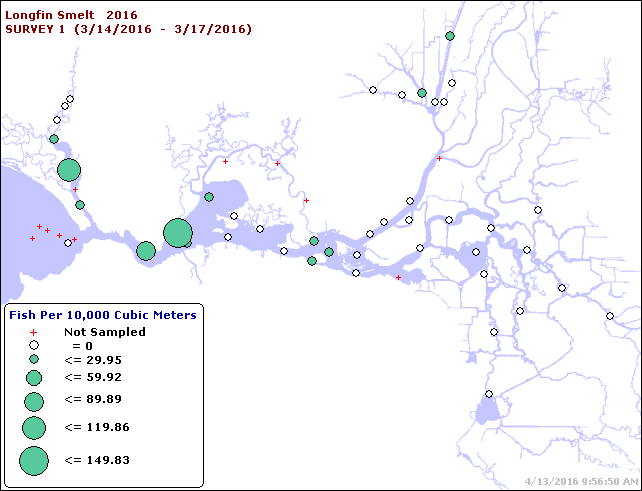
But the most ominous sign of possible extinction is in the first indication of reproduction failure after the record low fall indices in 2014 and 2015. Figure 2 shows the very low juvenile indices in 2015 and 2016 compared to earlier years. Figure 3 shows the relatively high catches in 2013 that lead to the higher index in 2013. Figures 4 and 5 show the catch distribution in 2015 and 2016, with catches nearly two orders of magnitude below those in 2013.

The likely cause of the poor 2015 and 2016 March indices (Figure 2) is the low numbers of spawners (as indexed from the Fall Midwater Trawl Survey (Figure 1). There were simply too few eggs laid in winters 2015 and 2016, a clear indicator of population collapse. So what is the reason for the very low indices (and low numbers of spawners) in fall 2014 and 2015, compared to 2012 and 2013? All four years were drought years. There are several possible reasons.

First, the numbers of adult longfin along the coast outside the Bay that contribute to the spawning population may have been depleted after years of poor recruitment from the Bay and poor ocean conditions. The very low numbers of Longfin captured in the summer in the Bay trawls support this theory.

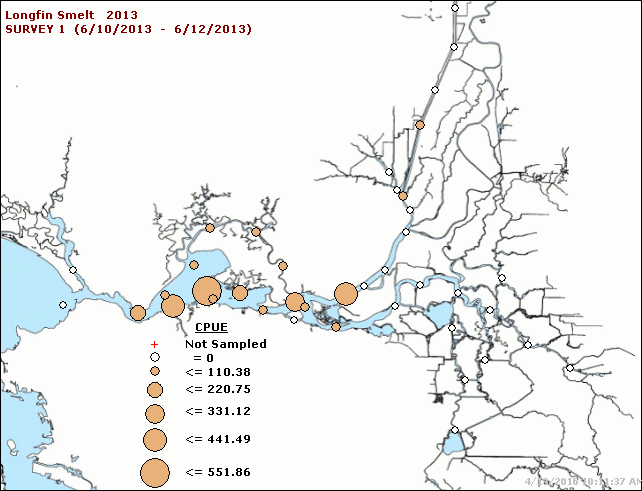
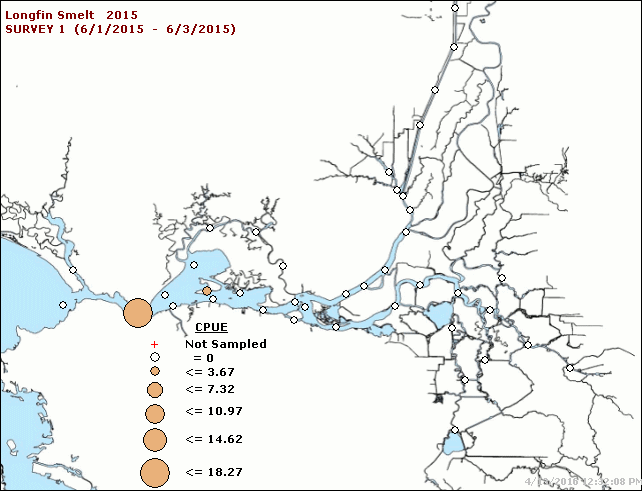
Second, unusually poor survival of young in the eastern parts of the Bay and in the western Delta in spring and summer 2014 and 2015 may have contributed to poor recruitment into the fall-winter spawning population. The poor catch in the Summer Townet Survey in 2014 and 2015 compared to 2013 (Figures 6 and 7) supports this theory. Undoubtedly, the weakening of water quality standards in spring-summer 2014 and 2015, which led to extremely low spring-summer Delta outflows to the Bay and extreme salinity levels and warmer waters in the eastern Bay nursery area of Longfin Smelt, was a substantial cause of this unusually poor survival.

Figure 2. Index of juvenile longfin smelt in first 20-mm Survey in March of years 2008-2016.

Figure 2. Index of juvenile longfin smelt in first 20-mm Survey in March of years 2008-2016.

Figure 3. Catch distribution of longfin smelt in Survey 1 of 2013 20-mm Survey (3/11-3/14).

Figure 3. Catch distribution of longfin smelt in Survey 1 of 2013 20-mm Survey (3/11-3/14).

Figure 4. Catch distribution of longfin smelt in Survey 1 of 2015 20-mm Survey (3/16-3/20).

Figure 4. Catch distribution of longfin smelt in Survey 1 of 2015 20-mm Survey (3/16-3/20).

Figure 5. Catch distribution of longfin smelt in Survey 1 of 2016 20-mm Survey (3/14-3/17).

Figure 5. Catch distribution of longfin smelt in Survey 1 of 2016 20-mm Survey (3/14-3/17).

Figure 6. Catch distribution of longfin smelt in Survey 1 of 2013 Townet Survey (6/10-6/12).

Figure 6. Catch distribution of longfin smelt in Survey 1 of 2013 Townet Survey (6/10-6/12).

Figure 7. Catch distribution of longfin smelt in Survey 1 of 2015 Townet Survey (6/1-6/3).

Figure 7. Catch distribution of longfin smelt in Survey 1 of 2015 Townet Survey (6/1-6/3).

Recommendations for 2016 Delta Smelt Recovery

The Symposium on the possible extinction of smelt held on March 29, 2016 offered no real solutions or solid recommendations for recovery of the two smelt species on the brink of extinction.  My own presentation focused on the cause of the population crash of Delta Smelt, not prescriptions for recovery, which had been a topic of some of my previous posts on smelt in this blog.  The panel discussion at the end of the day of presentations brought out mostly old ideas and restoration strategies that have been unsuccessful over the past 40 years. There was little hope and a lot of pessimism from the panel.  Some panelists recalled that estuary flows and exports are likely important factors, but also lamented that these are hard to change.  Specific panelists held out hope that restoring wetlands and marshes, increasing aquatic food abundance, and reducing toxins might bring the smelt back under present water management.  With that background, I thought I should add my own suggestions for how to proceed during the year that may be our last opportunity to help smelt (Figure 1).
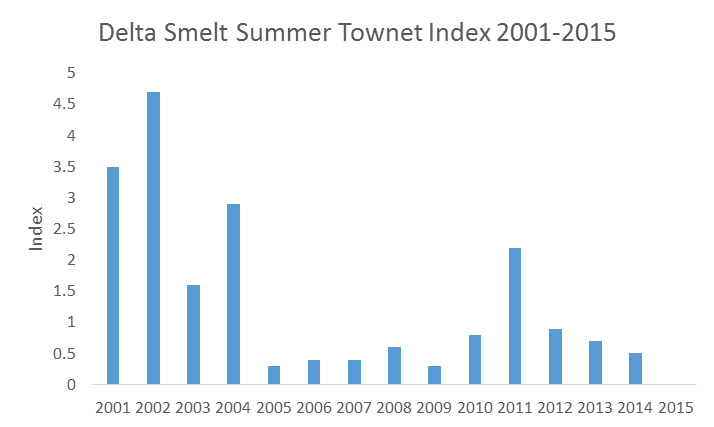
Figure 1. Summer Townet Survey indices 2002-2015. (2015 was zero.)

Figure 1. Summer Townet Survey indices 2002-2015. (2015 was zero.)

This year is a wetter year, not unlike the recovery year 2010 (Figure 1).  So if there is the same level of protection as in 2010, smelt might show signs of recovery with a positive response to good conditions.  However, if they do not respond favorably, it would suggest that Delta smelt need more drastic actions to prevent extinction. Below I describe the basic protections provided in 2010, recommend added actions, suggest several still more drastic prescriptions, and recall planned long-term actions that need to get moving.
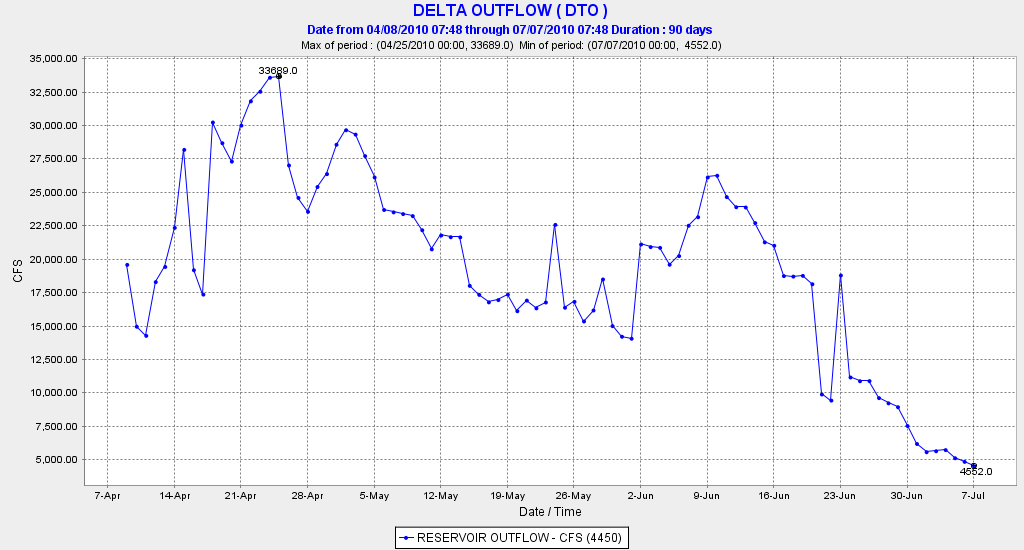
Figure 2. Daily average Delta outflow spring 2010. Source: CDEC.

Figure 2. Daily average Delta outflow spring 2010. Source: CDEC.

Prescription 1 – Limit Spring Exports as in 2010

Year 2010 had relatively good spring Delta outflows (Figure 2).  So far, April, 2016 has also started modestly not unlike 2010, with Delta outflows between 20,000 and 40,000 cfs..  Unless there is more rain, we can expect a sharp drop in outflow later in April this year as reservoir flood control releases cease.  This would create flow conditions similar to those of 2010.   Given the likely releases from storage combined with declining runoff,  it would be reasonable to consider the actions prescribed in 2010 to protect smelt as a place to start this year: limit exports to about 1500 cfs.  There will be strong pressure soon to increase exports to the maximum allowed under the biological opinions (5000-6000 cfs) unless the US Fish and Wildlife Service accepts the recommendation of the Smelt Working Group and limits exports. The Service limited exports in 2010.  It has also largely done so in March and early April, 2016, to protect larval Delta Smelt that were observed in surveys in the lower San Joaquin River.  A low level of export of 1500 cfs and -1800 cfs OMR would be consistent with actions in April in 2010  (Table 1).  A low level of export may also be prescribed by NMFS to protect salmon and steelhead in April and May.

A continued low export prescription of a 2500 cfs limit through May 2010 was likely protective until such time as young smelt were able to transport downstream from Delta spawning grounds to the low salinity zone rearing area located in Suisun Bay under the 15,000-20,000 Delta outflows.  Figure 3 shows the continued presence of Delta smelt in the Delta during May 2010.

By June many smelt had reached the eastern Bay out of the influence of the export pumps (Figures 4 and 5).  Exports of 6300 cfs and -5000 OMR1 allowed under the Smelt Biological Opinion appeared to be protective in June 2010 as long as outflows were above 10,000 cfs.

Table 1.  Monthly average export rates and OMRs in spring 2010, the year following the drought years of 2007-2009 which exhibited some smelt recovery.

Month 2010 Exports 2010 OMRs
April 1500 -4600 to +1200
May 2400 -1100 to +1250
June 6300 -4800 to -1200

Prescription 2 – Sustain Delta Outflows through July

Delta outflows are necessary to move smelt west to Suisun Bay through the spring.  A minimum daily average outflow of 15,000 cfs in April and May would simulate 2010 outflows (Figure 2), and would be consistent with historical relatively wet year outflows.  These outflows are necessary to maintain the Low Salinity Zone west of the Delta in Suisun Bay, outside the influence of the South Delta export pumps.  In June and July, a daily average outflow of at least 10,000 cfs would sustain smelt and the Low Salinity Zone west of the Delta away from the influence of the South Delta export pumps, and would be consistent with outflows in 2010 and 2011.  The existing minimum monthly average outflow allowed in June of a wet or normal year under the Delta standards is 7100 cfs.  The minimum outflow allowed in July of a wet or normal year (2010) is a monthly average of 8000 cfs.  Daily averages could be adjusted to accommodate spring and neap tides as long as a minimum monthly average of 8,000-10,000 cfs is maintained.  Note near maximum exports (11,400 cfs) were maintained in July in both recovery years 2010 and 2011 with June-July Delta outflows at or above 8000 cfs, because an outflow of 8000 cfs for the most part keeps smelt west of the Delta, outside the influence of the pumps.

More Protective Prescriptions

  1. Maintain -5000 OMR limit in July. Though maximum exports were maintained in July 2010 and 2011, some smelt remained in the north Delta into the summer (Figure 6) and were vulnerable to such higher exports.  Lowering exports would save smelt (and pelagic habitat), water in storage, and reduce Delta water temperatures.
  2. Provide Delta daily minimum outflows of 15,000 cfs in June, 10,000 cfs in July, and 6,000 cfs in August. These outflows would be more consistent with June 2010 and July-August 2011, and would ensure that smelt and the Low Salinity Zone are maintained in Suisun Bay (Figure 7).
  3. Employ Fall X2 Wet-Year Prescription. Maintains X2 and Low Salinity Zone in Suisun Bay in fall.

Additional Prescriptions

  1. Open Delta Cross Channel in May and June. Opening the Cross Channel Gates will increase westward flow at Jersey Point (“QWEST”) and reduce the entrainment of smelt, the Low Salinity Zone, and Delta pelagic habitat by the export pumps.
  2. Install False River Barrier. Closing False River will reduce the entrainment of smelt and pelagic habitat into Franks Tract on flood tides from the lower San Joaquin River near Jersey Point.
  3. Increase spring and summer flow down Yolo Bypass into Cache Slough. Increasing inflows from Knights Landing Ridge Cut and the Sacramento Deepwater Ship Channel, and reducing diversions from the lower Yolo Bypass and Cache Slough, will increase net flows out of Yolo Bypass-Cache Slough complex into Sacramento River in west Delta.

Expedite Future Actions

  1. Divert water from the Sacramento River at Fremont Weir into Yolo Bypass in April and May. A proposed notch in the Fremont Weir would flood the Yolo Bypass in the spring of more water years and would increase the magnitude and duration of flood flows in years when the existing weir level allows flooding.
  2. Operate gate at upper end of Sacramento Deepwater Ship Channel. This will allow added inflow into the Ship Channel and lower Cache Slough Complex from the Sacramento River at the northern end of the Delta.
  3. Move the North Bay Aqueduct intake from the Cache Slough complex to the Sacramento River.
  4. Stock hatchery-reared Delta smelt into Low Salinity Zone in Suisun Bay in summer of wet years, or in late fall/early winter of drier years.
Figure 3. May 2010 Delta smelt distribution from 20-mm Survey.

Figure 3. May 2010 Delta smelt distribution from 20-mm Survey.

Figure 4. Early June 2010 Delta smelt distribution from 20-mm Survey.

Figure 4. Early June 2010 Delta smelt distribution from 20-mm Survey.

Figure 5. June 2010 Delta smelt distribution from Summer Townet Survey.

Figure 5. June 2010 Delta smelt distribution from Summer Townet Survey.

Figure 6. Late June 2010 Delta smelt distribution from 20-mm Survey.

Figure 6. Late June 2010 Delta smelt distribution from 20-mm Survey.

Figure 7. Early July 2011 Delta smelt distribution from 20-mm Survey.
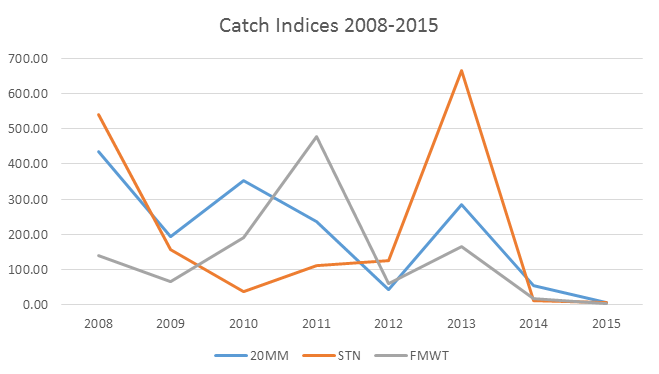
Figure 7. Early July 2011 Delta smelt distribution from 20-mm Survey.

  1.  OMR is Old and Middle River flows in South Delta showing influence of South Delta export pumps when negative.  For example: exports near 6000 cfs create OMRS about -5000 cfs, the limit prescribed through June in the Smelt Biological Opinion.

What Caused the Impending Extinction of Delta Smelt?

CSPA’s fisheries biologist Tom Cannon gave a presentation entitled “Contributing Cause of Smelt Decline: Water Exports” at a symposium on March 29, 2016 at UC Davis. The theme of the conference, sponsored by the Delta Stewardship Council, was: “Delta and Longfin Smelt: Is Extinction Inevitable?”

In his presentation, Tom put forth the hypothesis that the cause of the probable extinction of Delta smelt was the commencement of operation of the State Water Project’s Banks Pumping Plant in the mid-1970s. When Banks came on line, South Delta exports tripled, going from 2 million acre-feet to 6 million acre-feet per year. Tom’s hypothesis is that the mechanism of likely extinction was entrainment of Delta Smelt into the inflow to State and Federal South Delta pumping plants: exports.

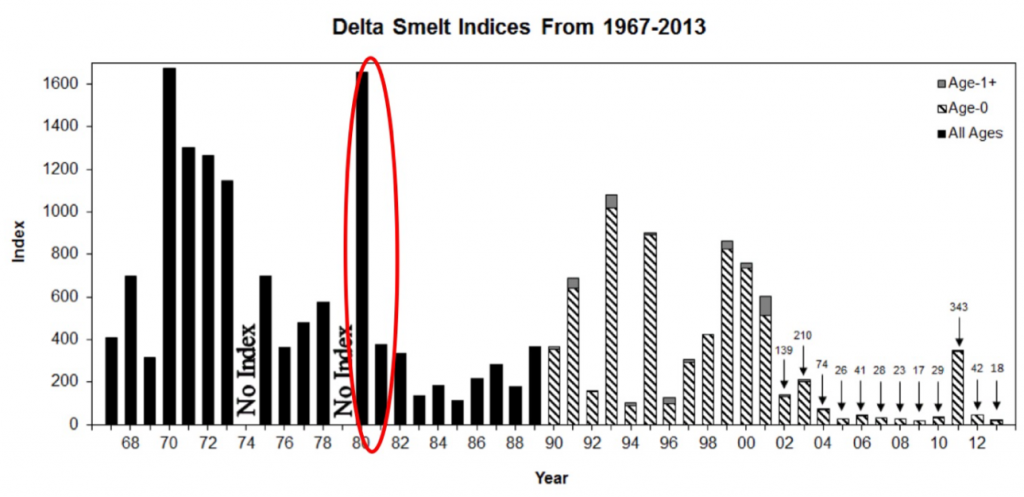
The presentation’s first slide shows the familiar long-term Fall Midwater Trawl Index (Figure 1). Tom emphasized the sharp drop in the Index in 1981 (red circle in Figure 1), the first dry year of operations under the 1978 Delta Plan (water quality standards limiting operations of the Delta pumping plants). He noted that the decline likely started in the mid-1970s, but was most severe in 1981. There were recovery periods in the non-drought years of the 1990’s and 2010-2011. However, in 2001-2005, smelt and other Delta species crashed, a period now known as the “Pelagic Organism Decline,” or POD. Following a mild recovery in the wet year 2011, Delta smelt collapsed to record low indices in 2014 and 2015 (indices of 9 and 7, respectively, not shown in Figure 1).

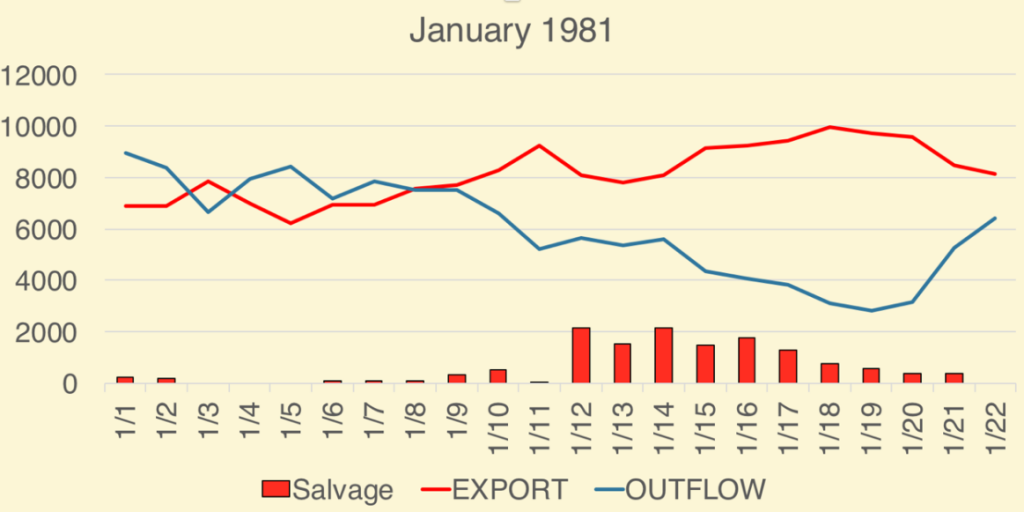
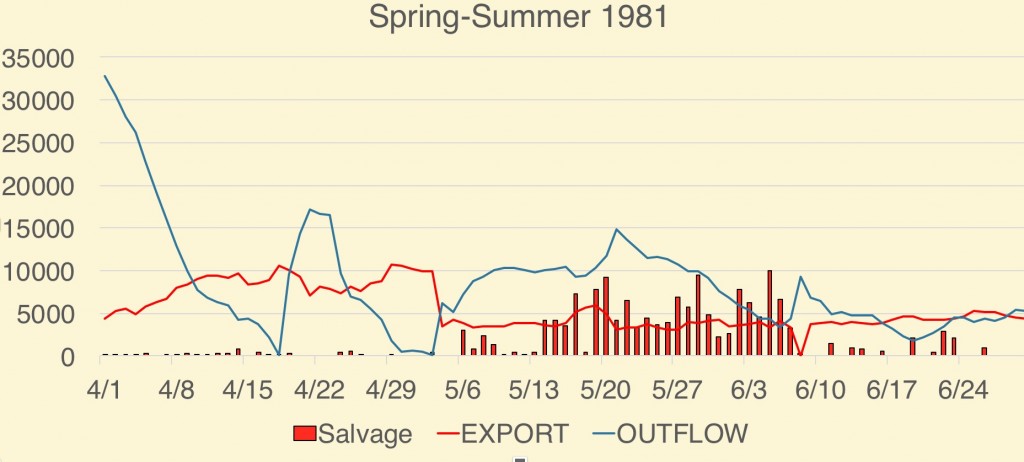
Other slides depict (1) the huge losses of adult smelt as indexed by January1 salvage numbers in 1981 (Figure 2), and (2) the salvage counts of juvenile Delta smelt in spring 1981 (Figure 3). The total salvage for January 1981 alone was over 10,000 adult Delta smelt, which compares to a total of 56 in January 2015 and 12 in January 2016. The total juvenile Delta smelt salvage in spring 1981 exceeded 100,000; in 2015, it was 4.

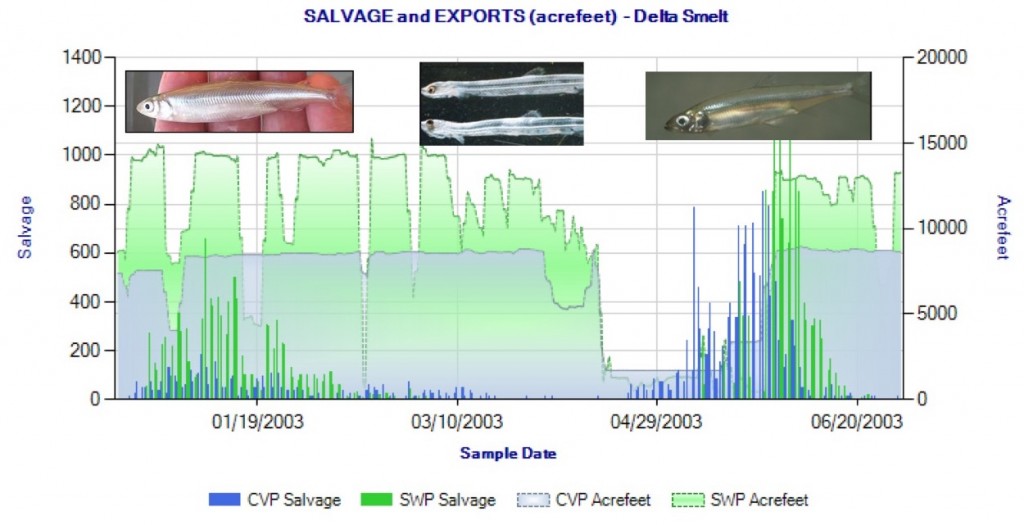
An example of salvage during the 2001-2005 POD is winter-spring salvage in 2003 (Figure 4). Tom attributes the POD decline to the tens of thousands of Delta smelt lost to entrainment in winter and spring, including a likely large number of non-detected larvae under conditions of maximum exports.

According to Tom, export entrainment is the primary causal factor for the death spiral of Delta smelt, not low outflow. There were relatively high or improved smelt abundance indices in 1972, 1990, and 1991 (see Figure 1), which were all years with low outflows but also low exports. This is not to say, however, that low outflows are not also factors that contribute to high entrainment (Figures 2 and 3).

Tom concludes that Delta smelt are virtually extinct because their adult spawning numbers are insufficient to provide recovery even under 2016’s good (wet) conditions. Adult numbers are simply too low to produce sufficient offspring (Figure 5). The proof will come this spring, summer, and fall when indices of Delta smelt juveniles will likely remain critically low and not reach 2010 or 2011 levels, the last years when habitat conditions were favorable.

Tom Cannon Presentation – Contributing Cause of Smelt Decline: Water Exports

Figure 1. Fall Midwater Trawl Index for Delta smelt 1967-2013. (Source: CDFW.)

Figure 1. Fall Midwater Trawl Index for Delta smelt 1967-2013. (Source: CDFW.)

Figure 2. January salvage of adult Delta smelt at South Delta export pumps in 1981. Also shown is export rate (cfs) and Delta outflow (cfs). The maximum allowed export rate is 11,400 cfs. (Data Source: CDFW.)

Figure 2. January salvage of adult Delta smelt at South Delta export pumps in 1981. Also shown is export rate (cfs) and Delta outflow (cfs). The maximum allowed export rate is 11,400 cfs. (Data Source: CDFW.)

Figure 3. Spring salvage of juvenile Delta smelt at South Delta export pumps in 1981. Delta smelt juveniles begin reaching salvageable size (>20 mm) in early May. Also shown is export rate (cfs) and Delta outflow (cfs). The maximum allowed exportsrate is 11,400 cfs. (Data Source: CDFW)

Figure 3. Spring salvage of juvenile Delta smelt at South Delta export pumps in 1981. Delta smelt juveniles begin reaching salvageable size (>20 mm) in early May. Also shown is export rate (cfs) and Delta outflow (cfs). The maximum allowed exportsrate is 11,400 cfs. (Data Source: CDFW)

Figure 4. Winter-spring salvage of Delta smelt at south Delta export pumps in 2003. Delta smelt young begin reaching salvageable size (>20 mm) in early May. Also shown is export rate (acre-feet per day) by pumping plant. The maximum allowed export rate is 11,400 cfs (about 23,000 acre-feet per day). (Data Source: CDFW). Winter salvage is primarily adult smelt. Spring salvage is predominantly juvenile smelt (>20 mm). April entrainment of 5-15 mm larval smelt is not accounted for at salvage facilities, because they pass undetected through salvage screens.

Figure 4. Winter-spring salvage of Delta smelt at south Delta export pumps in 2003. Delta smelt young begin reaching salvageable size (>20 mm) in early May. Also shown is export rate (acre-feet per day) by pumping plant. The maximum allowed export rate is 11,400 cfs (about 23,000 acre-feet per day). (Data Source: CDFW). Winter salvage is primarily adult smelt. Spring salvage is predominantly juvenile smelt (>20 mm). April entrainment of 5-15 mm larval smelt is not accounted for at salvage facilities, because they pass undetected through salvage screens.

Figure 5. Index of adult Delta smelt spawner abundance from winter Kodiak Trawl Survey 2002-2016.

Figure 5. Index of adult Delta smelt spawner abundance from winter Kodiak Trawl Survey 2002-2016.

  1. Salvage collections are notoriously inefficient on small fish entrained into the pumping plants. Predation loss before entering the salvage facilities has been estimated to be higher than 90%.

Smelt Update – April 1, 2016

Since the last update, Delta and longfin smelt have continued their trends of record low numbers, as shown in the most recent Smelt Larvae Survey and 20-mm Survey. They are not yet gone, but close. It remains to be seen whether the good conditions provided so far in this wet winter 2016 can lead to some form of recovery for these two endangered species.

Longfin Smelt

With the high winter flows, the young from this year’s spawn are now distributed well to the west, although some remain in the north Delta (Figure 1). Their numbers continue at record low levels (Figure 2) despite a wet winter.

Figure 1. Longfin smelt catch in mid-March in Survey #1 of 20-mm Survey.

Figure 1. Longfin smelt catch in mid-March in Survey #1 of 20-mm Survey.

Figure 2. Average catch-per-unit-effort of young longfin smelt in mid-March 20-mm surveys from 2008-2016.

Figure 2. Average catch-per-unit-effort of young longfin smelt in mid-March 20-mm surveys from 2008-2016.

Delta Smelt

Delta smelt have yet to grow into the size range captured in the 20-mm Survey, but remain present in the last Smelt Larvae Survey (Figure 3). High winter through-Delta flows have resulted in a slightly more westward distribution than in recent drought years such as 2013 (Figure 4). Although numbers collected are very low, it is too early to determine relative production for 2016 compared to previous years in the Smelt Larvae Survey or the 20-mm Survey. Under similar wet winter-spring conditions in 2010 and 2011, Delta smelt had modest population improvements. It remains to be seen if the very low adult spawning population this year (in comparison to the populations in 2010 and 2011) can lead to some form of recovery in the population under this year’s relatively wet conditions.

Figure 3. Delta smelt larvae catch distribution in mid-March 2016 Smelt Larvae Survey.

Figure 3. Delta smelt larvae catch distribution in mid-March 2016 Smelt Larvae Survey.

Figure 4. Delta smelt larvae catch distribution in mid-March 2013 Smelt Larvae Survey.

Figure 4. Delta smelt larvae catch distribution in mid-March 2013 Smelt Larvae Survey.