California’s Attorney General has sued the federal government over the new federal biological opinions for the operation of the Central Valley Project (CVP) and the State Water Project (SWP). But in fact, the State’s plan for operating the Central Valley operations of the State Water Project is not much better than the Bureau of Reclamation’s federal plan in terms of protecting Delta fish. The State’s plan is built on the same theory that the water projects can divert more water by monitoring fish presence and backing off on diversions when monitoring detects fish. This so-called “real-time operation” was also the foundation of the Department of Water Resources’ (DWR) proposal to protect fish in the 2016-2019 hearings on DWR’s proposed Delta tunnels (“WaterFix”).
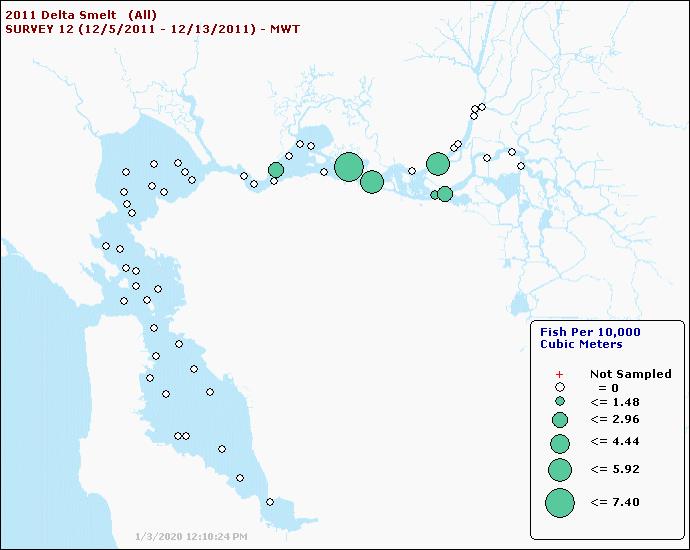
The major difference between the new state and federal plans for Delta operations is that the State plan retains a requirement for increased flow in the summer and fall of wetter water years to protect smelt. The State’s draft EIR for the Long Term Operation of the State Water Project (LTO EIR) describes the proposed Summer-Fall X2 Action for Delta outflow (Figures 1 and 2). The action/criteria proposed is to maintain “X2” (the location in the Bay-Delta where salinity measures ~2 ppt chloride, or 3800 EC) under prescribed limits in summer and fall months by water-year type.
The LTO EIR describes two alternatives: the Proposed Project and Alternative 4.1 Both would limit monthly average or 14-day average X2 at river kilometer 80 (near the CDEC Collinsville gage). The Proposed Project includes only September and October X2 objectives, while Alternative 4 also covers June-August for wet years. Under both alternatives, criteria also include opening the Suisun Marsh Salinity Control Gates (SMSCG), an action to reduce EC at Collinsville gage and in Suisun Marsh and Montezuma Slough, which would raise salinity in eastern Suisun Bay.
I discussed the ramifications of the federal Biological Opinions in a September 2019 post. The only major beneficial change that the LTO EIR proposes is adding summer X2 criteria in Alt 4 to extend outflow protection from June 20 to August 31. The new Fall X2 requirement (September-October) in the LTO EIR would be less protective than existing Fall X2 objectives, because the new state requirement would move the compliance point upstream from km74 to km80.
In order to understand how the state’s proposed new Summer-Fall X2 requirement would work, I examine below how the action might have applied in recent water years 2016-2019, two below normal water years and two wet water years..
Below Normal Water Years 2016 and 2018
Under the LTO EIR criteria (both the Proposed Project and Alt 4 alternatives), the X2 location and low salinity zone would be similar to historical 2016 conditions (Figure 3), except that outflow could be lower and salinity higher in June, when there would be higher exports, less outflow, and a warmer more upstream low salinity zone (Figure 4). The main benefit of the X2 Action under Alt 4 would be that it would extend the D1641 agricultural salinity standards past June 20 by making them also apply from June 20 through August. Both the D1641 and Alt 4 criteria allow significant daily variation in X2: 14-day and monthly averages.
In 2018 (Figure 5) there would be a similar potential negative effect in June and a positive benefit in August under Alt 4.
Wet Water Years 2017 and 2019
Under the proposed LTO EIR criteria for wet years, Fall X2 criteria (September-October) would be the same as described above for below normal years. This would weaken protection in comparison with the previous Fall X2 requirements in the 2008-09 biological opinions (Figures 6 and 7). Summer (June-August) criteria would be generally less protective than existing D1641 salinity standards for wet years. If the State were to adopt the LTO EIR summer criteria, salinities would be higher and the low salinity zone further upstream and warmer than occurred in June-August of wet years 2017 and 2019. This would allow higher exports.
Summary and Conclusion
Under both the Proposed Project and Alternative 4, the LTO EIR’s Summer-Fall Proposed Plan for Delta outflow (Figures 1 and 2), Delta outflows would be lower, south Delta exports would be greater, and the low salinity zone further upstream and warmer in the fall (Sep-Oct) of wet years. Such changes would be highly detrimental to salmon and smelt. In below normal years, outflows may be higher from June 20 through August under Alt 4. Such changes would be beneficial to salmon and smelt.
Operation of the SMSCG would lower EC at Collinsville and in Montezuma Slough and increased EC in eastern Suisun Bay. This would be detrimental to smelt rearing in Suisun Bay. For more detail on this issue, see http://calsport.org/fisheriesblog/?p=2813.
Overall, the State’s plan would weaken existing X2 compliance criteria and result in higher exports of water from the south Delta in September and October in wet years. Alternative 4 would potentially provide more summer outflow in below normal years, which currently have no summer ag-salinity standard.
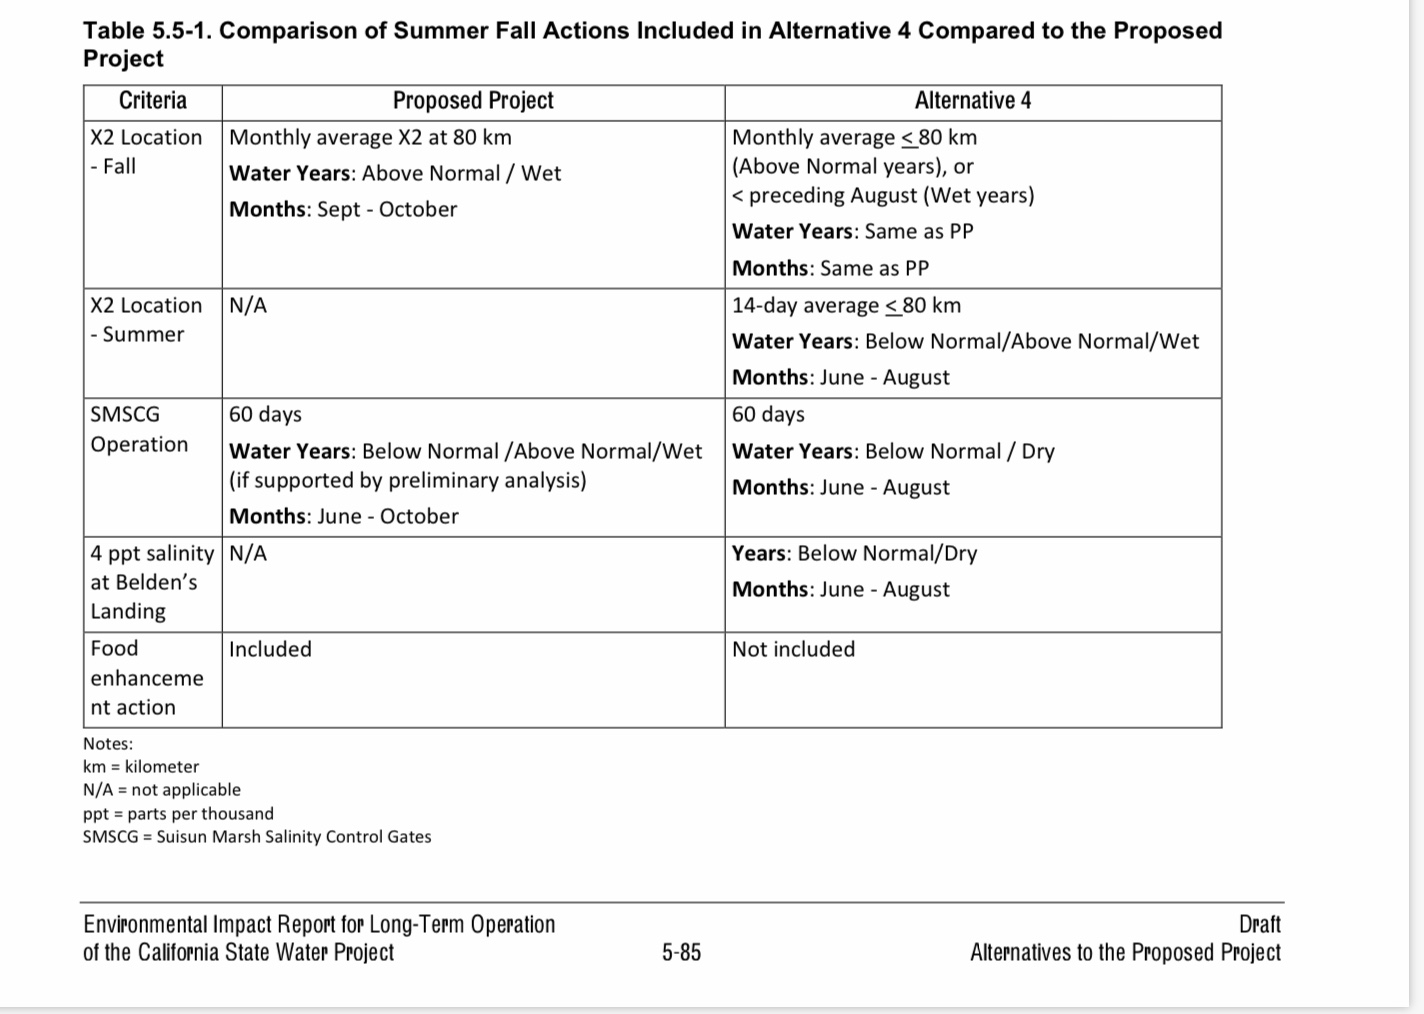
Figure 1. Comparison of Summer-Fall actions for the Proposed Project and Alternative 4.
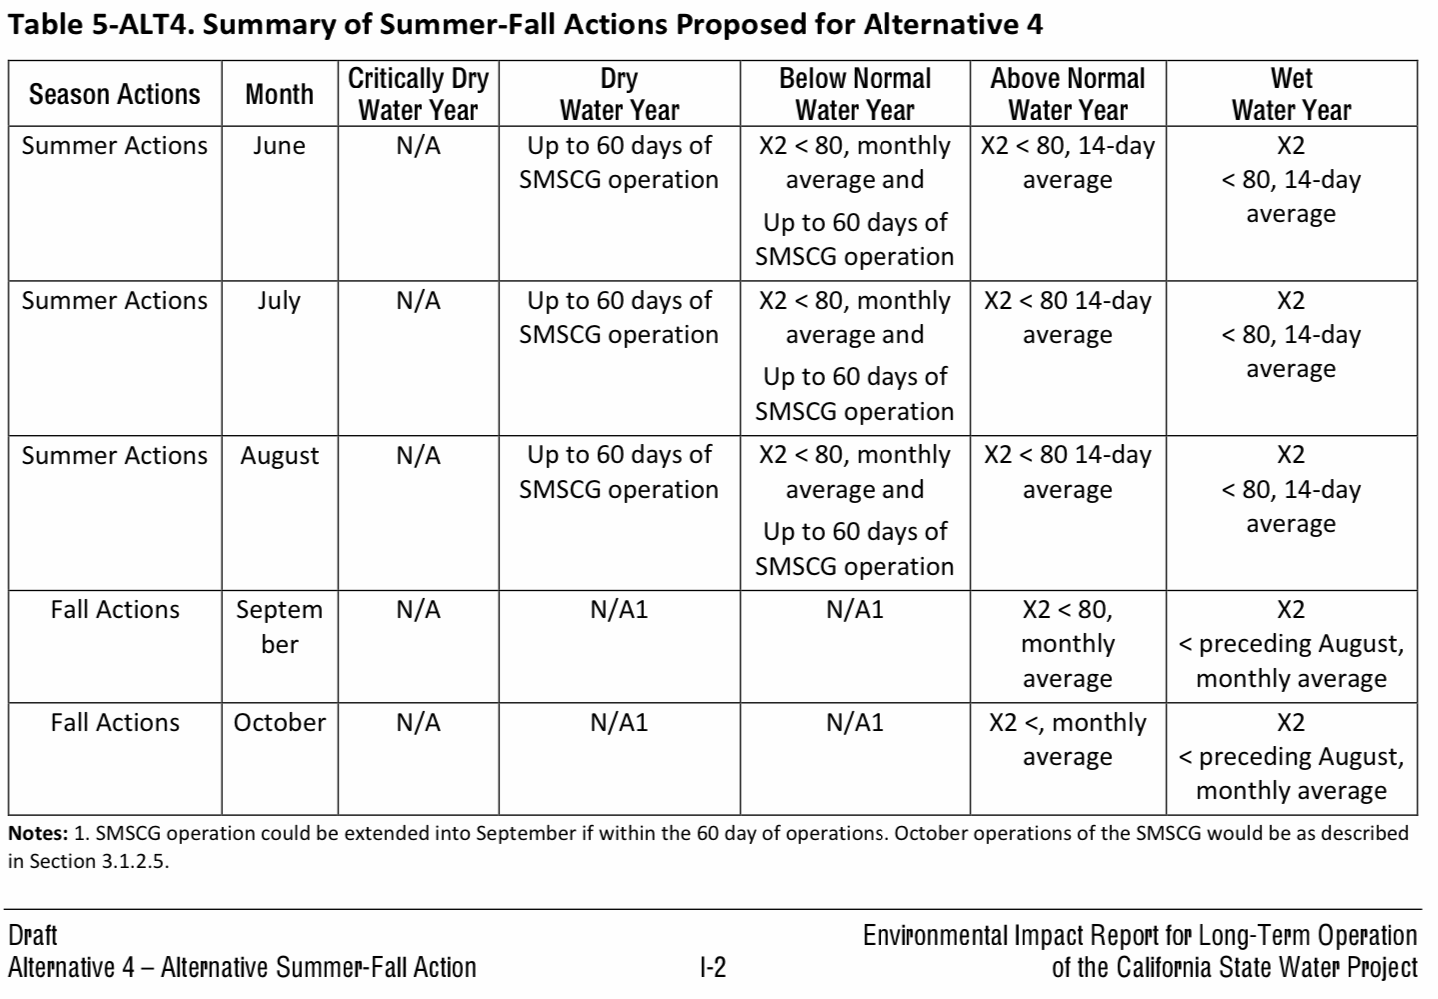
Figure 2. Proposed Summer-Fall Actions in LTO EIR Alternative 4 (Table 5, p I-2 in EIR).
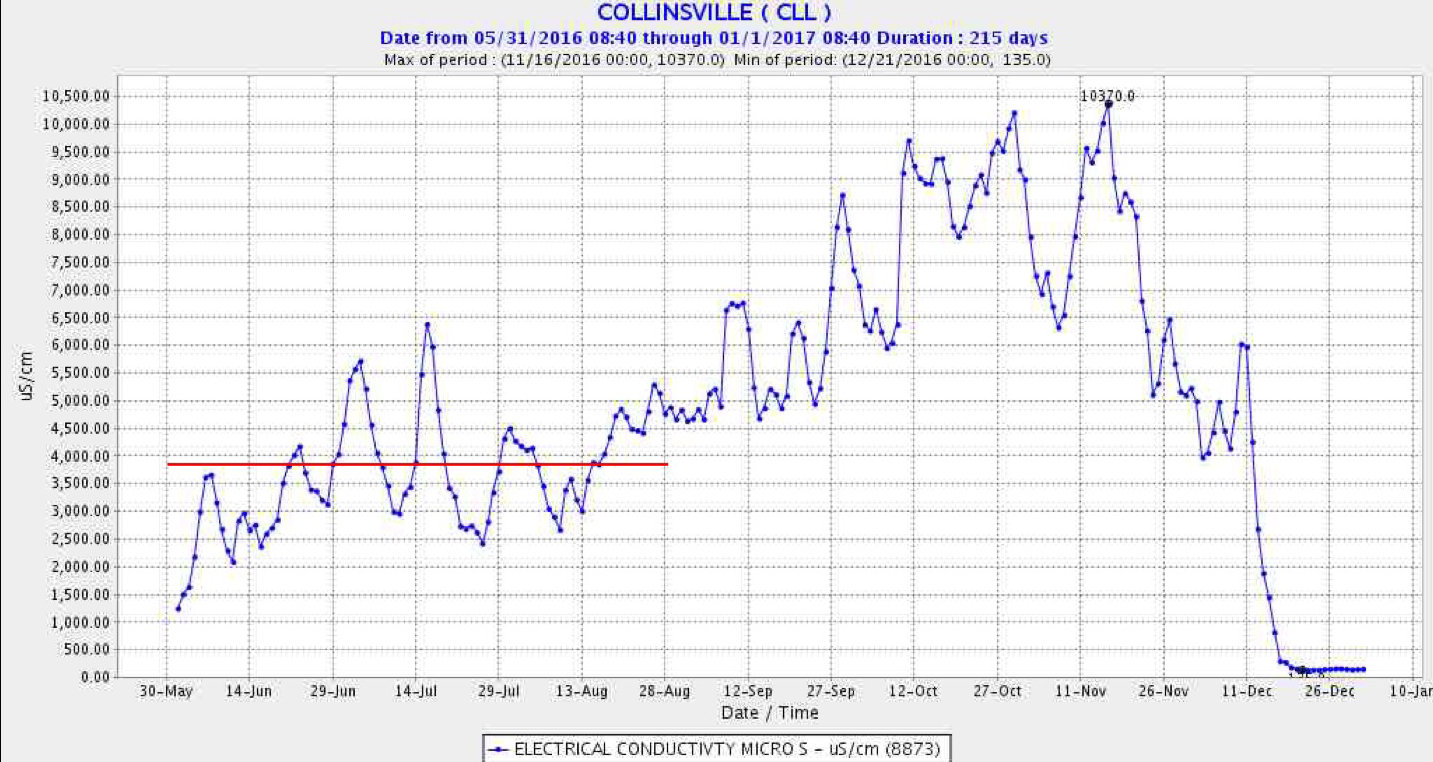
Figure 3. Collinsville EC in below-normal water year 2016. Salinity (EC) at Collinsville (~km 80) June-Dec 2016, a below normal water year. Red line shows proposed monthly-average EC objective in Alt 4.
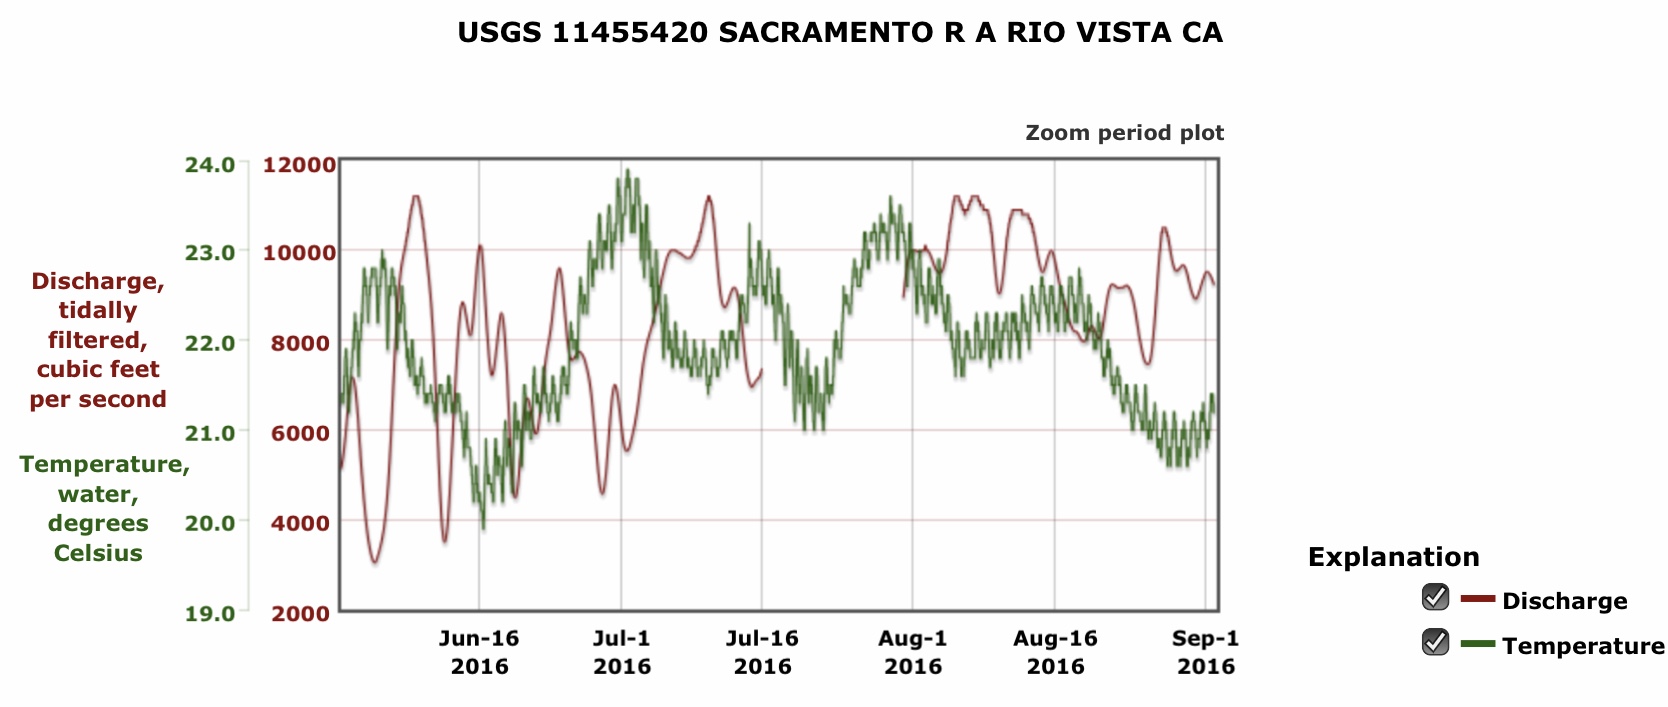
Figure 4. Summer water temperature at Rio Vista in northwest Delta in 2016. Note in early summer water temperatures tend to be higher in the lower range of net river flow and high seasonal tides.
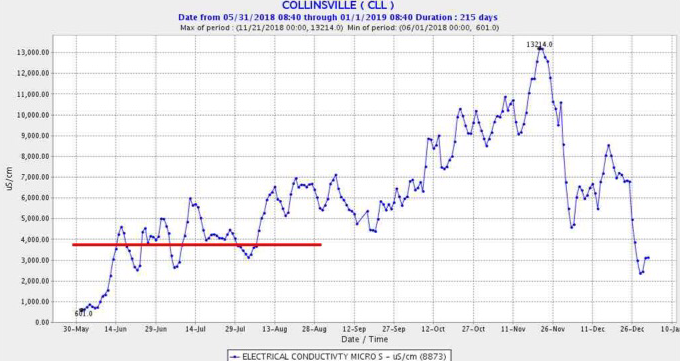
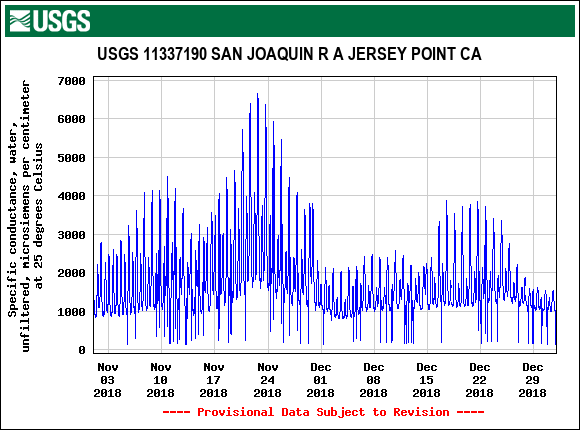
Figure 5. Salinity (EC) at Collinsville (~km 80) June-Dec 2018, a below normal water year. Red line shows proposed monthly-average EC objective proposed only in Alt 4.
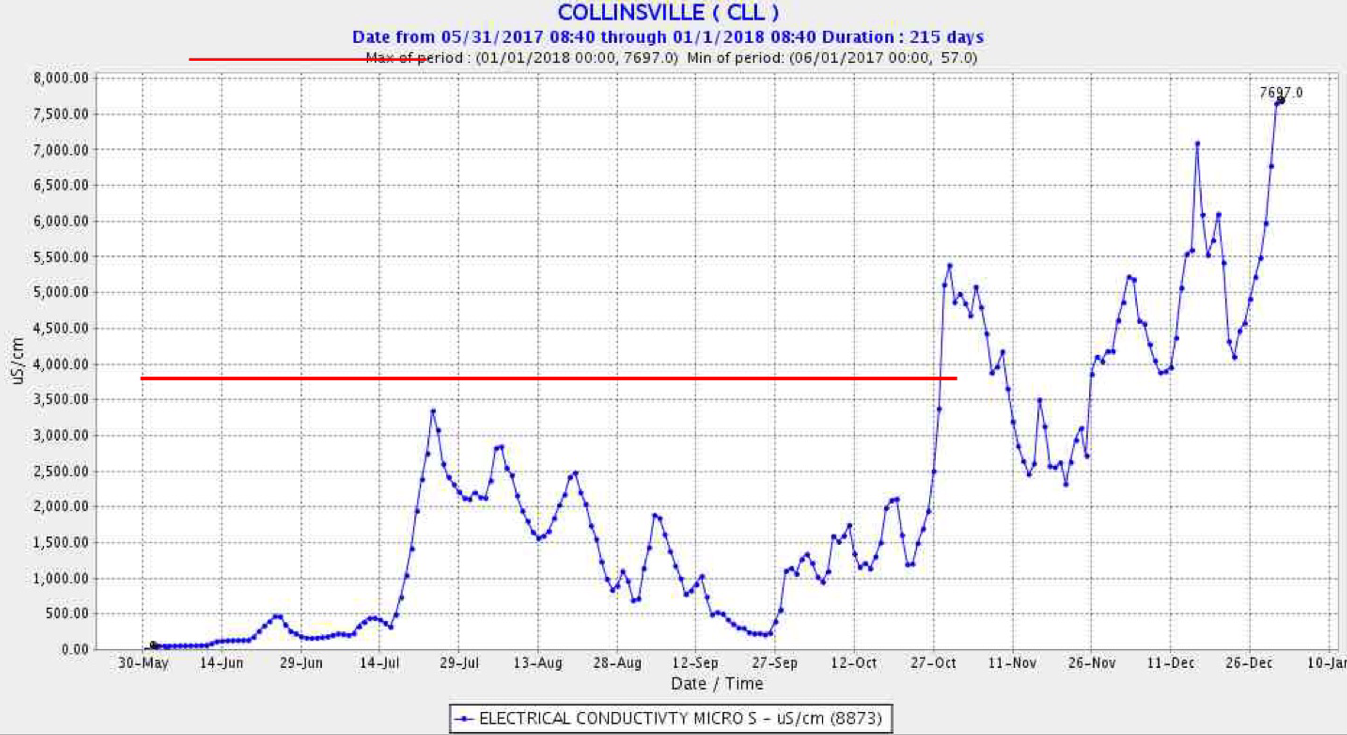
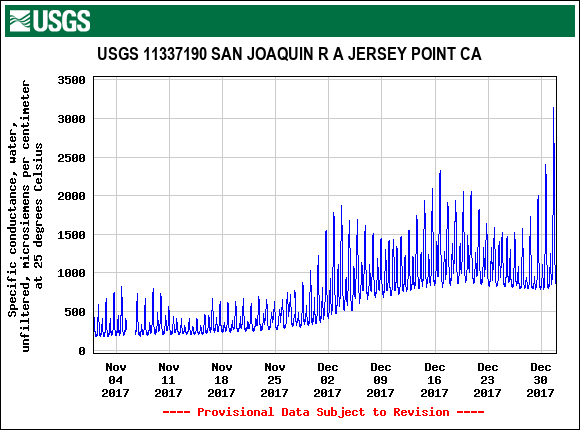
Figure 6. Salinity (EC) at Collinsville (~km 80) June-Dec 2017, a wet water year. Red line shows proposed monthly-average or 14-day EC objectives in the Proposed Project and Alt 4.
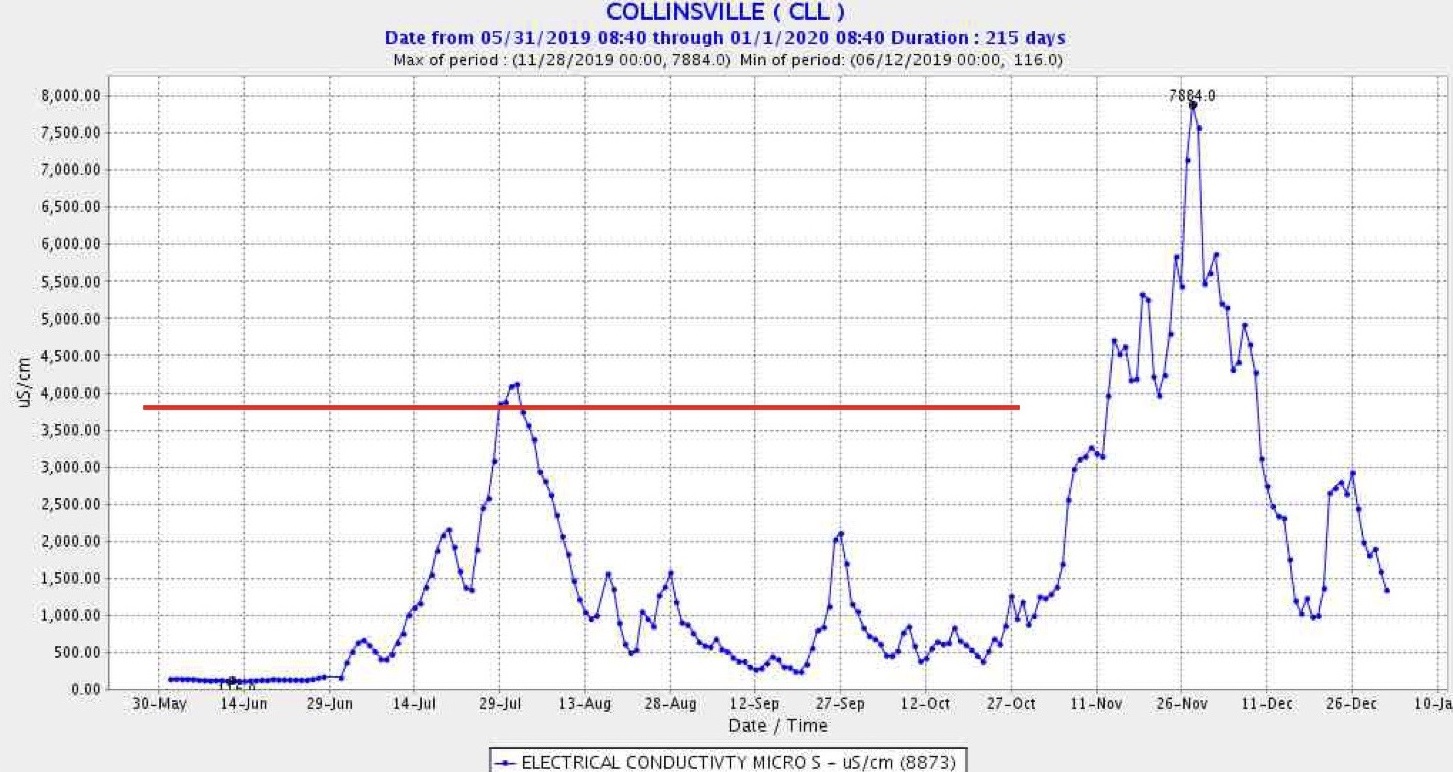
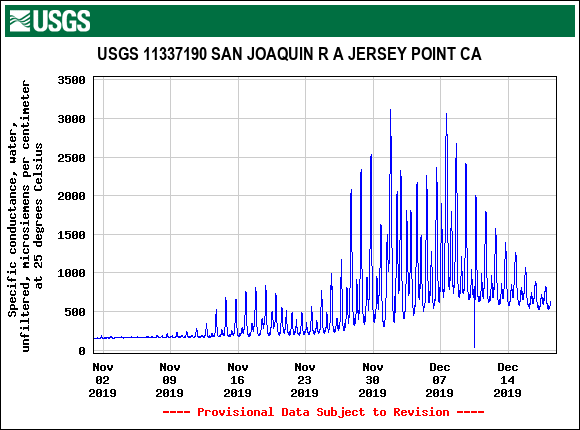
Figure 7. Salinity (EC) at Collinsville (~km 80) June-Dec 2019, a wet water year. Red line shows proposed monthly-average or 14-day EC objectives in the Proposed Project and Alt 4.
- According to the description in the EIR, Alternative 4 is a more smelt-friendly alternative than the Proposed Project. ↩