
The Klamath River Chinook salmon fall run is expected to be a record low in 2017.1 Predictions are near or below the record low run in 1992. These record low runs followed extended droughts from 2013 to 2015 and 1990 to 1992, respectively.
A very low run in 2016 prompted the Yurok Tribal Council to cancel its commercial fishing season to protect future fish populations. The 2016 salmon allocation was the second lowest on record, and failed to provide each tribal member a salmon. The Tribe did not serve fish at the annual Klamath Salmon Festival for the first time in the event’s 54-year history. In January 2017, the federal government issued a disaster declaration for the 2016 Yurok Tribe fishery.2
An April 6, 2017 article in the Eureka Times Standard stated:
- Tribal fishery scientists such as Michael Belchik of the Yurok Tribe stated the low return of spawners is the result of several severe years of drought conditions and river management practices, which caused the waters to warm and become hot beds for toxic algae and deadly parasites. In 2014 and 2015, up to 90 percent of juvenile Chinook salmon on the Klamath River are estimated to have died from an intestinal parasite, believed to be a major cause for this year’s low run, as were poor ocean conditions…. “All these things together conspire to create a real catastrophe for fisheries,” Karuk Tribe Natural Resources Policy Advisor Craig Tucker said.
- Organizations see dam removal and changes to the federal government’s management of the river as being key solutions to the underlying causes of this year’s low salmon return.” “The solution for this problem is to remove the Klamath dams now,” Pacific Coast Federation of Fishermen’s Association Executive Director Noah Oppenheim said.
A Yubanet article described the expected ancillary effect on the whole California coastal fishery:
The disaster stems from a crash of Klamath salmon stocks, but in order to protect the few Klamath fish that are in the ocean, fisheries regulators have little choice but to close or nearly close the economically valuable commercial and sport fishing seasons along the length of the Northern California and Oregon coastlines. This will impact tribal and non-tribal families alike.
CDFW stated: “Chinook that will be harvested in ocean fisheries in 2017 hatched two to four years ago, and were deeply affected by poor river conditions driven by California’s recent drought.”
A UC Davis study placed some of the blame on hatcheries. “My results suggest that hatcheries’ harm to wild salmonids spans the entire Klamath River basin. For fall Chinook salmon, the decline is concurrent with increases in hatchery returns – a trend that could lead to a homogenous population of hatchery-reared Chinook”.
Having been involved in the Klamath River for 40 years, I provide some of my own insights in this post. In follow-up posts, I will take a closer look at the Scott and Shasta rivers, the two main salmon tributaries of the upper Klamath that contribute substantially to the overall upper Klamath salmon run.
A summary of the overall Klamath salmon run escapement numbers or spawner estimates for the past 40 years is shown in Figure 1. The spawning numbers in 2016 were low, yet this drop came only two and four years after near record runs. Contributions for all six upper Klamath subcomponents in 2016 were down substantially from 2014. Predictions of a poor run in 2017 come from the low number of two-year-old “jack” salmon in the 2016 spawning run.
The question is: why did the strong run in 2014 produce the expected record low run in 2017? And why did the strong run in 2012 produce the weak run in 2015? And on the flip-side, why were the runs in 2012 and 2014 so strong, especially given they occurred during the recent multiyear drought?
A close look at the spawner-recruit relationship (Figure 2), how recruits are related to the number of spawners three years earlier, provides further insight into factors controlling long-term recruitment.
- The spawner-recruit relationship is weak at best, reflecting the fact that estimates might be poor and/or that other factors are more important than just the number of spawners. The 1995 recovery after the record low 1992 run provides compelling evidence that survival and recovery can be strong even from the weakest of runs (with strong hatchery support – see hatchery component for 1995 in Figure 1). Unfortunately, 2017 appears to suggest that strong runs can produce very weak returns three years later if other factors such as drought are dominant.
- The population crashes (2016, 2004, 1992) occurred after multi-year droughts (Figure 3). Multiyear effects compound changes to sediment, pathogens, and water quality, the suggested causes of these crashes.
- Population expansions (2012-2014, 2007-2009, 2000-2003, 1995-1997, 1985-1988) occur after a series of wetter years.
- There may be some underlying effect of floods, as indicated by the poor run in 1999, a consequence of the New Year 1997 flood that washed out the fall 1996 spawn.
- The poor run in 2016 and the expected record low run in 2017, in addition to the effects of the 2013-2015 drought, may have been affected by poor ocean conditions, as was believed to be the case in the poorer than expected 2004-2006 runs.
- Several factors potentially affect production or survival per spawner: conditions during the spawning run (flows, water temperature, disease, upstream passage hinderances, etc), first year rearing and emigration conditions (flows, water temperature, predators, prey, disease, toxins, etc), and ocean conditions. It is likely that flows throughout the water year (Figure 4) have some effect on survival of the affected or subsequent brood years.
- The contribution of the Shasta River appears to have increased in recent years, likely as a result of the Nature Conservancy’s efforts at Big Springs (more on this in an upcoming post).
Overall, the droughts of 1990-1992 and 2013-2015 (Figure 3) were likely the single most important factors in the upper Klamath Chinook salmon population dynamics. The role of the Irongate Hatchery contributions seems relatively stable and a likely important contributor to recoveries after drought. I was unable to determine the contribution of hatchery salmon to the other components of the run, but it is likely a large factor in the Bogus Creek and upper Klamath elements. It is possibly a lesser factor in the Salmon, Scott, and Shasta river elements, which speaks to the importance of these potentially “wild” runs.
In closing, some thoughts on potential solutions:
- Knowing a good run was occurring in drought year 2014, managers could have done more to protect the spawners, eggs-embryos, and subsequent rearing-emigrating juveniles with better flows and water quality. Perhaps the recent federal court decision may help ensure future protections. In poor water supply years like 1990-1992 and 2013-2015 (Figures 3 and 4), water managers simply must provide protections for salmon.
- Future removal of the four dams may help reduce the adverse multiyear effect of droughts on disease and water quality and may provide additional spawning and rearing habitat.
- Much more could be done to increase run components from the Scott and Shasta rivers (more on this in upcoming posts).
- The hatchery program is long overdue for reform and upgrade. The program should shift from production to conservation of fall-run and spring-run Chinook, Coho and steelhead.
- These and other suggestions are discussed in a prior post.
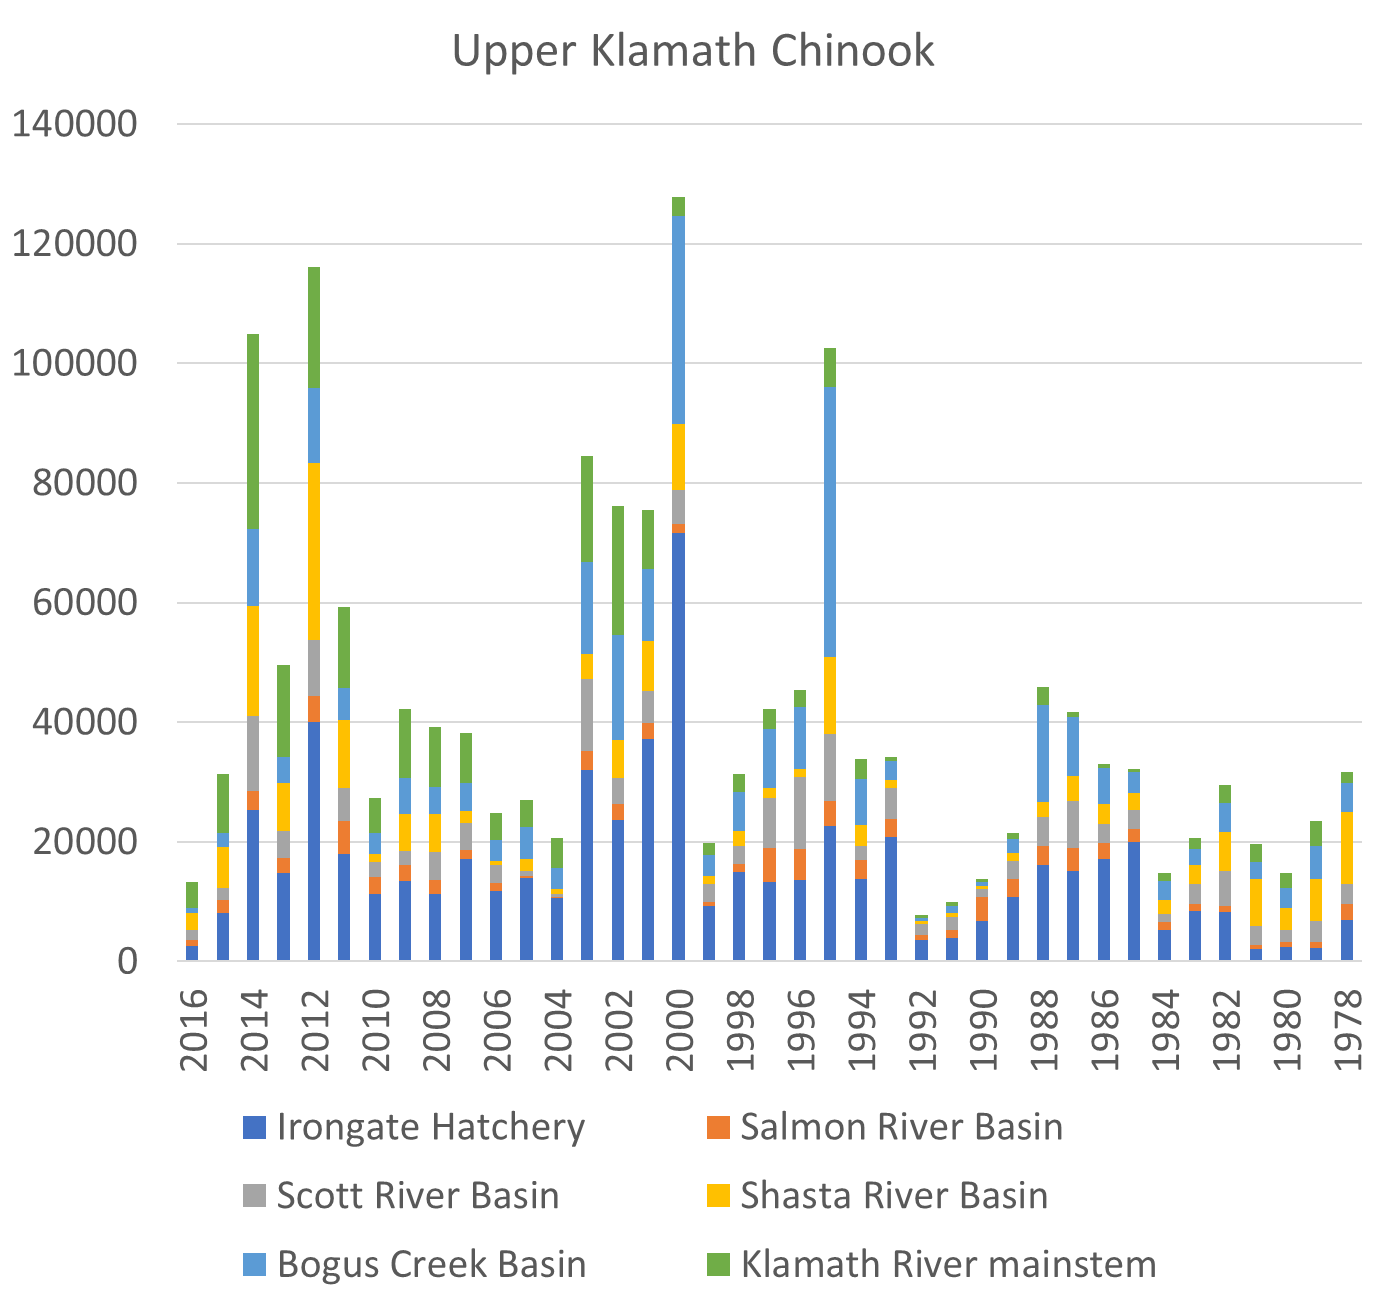
Figure 1. Chinook salmon escapement estimates to the upper Klamath River including Irongate Hatchery, Bogus Creek, Scott River, Salmon River, Shasta River, and Klamath River mainstem below Irongate Dam. The preliminary prognosis for fall 2017 total escapement is 11,000. Source: http://www.pcouncil.org/salmon/background/ document-library/#EnvironmentalAssessmentsalLib
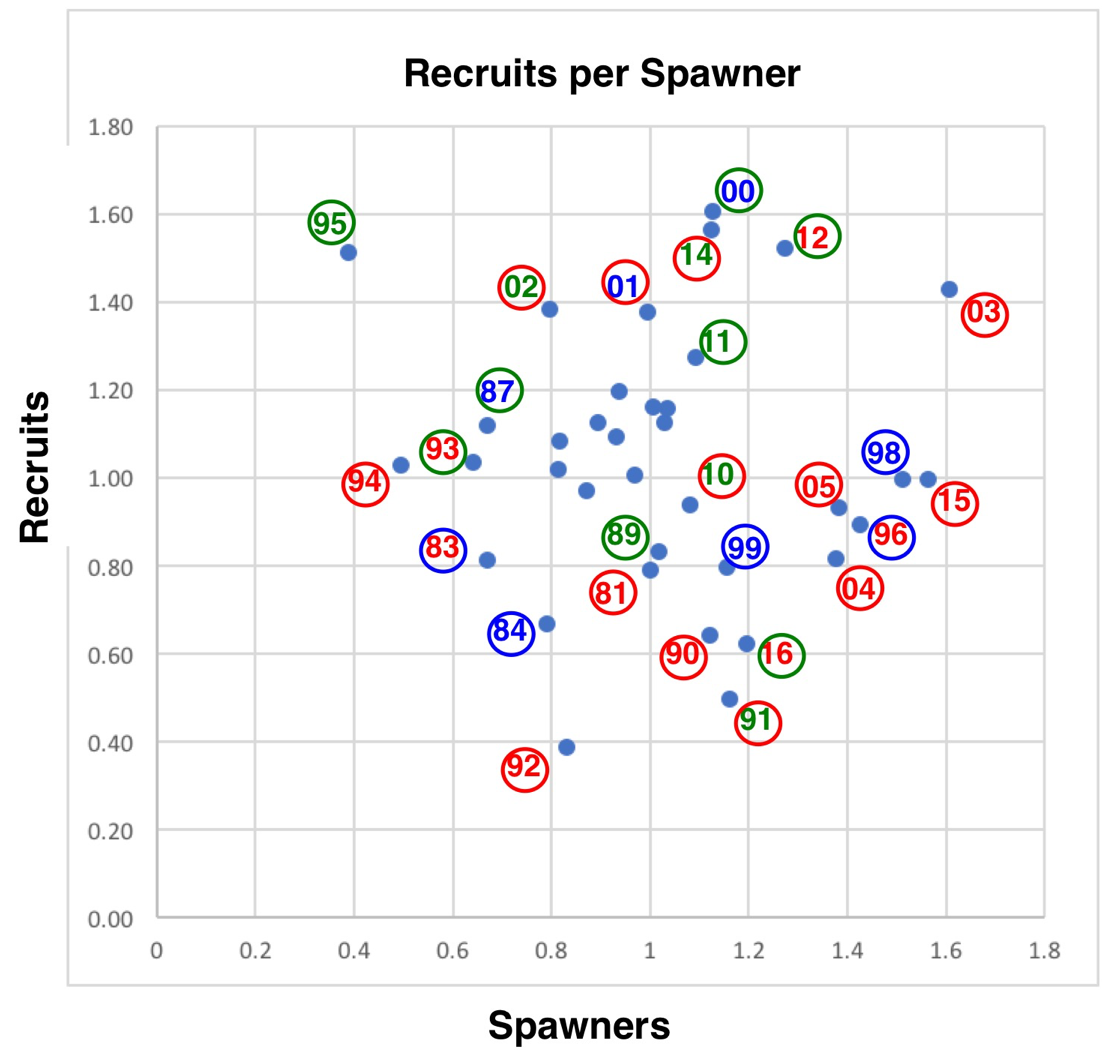
Figure 2. Spawner-Recruit relationship for upper Klamath River fall-run Chinook salmon population. The number is the transformed (log10X – 3.5) escapement estimate for the fall of that year as shown in Figure 1. The color represents winter-spring hydrology conditions in the Klamath River two years earlier when this brood year was rearing in river habitats. Red is dry, green is intermediate, and blue is wet (from Figure 3). Circle color represents late summer water year conditions in numbered year. For example: year 92 represents the recruits in fall 1992 from brood-year 1989 spawn that reared in 1990 winter-spring (red dry year); the red circle represents dry conditions in late summer of that water year (1992). Note that the spawning run for 2002, the year the large die-off of adult salmon occurred in the lower river due to low flow and high water temperatures, likely contributed to the poor returns (recruits) in 2004 and 2005.
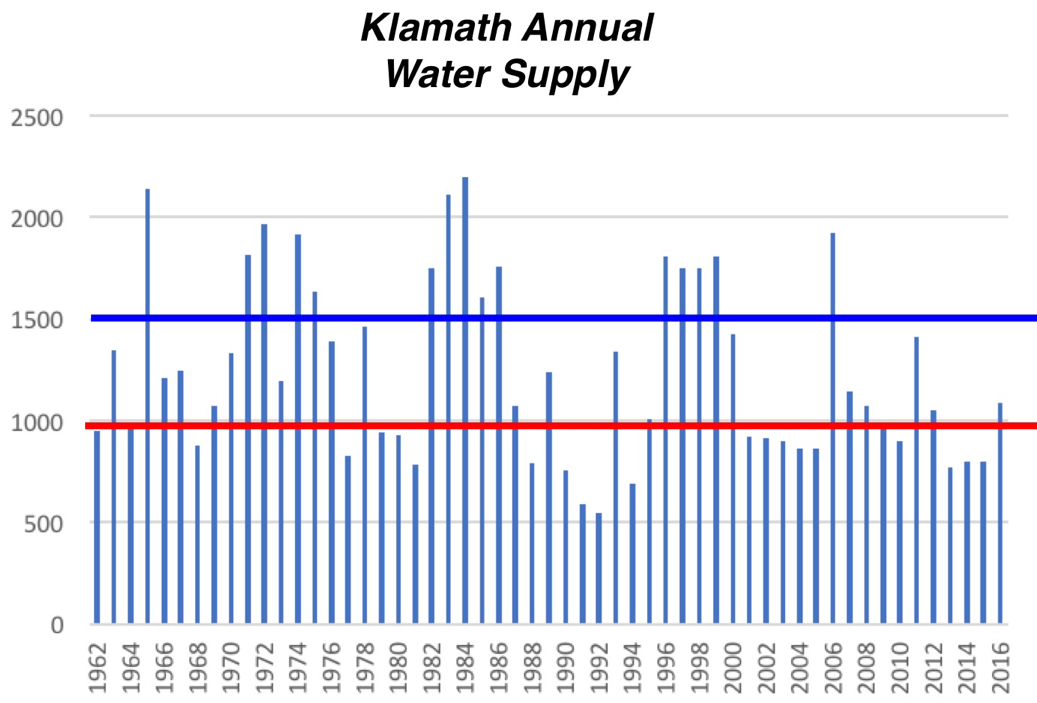
Figure 3. Average annual discharge by water year (10/1-9/30) of Klamath River as measured at Link River near Klamath Falls, Oregon. Data source: https://waterdata.usgs.gov/nwis/ annual?site_no=11507500&agency_cd=USGS&por_11507500_113138= 545477,00060,113138,1962,2017&year_type= W&referred_module=sw&format=rdb
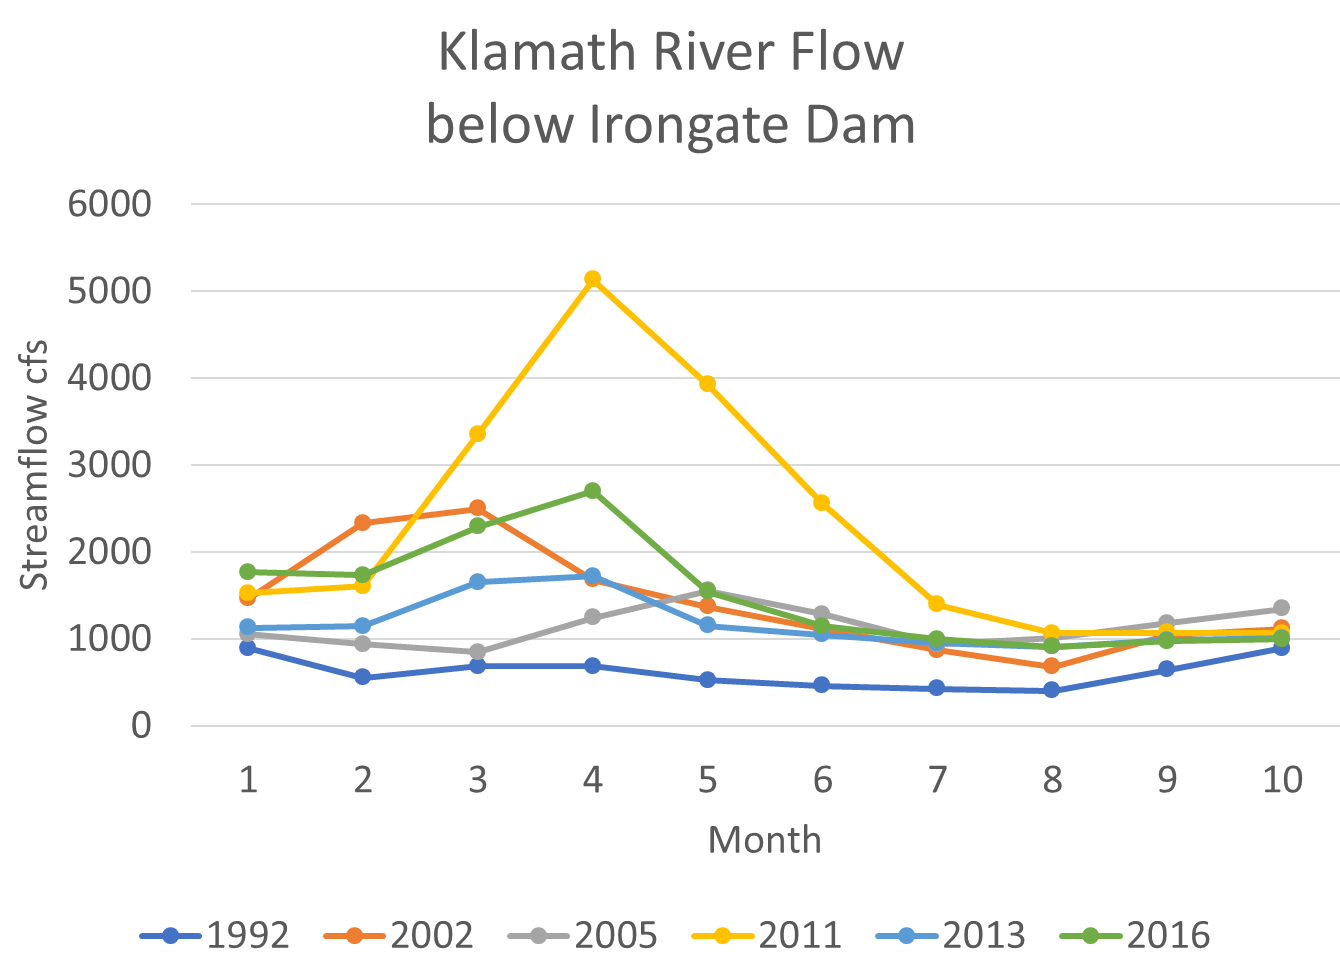
Figure 4. Monthly average flow (cfs) in Klamath River below Irongate Dam in selected years. Year 2011 was a wetter year. Year 1992 was a critically dry year. Years 2002, 2005, and 2013 were dry years. Year 2016 was an intermediate water year. Source: www.waterdata.usgs.gov.
- http://www.seafoodnews.com/Story/1055740/Yurok-Tribe-Warns-of-Most-Catastrophic-Fisheries-Collapse-in-Klamath-River-History https://ww2.kqed.org/news/2017/04/07/commercial-fishermen-yurok-hoopa-tribes-say-klamath-salmon-catch-will-be-meager/ ↩
- http://earthjustice.org/blog/2017-february/we-could-not-be-idle-while-our-fish-were-again-under-siege ↩