This is the last of four part series on the effects of the Shasta-Trinity Division on Sacramento and Klamath-Trinity River salmon. Part 1 introduced the problem: the failure of Reclamation to manage the Shasta-Trinity Division to protect the salmon resources of the Sacramento and Klamath-Trinity river systems. Parts 2 and 3 summarized the effects on salmon in the Sacramento River and Klamath-Trinity, respectively. In part 4, we suggest solutions to the problems.
The Reasonable and Prudent Alternative (RPA) in the NMFS 2009 Biological Opinion (NMFS OCAP BO) for operation of the federal Central Valley Project (CVP) and the State Water Project (SWP) simply does not go far enough to protect salmon resources affected by the Shasta-Trinity Division of the CVP. NMFS has concluded the RPA is all it can order, acknowledging that it is not enough in the driest years. But even in the worst years, there is much that could be reasonably done to save the salmon in both river systems, including action under Reclamation’s control and NMFS’s jurisdiction.
NMFS’s Biological Opinion states: “NMFS recognizes that the RPA must be an alternative that is likely to avoid jeopardizing listed species or adversely modifying their critical habitats, rather than a plan that will achieve recovery.”1 However, the RPA is not adequate to avoid jeopardy because the two long-term elements (reintroduction above Shasta and restoring Battle Creek) are too slow in developing. NMFS has also failed to petition the State Board to modify Water Right Order WR-90-05 to limit deliveries to Sacramento Valley Settlement Contractors in drought years, a need described in the BO. Continuing deliveries to the Settlement Contractors in summer of 2014 led directly to the loss of the 2014 Winter Run brood year.
“Providing fish passage at Shasta, Nimbus, and Folsom Dams, which ultimately is the only means of counteracting the loss of habitat needed for egg incubation and emergence, and steelhead over-summering habitat at lower elevations. This habitat loss has already occurred and will be exacerbated by climate change and increased water demands”. Habitat and CVP operations were adequate in the early 1970s, 30 years after Shasta Dam was constructed to sustain the Winter-Run population at 40 to 50 thousand spawners each year. It is the conditions below the dams that have changed to make sustaining salmon more difficult. Many of the effects are reversible through CVP operation changes and restoration of habitats below the dams. It was just over a decade ago the population had again reached 20,000 under the concerted funding and management afforded by the CVPIA and prescriptions of the previous NMFS BO.
“The effects analysis in this Opinion highlights the very challenging nature of maintaining an adequate cold water pool in critically dry years, extended dry periods, and under future conditions, which will be affected by increased downstream water demands and climate change. This suite of actions is designed to ensure that Reclamation uses maximum discretion to reduce adverse impacts of the projects to winter-run and spring-run in the Sacramento River by maintaining sufficient carryover storage and optimizing use of the cold water pool.” Reclamation has not used maximum discretion, and thus has not maintained sufficient carryover storage in Shasta or Trinity reservoirs and has failed miserably at managing the cold-water pools in both reservoirs.
There are many instances where Reclamation has misrepresented its abilities and intentions and has inadequately portrayed its underlying reasons for taking specific actions in the operation of the Shasta-Trinity Division. Its primary objective has been to meet the water demands of contractors and to generate the maximum amount of peaking power possible from the Division’s many hydropower plants.
“The effects analysis in this Opinion, and supplemental information provided by Reclamation, make it clear that despite Reclamation’s best efforts, severe temperature-related effects cannot be avoided in some years. The RPA includes exception procedures to deal with this reality. Due to these unavoidable adverse effects, the RPA also specifies other actions that Reclamation must take, within its existing authority and discretion, to compensate for these periods of unavoidably high temperatures. These actions include restoration of habitat at Battle Creek that may be support a second population of winter-run, and a fish passage program at Keswick and Shasta dams to partially restore winter-run to their historical cold water habitat.” The severe temperature related effects on the Sacramento and Klamath-Trinity rivers can be avoided by better balancing the water supply between contractor water demands, peaking power generation, and salmon.

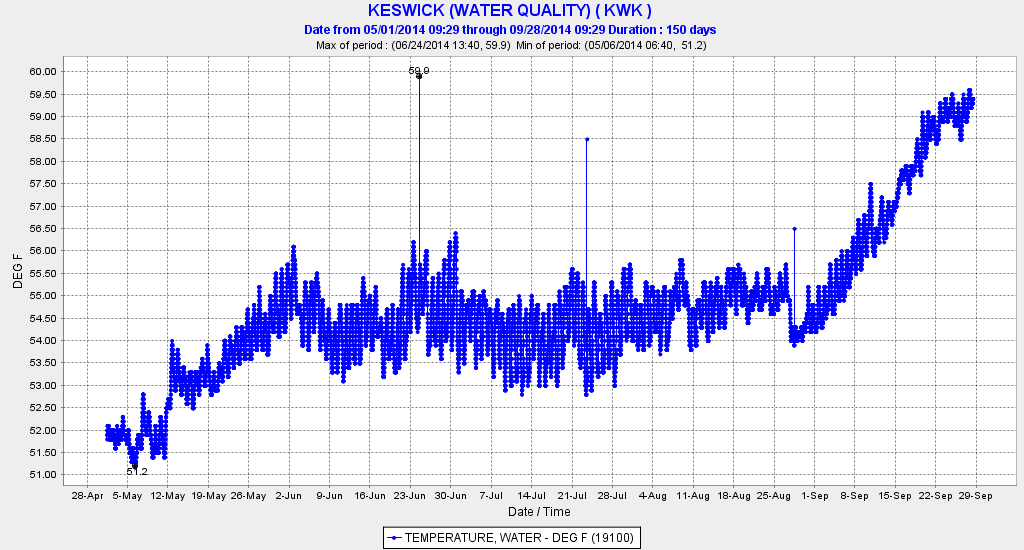
The BO allows sustaining Winter Run spawning to only the 5-mile reach between Redding and Keswick Dam in drought years like 2014 and 2015. Even in these years salmon were not protected in this minimal reach. (Map Source)
“An RPA must avoid jeopardy to listed species in the short term, as well as the long term. Essential short-term actions are presented for each division and are summarized for each species to ensure that the likelihood of survival and recovery is not appreciably reduced in the short term (i.e., one to five years). In addition, because the proposed action is operation of the CVP/SWP until 2030, this consultation also includes long-term actions that are necessary to address project-related adverse effects on the likelihood of survival and recovery of the species over the next two decades.” The RPA prescribed in the NMFS BO obviously is inadequate to avoid jeopardy especially in the short term. The following are further actions necessary to avoid jeopardy.
Reduce Reservoir Releases Designed to Meet Contractor Water Demands
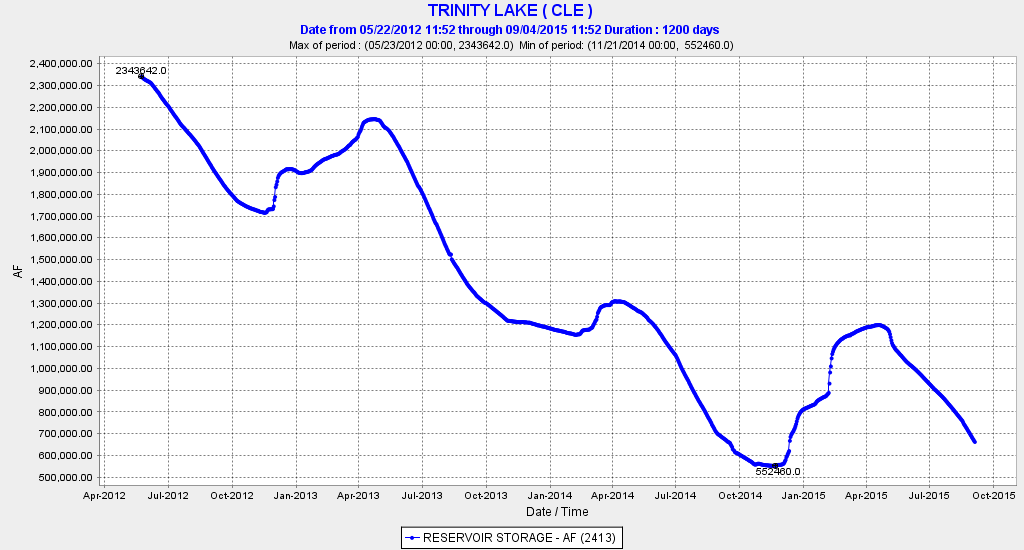
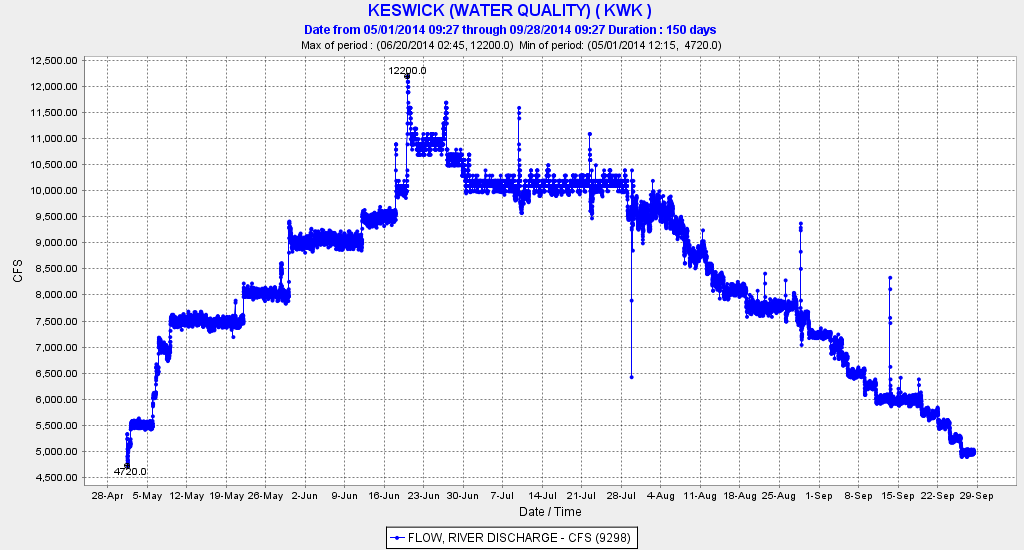
Reclamation, NMFS and the State Board must reduce Shasta and Trinity reservoir releases to meet downstream water demands. They have instead adopted the illegal and ineffective strategy of weakening standards to satisfy demands during the present four-year drought, and salmon have gone unprotected. Redistribution of water demands via use of spring and fall water transfers in the Central Valley has generally aggravated the problem by adding to water demands from August through November when cold water pools in reservoirs are limited. Transfers are a further burden because of the need to add carriage water. Export of Trinity water to the Sacramento River to meet contractor demands places a burden on both the Trinity and Shasta cold water pools. Target end-of-September “safe” carryover storage levels have not been achieved in 2014 or 2015 at either Shasta or Trinity reservoirs.
Changes in Hydropower Operations
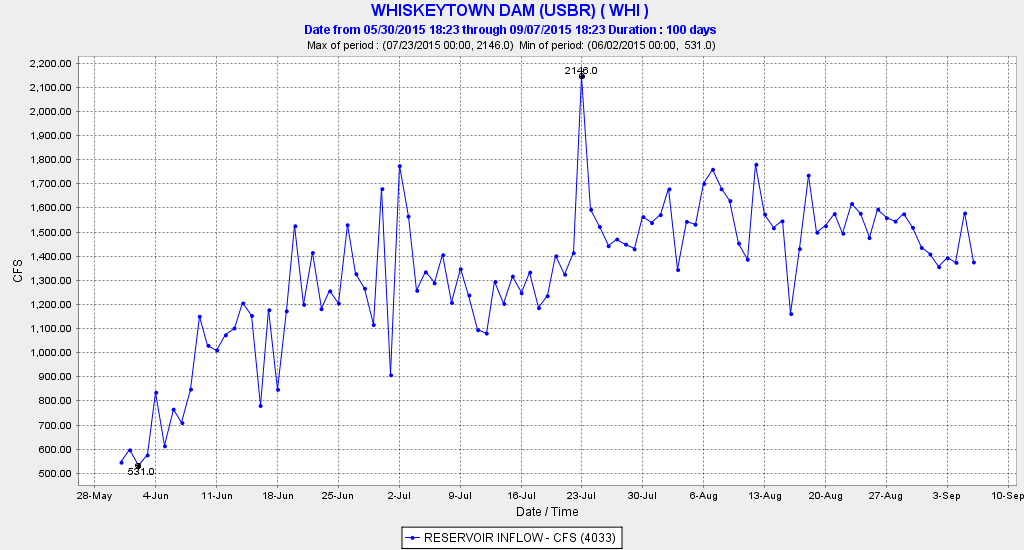
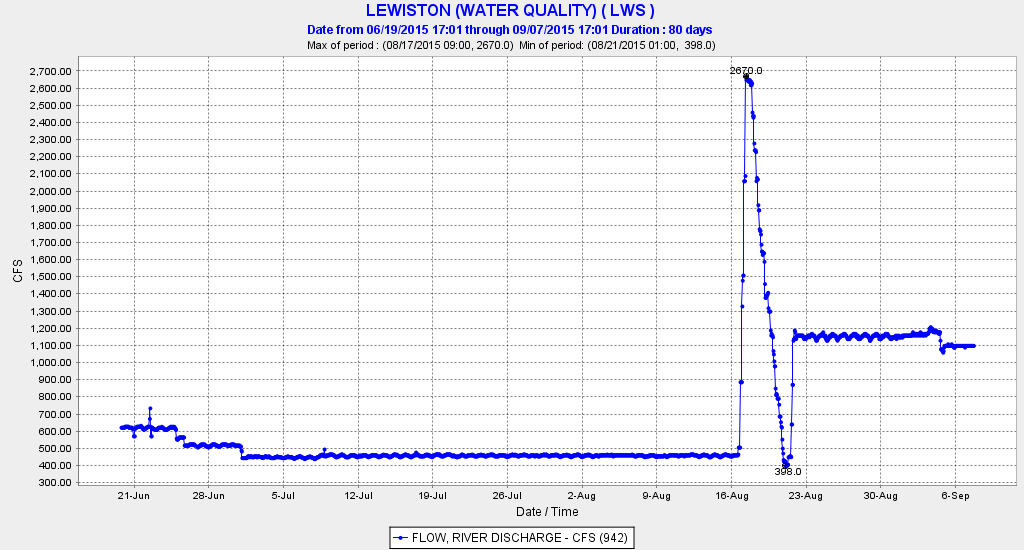
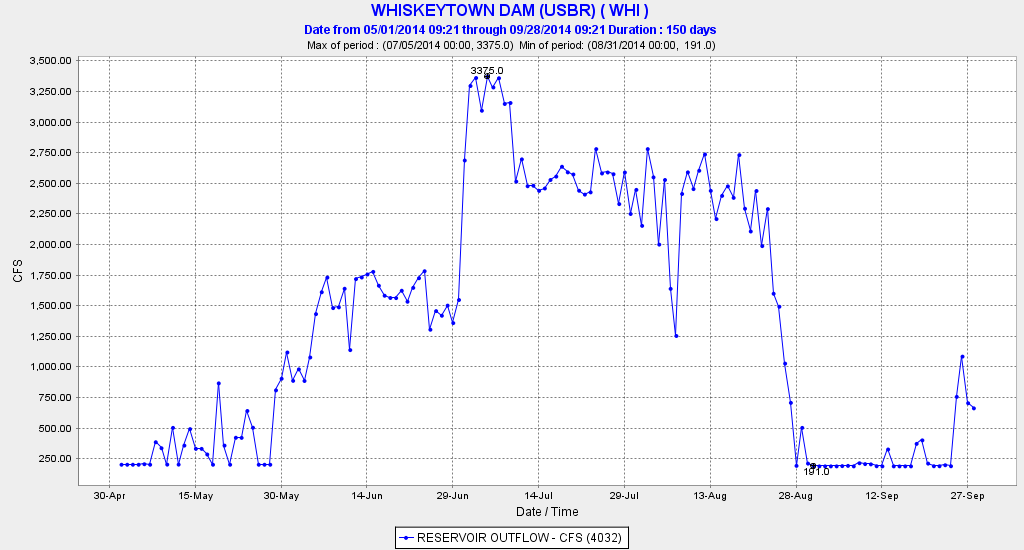
The Shasta-Trinity Division produces a lot of “green” energy through hydropower. Having Lewiston and Keswick reservoirs below Trinity and Shasta reservoirs further allows hydro-peaking to meet daily patterns of electricity demands. The two-step drop for Whiskeytown transfers from the Trinity to the Sacramento adds even more potential peaking power. Trinity Reservoir water drops from a 2200-2400 ft elevation to 1900-ft at Lewiston Reservoir, to 1200-ft at Whiskeytown, to 600-ft at the Spring Creek Powerhouse on Keswick Reservoir providing a substantial potential for peaking hydropower.
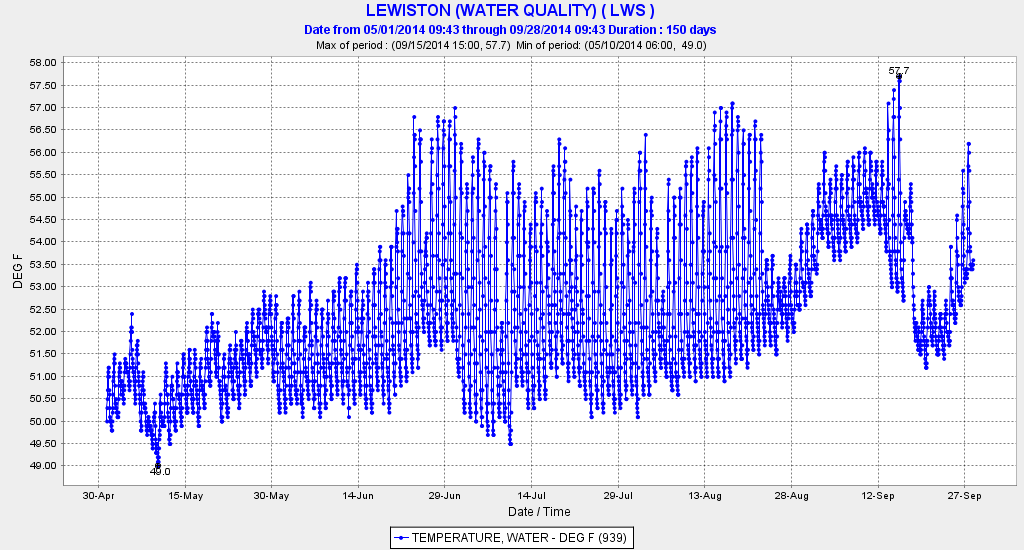
Our analysis of operational data shows that peaking power generation leads to added heating of Lewiston, Whiskeytown, and Keswick reservoirs, and added loss of cold water pools from Shasta and Trinity. Afternoon peaking generation pulls warmer water into penstocks than nighttime generation. Generating more at night reduces the loss of cold water pools, but at the expense of the high-value peak power. No mention of this option is included in the NMFS BO RPA.
The RPA does include Reclamation’s ability to bypass the hydropower systems at both Shasta and Trinity dams and releasing cold water via the lower level outlets. The option was not employed effectively in 2014 or 2015 at either dam.
Installation of temperature control devices and temperature curtains at reservoir inlets to the hydropower systems has proven beneficial but not totally effective. Planned improvements should be immediately implemented. The Shasta Temperature Control Devise proved ineffective in late summer 2014. The Whiskeytown temperature curtain fails to reduce water temperatures in water released to Keswick Reservoir below 58°F, thus requiring the added release of Shasta cold water pool to meet the 54-56°F required release from Keswick Reservoir to the Sacramento River.
Summary of Potential Measures
Changes in the operation of the Shasta-Trinity Division of the Central Valley Project in the following are necessary to preserve Sacramento and Trinity River salmon:
- Provide a better balance between water supply demands, hydropower production, and salmon needs.
- Improve management of reservoir storage, especially the amount of cold-water pool in reservoir storage
- Better manage the distribution of reservoir releases between power turbines (warmer) or lower level bypasses (colder)
- Improve the daily pattern of reservoir releases to meet peaking power demands for electricity while minimizing demands on reservoir coldwater pools.
- Improve blending capabilities in reservoir outlets to power turbines (Shasta has a Temperature Control Devise that allows pulling water from different lake levels)
- Improve water temperature mixing in the two re-regulating reservoirs (Keswick below Shasta and Lewiston below Trinity)
- Improve water temperature management of releases to the Sacramento and Trinity Rivers (do not relax water temperature standards)
- Better manage the export of Trinity Reservoir water via Lewiston and Whiskeytown reservoirs to Keswick Reservoir (to Sacramento River) to minimize the use of Shasta’s cold water pool to cool water originating in the Trinity .
- Truly address the NMFS BO RPA goals and objectives for the near-term:
“In the near term, adverse effects of project operations to winter-run will be reduced primarily through the following measures: Modifications to Shasta reservoir management will result in more reliable provision of suitable water temperatures for spawning and egg incubation in the summer months. The new year-round Shasta management program is expected to minimize frequency and duration of temperature related egg mortality in dry and critically dry years, thus reducing, though not eliminating, the population level stress of these temperature related mortalities. The new Shasta program will allow for an expanded range of habitat suitable for spawning and egg incubation in wetter year types (i.e. through meeting downstream compliance points more often). Over time, this will help to preserve diversity of run-timing and decrease the risk of a single event in a localized area causing a population level effect. Temperature related effects on winter-run will persist into the future, and cannot be fully off-set through Shasta reservoir storage actions, due to physical and hydrological constraints on the CVP system, and the delivery of water to non-discretionary CVP contractors (e.g. Sacramento River Settlement Contractors). Given a fixed supply of cold water in any given year starting in May, as an overall strategy, the RPA prioritizes temperature management in favor of winter-run due to their endangered status and complete dependence on suitable habitat downstream of Keswick for their continued survival.”
- All italicized quoted text in this post is from the NMFS OCAP Biological Opinion. ↩