Over the past dozen-odd years, there have been significant negative trends in flow, water temperature, and lake levels in the upper Klamath River in California. The trends likely reflect global warming, climate, and patterns in water supply use in the Klamath watershed. The parameters contribute to declines in toxicity and fish populations, which are the subject for a future post.
Klamath Lake Storage
Klamath Lake elevation and storage over the past dozen years have been significantly below average in five years: 2010, 2014-15, and 2020-2021 (Figure 1). Year 2021 is the worst year in terms of lake level. Minimum lake levels occurred at the end of drought years 2009, 2012, and 2014.
Klamath Lake Releases (Outflow)
Klamath Lake outflow patterns indicate low levels of outflow in drought years, but also a general decline in winter minimums over the past dozen years (Figure 2). The low outflow minimums may reflect efforts to recover lake storage in low-storage years (e.g., winter 2012-13).
Klamath Lake Outfall Water Quality
The water temperatures of Klamath Lake outflow have risen significantly over the past dozen years, especially in drought years (with 2021 being the warmest), but also in some wetter years like 2017 (Figure 3). Dissolved oxygen and pH have trended downward over the years (Figure 4). Dissolved oxygen and pH have generally fallen in the summer, possibly an indication of lower summer algae production in the lake. Low late-summer and fall oxygen levels likely reflect high organic loads and lower algae production in the lake above.
Lower Klamath River Flows into California
There has been a general downward trend in Klamath River flow releases from the JC Boyle Dam and Iron Gate Dam into California (Figures 5-7). Minimum flow periods reflect the minimum flow periods from Klamath Lake (see Figure 2). The dominant features are lower flows in periods of drought generally and the unusually low 2020 and 2021 flows in particular.
California Tributary Inflows to Klamath River
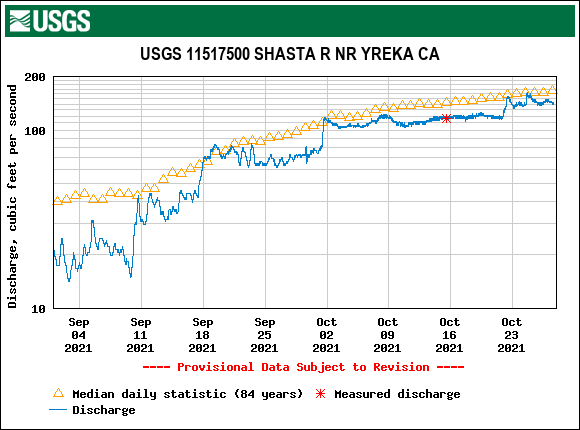
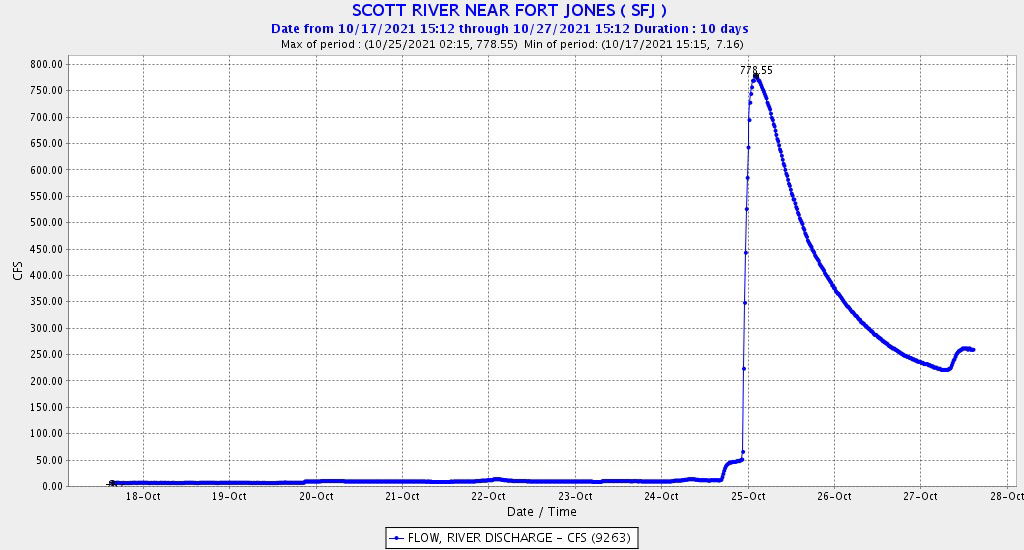
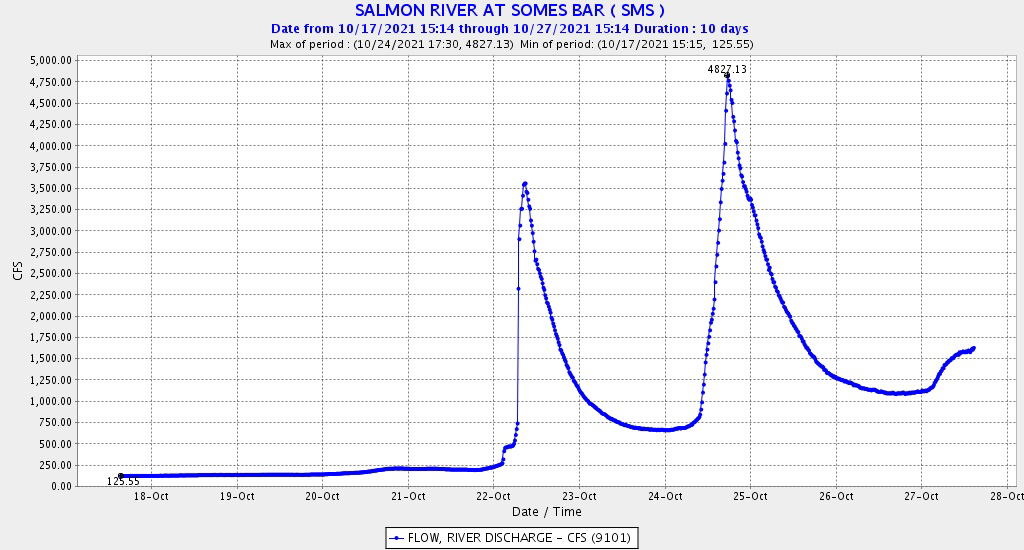
California tributary inflows to the Klamath (Figures 8-10) reflect the dry-wet year patterns of the upper river. Years 2020 and 2021 have had unusually low tributary flows, especially in the Scott River.
Summary
The water levels, river flows, and water quality in the Klamath River watershed from 2008 through 2021 have declined overall, dominated by drought in 2008-2009, 2013-2015, 2018, and 2020-2021. Current conditions are the worst during this thirteen-year period.
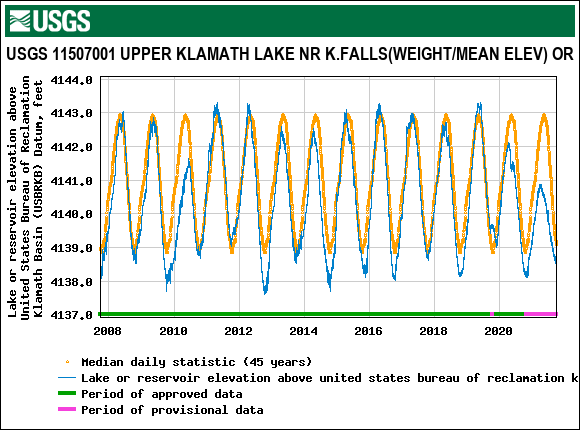
Figure 1. Water levels in Klamath Lake 2008-2021.
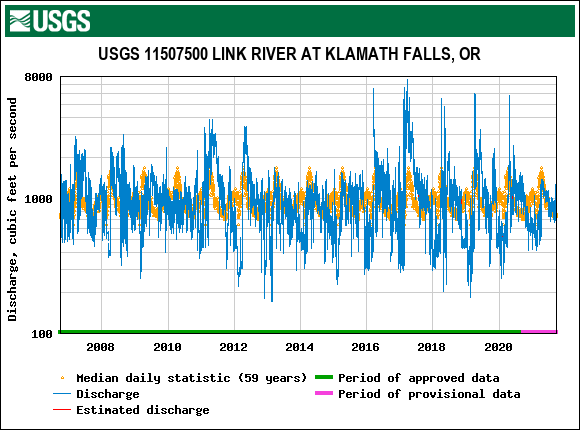
Figure 2. Water releases from Klamath Lake 2008-2021.
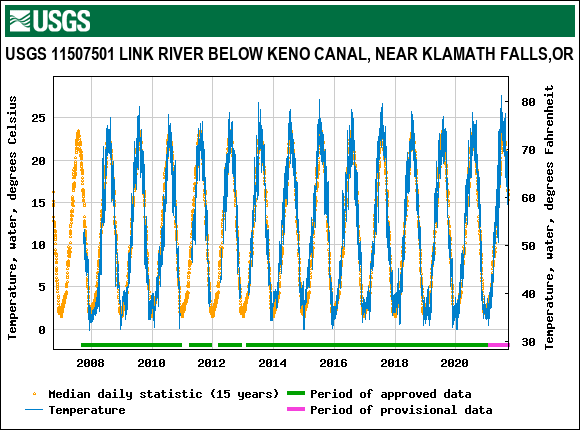
Figure 3. Water temperature of water flows from Klamath Lake 2008-2021.
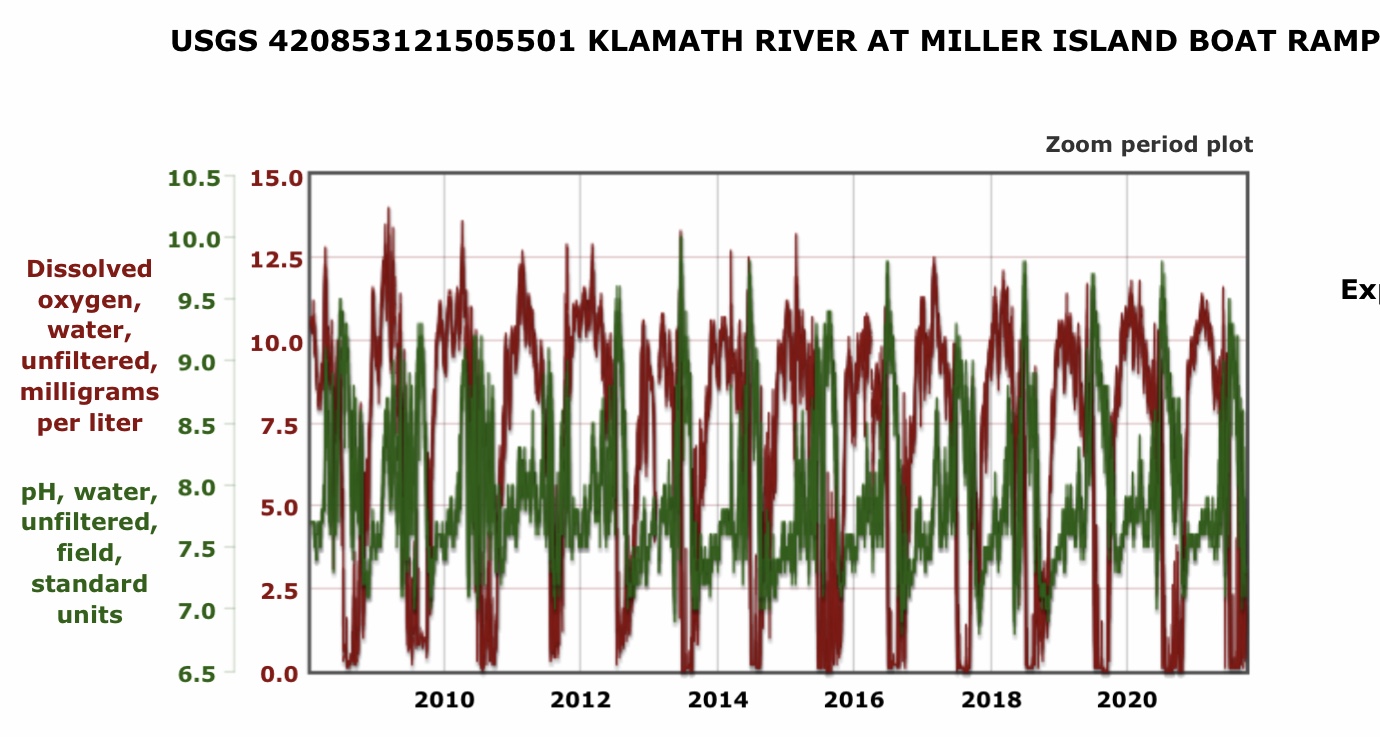
Figure 4. Water quality of water flows from Klamath Lake 2008-2021.
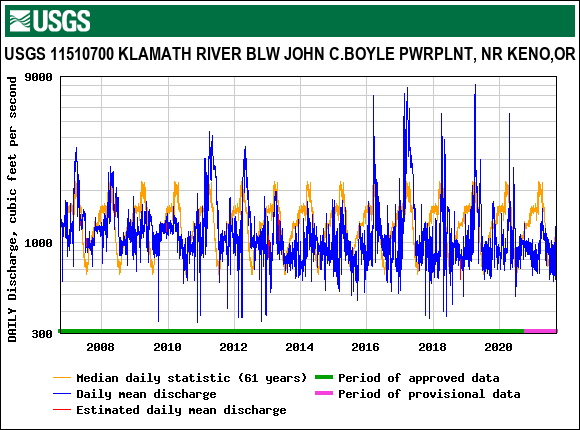
Figure 5. Klamath River stream flow near Keno, Oregon.
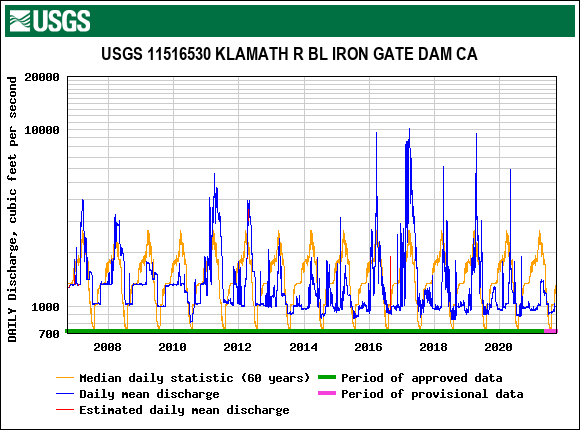
Figure 6. Streamflow to lower Klamath River below Iron Gate Dam 2008-2021.
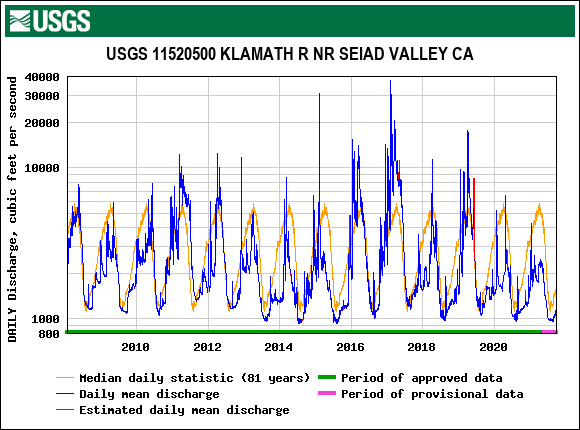
Figure 7. Streamflow to lower Klamath River below Scott and Shasta Rivers near Seiad Valley, California 2008-2021.
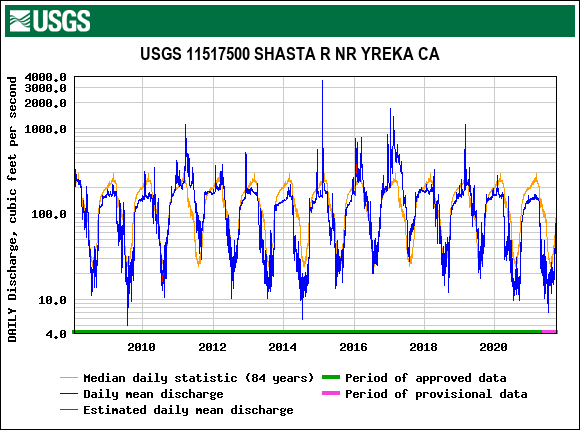
Figure 8. Shasta River flows 2008-2021.
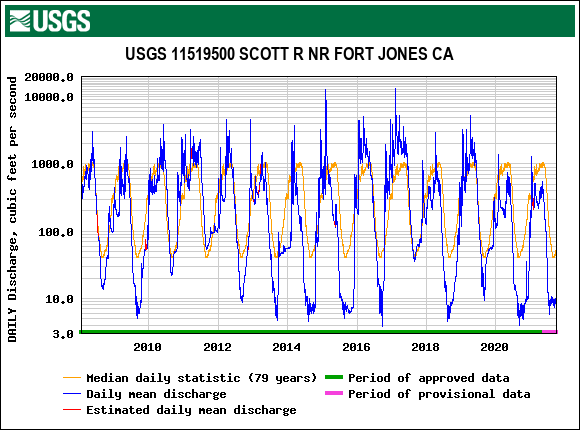
Figure 9. Scott River flows 2008-2021.
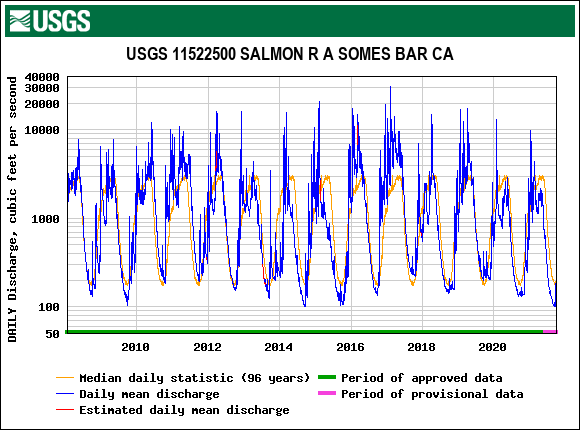
Figure 10. Salmon River flows 2008-2021.