When I last updated the status of the winter-run salmon population of the upper Sacramento River in an April 2020 post, trends in spawning escapement indicated the population was recovering in 2018 and 2019 after the poor runs in 2016 and 2017. That trend continued in 2020 and 2021 (Figures 1-3). These recent runs benefited from wet years in 2017 and 2019, and near-normal 2018 that contributed to better natural egg and fry survival as well as hatchery smolt survival. The only negative trend in the adult escapement is the higher proportion of hatchery-produced adults in the recent year returns that reflects the enhanced hatchery efforts1 during and after the 2013-2015 drought. The prognosis for the 2022 run remains good, as 2019 was a wet year and 2020 was near normal. Both years had flow and water temperature much better than during the 2013-2015 drought.
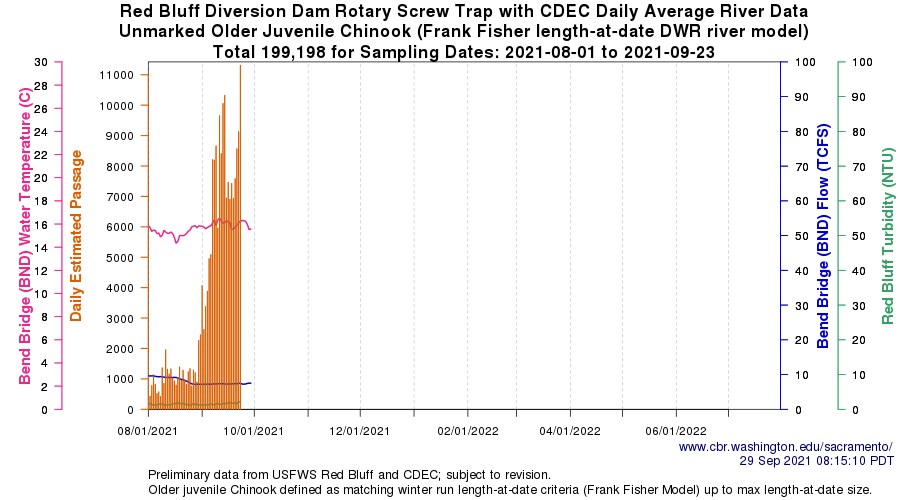
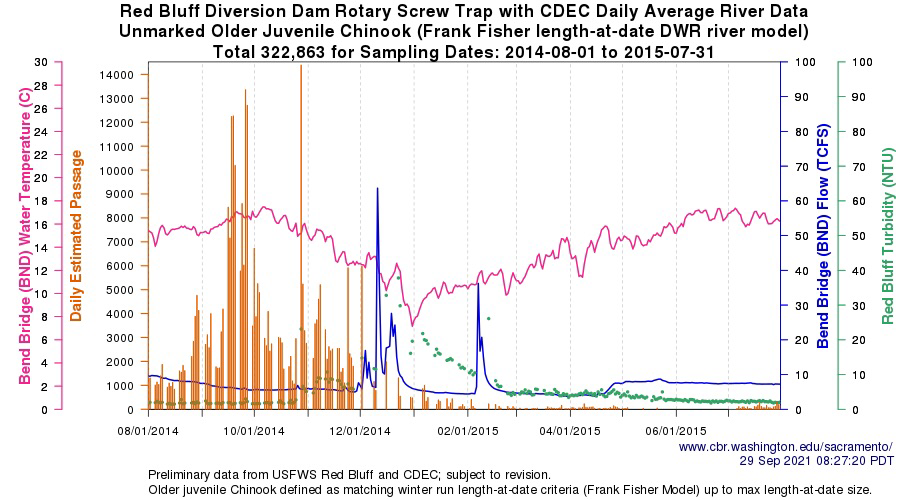
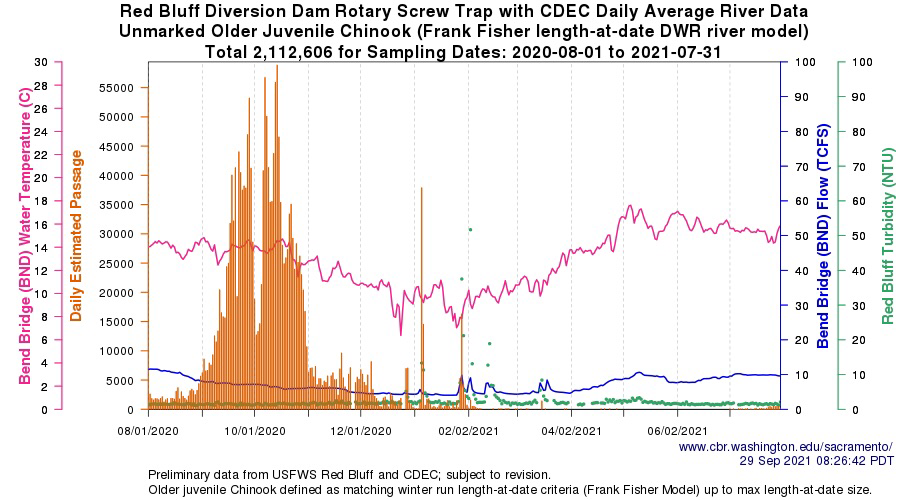
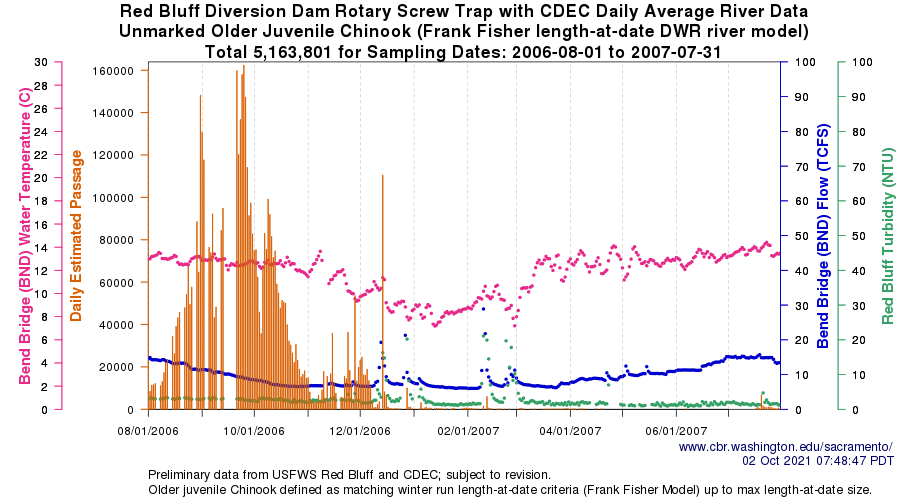
The prognosis for the 2023 and 2024 runs does not look as good, given the extreme drought conditions in 2021 that have likely limited survival of the 2021 brood year.2 Reclamation undertook unusual operations in 2021 in an attempt to maintain a modicum of winter-run egg and fry survival given the drought conditions (Figure 4). The first indicator of potential success is from screw trap collections at Red Bluff that indicate survival in 2021 has been better than 2015 but poorer than 2018 and 2019 (Figures 5-8). The screw trap collections also produce an end-of-season estimate of total passage (Figure 9), which is another way of summarizing these same data. These indices also show a post-drought recovery from 2018-2020, where 2021 brood-year production would likely fall back to a level below brood year 2018.
In a recent post, the Northern California Water Association (NCWA) expressed a more upbeat prognosis, although tempered by poor drought year 2021 conditions.
“To be sure, the dry and hot conditions in 2021 are not ideal for salmon nor any other part of the ecosystem that depends upon water and they are having challenging years. Yet, despite these dry and hot conditions, salmon are amazingly resilient and they: 1) have returned to the Sacramento Valley in record numbers; 2) will continue to spawn, and 3) are now beginning their journey down the river in large numbers. Importantly, there continues to be a concerted effort throughout the region to improve conditions for every freshwater life-cycle stage of all four runs of Chinook salmon.”
I generally agree on item 3, noting that “large numbers” are relative, as discussed above and shown by comparing the figures below. I do not agree with the other assertions. Much of the “record number” are hatchery fish, as also discussed above. And spawning conditions in the Sacramento River for the rest of the fall will be poor.
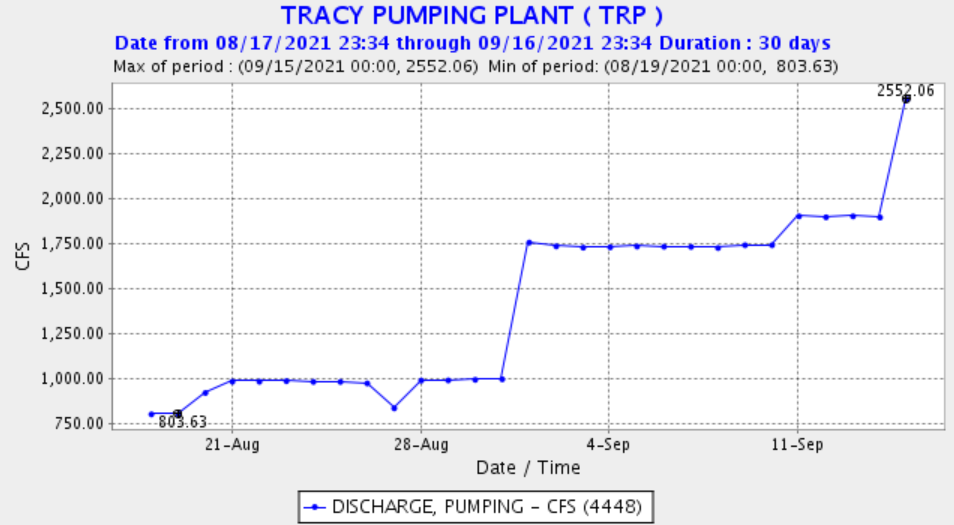
NCWA is one of the major users of Sacramento River water. High drought-year allocations of Shasta storage to NCWA users led to high spring demands on storage by NCWA water users (see Figure 4) and in part to the current near-record-low storage in Shasta Reservoir (Figure 10). Unless it rains and snows a considerable amount this winter, salmon and water users will be in dire straits next year.
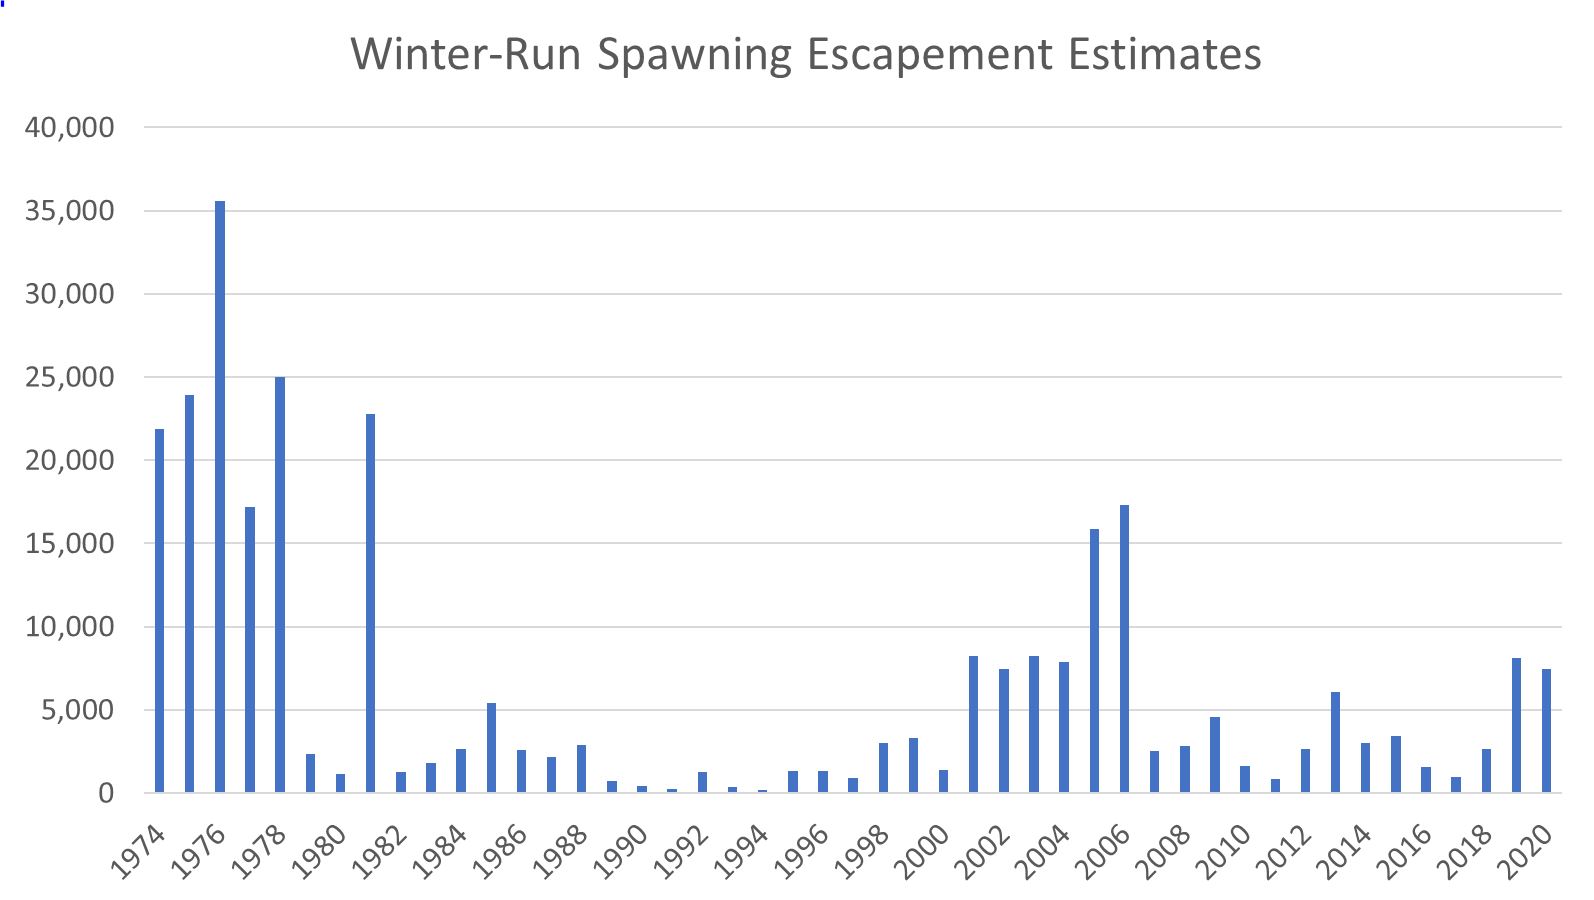
Figure 1. Winter-run Chinook salmon escapement (run size) to the Sacramento River 1974-2020. (Source: CDFW)
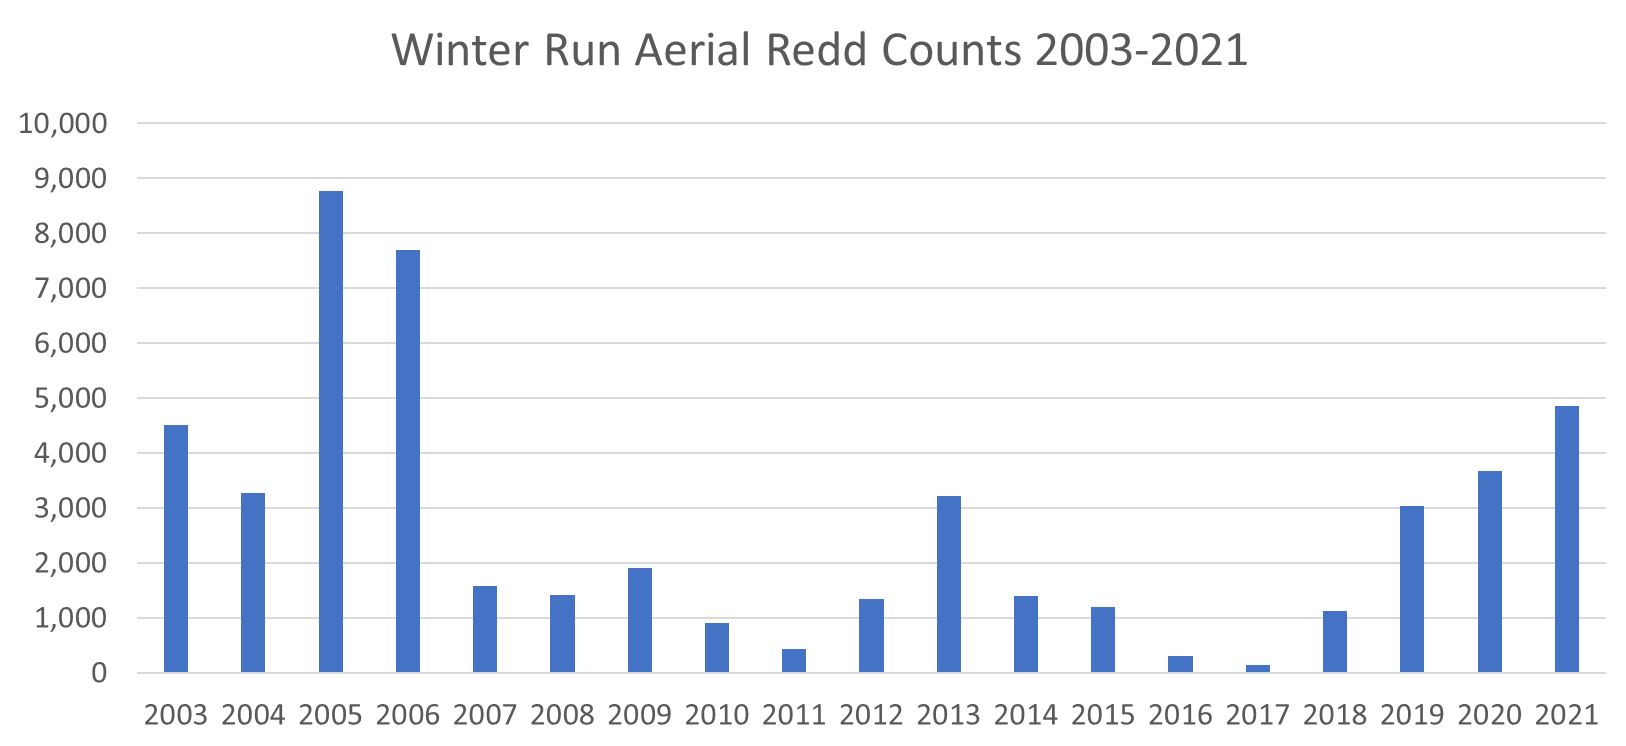
Figure 2. Winter-run Chinook salmon annual aerial redd counts in the upper Sacramento River 2003-2021. (Source: CDFW)
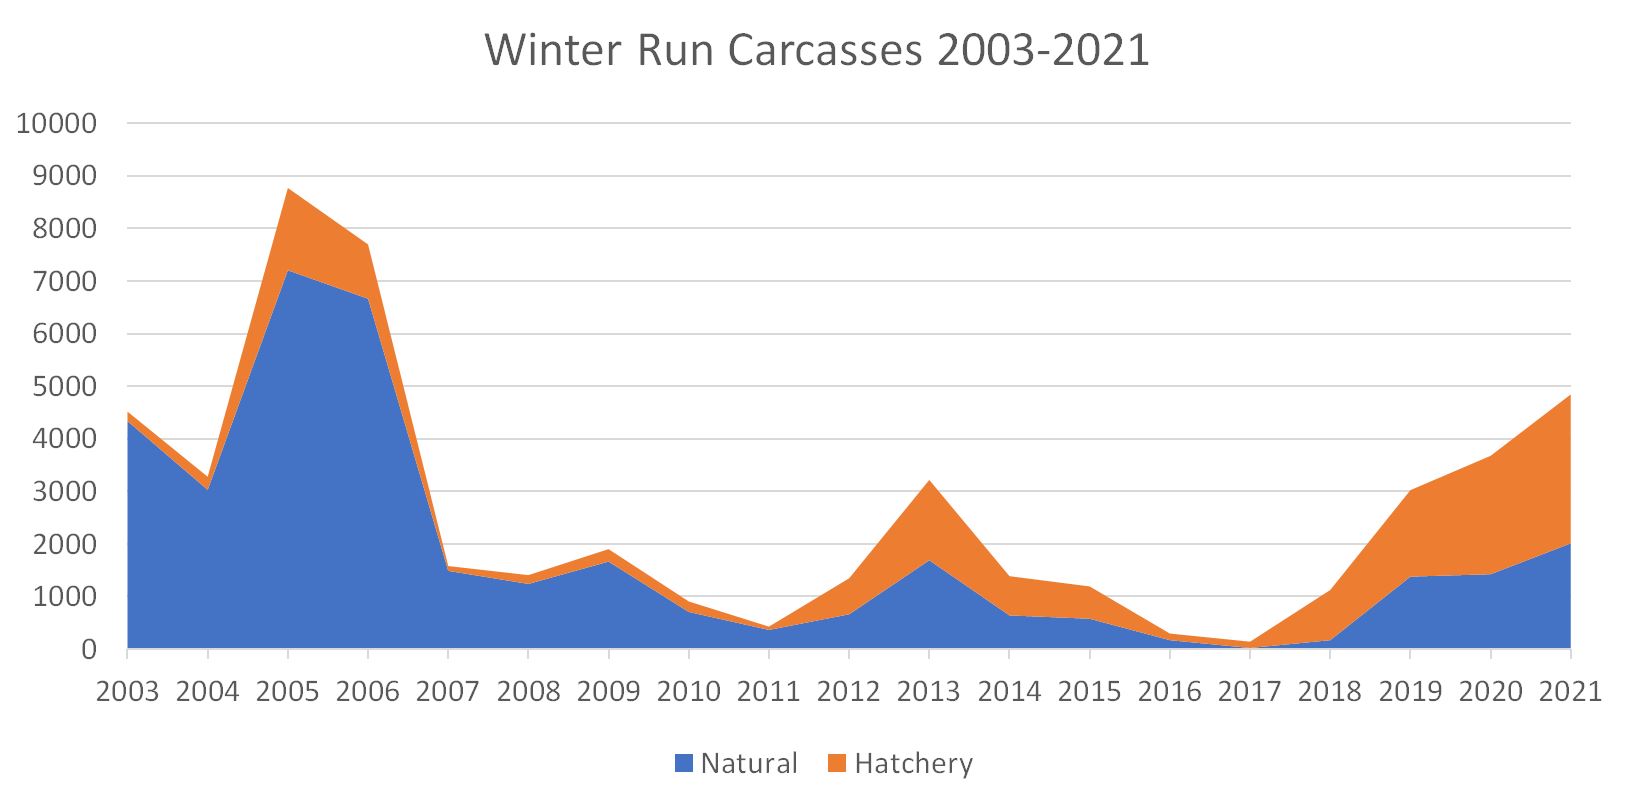
Figure 3. Winter-run Chinook salmon annual carcass counts in the upper Sacramento River 2003-2021. (Source: CDFW)
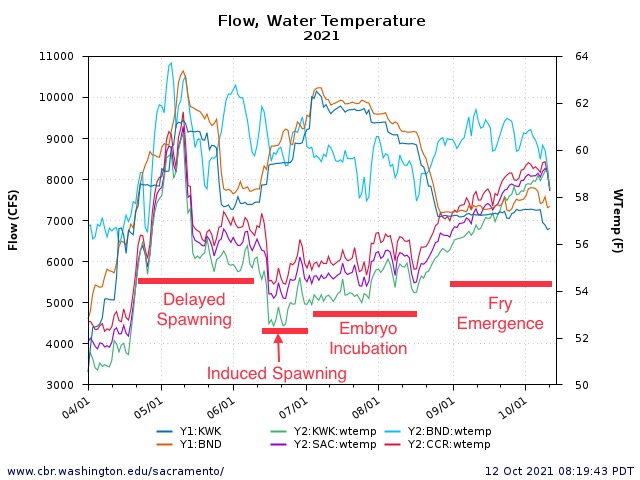
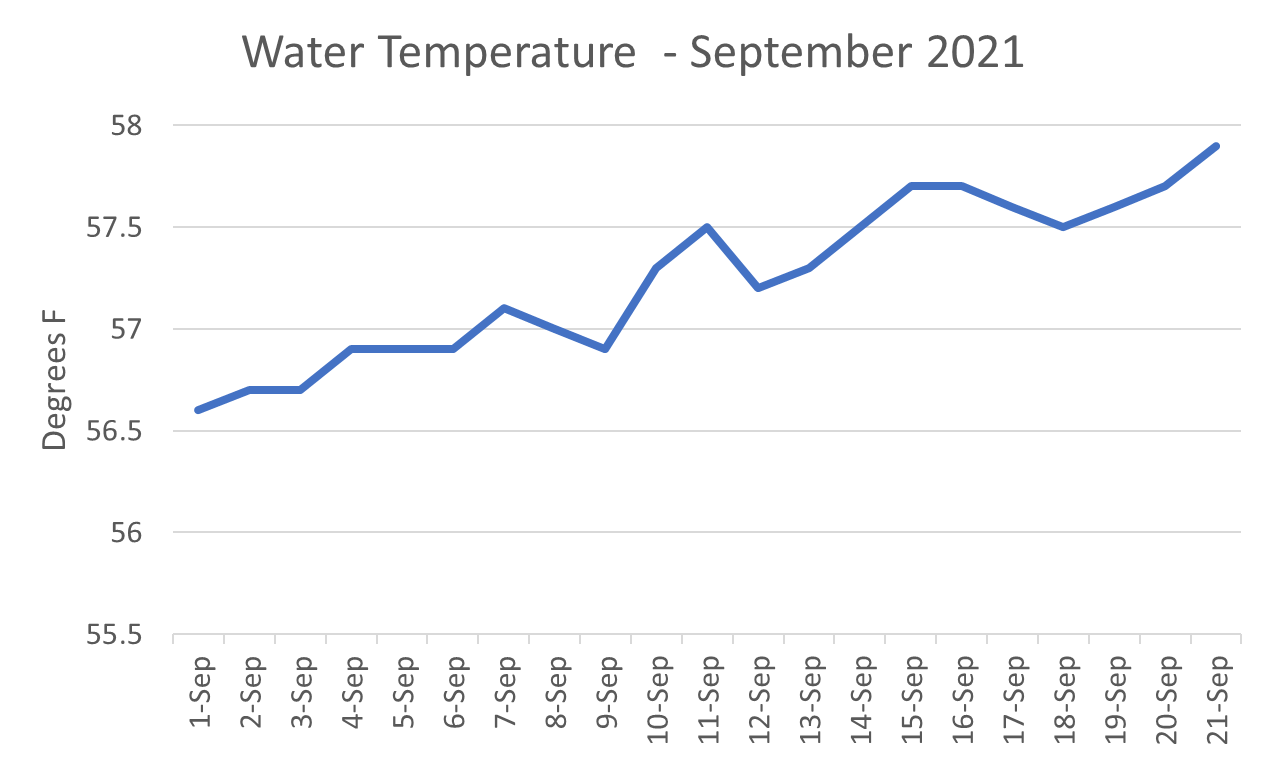
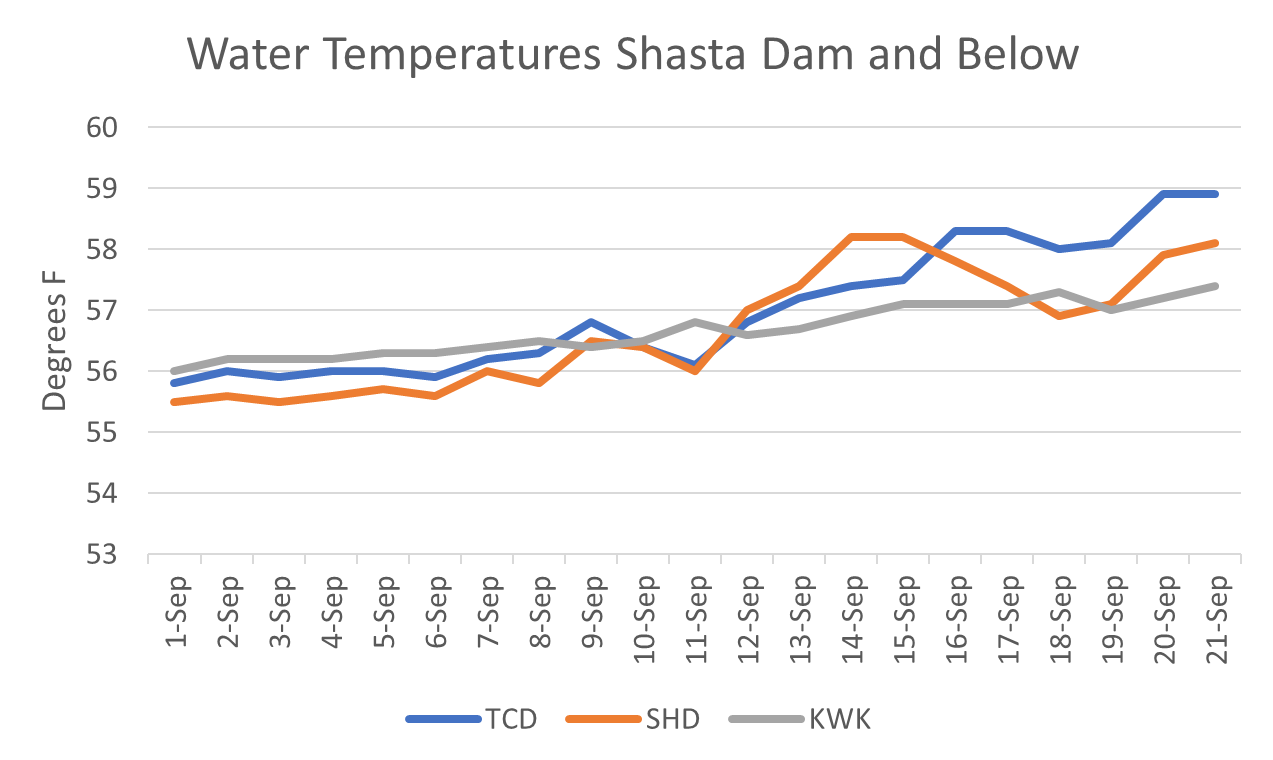
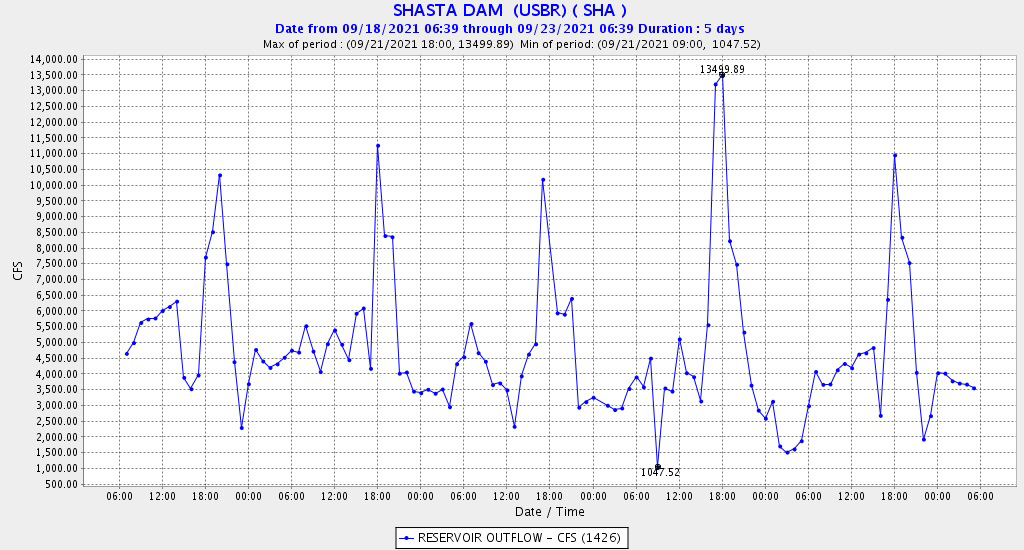
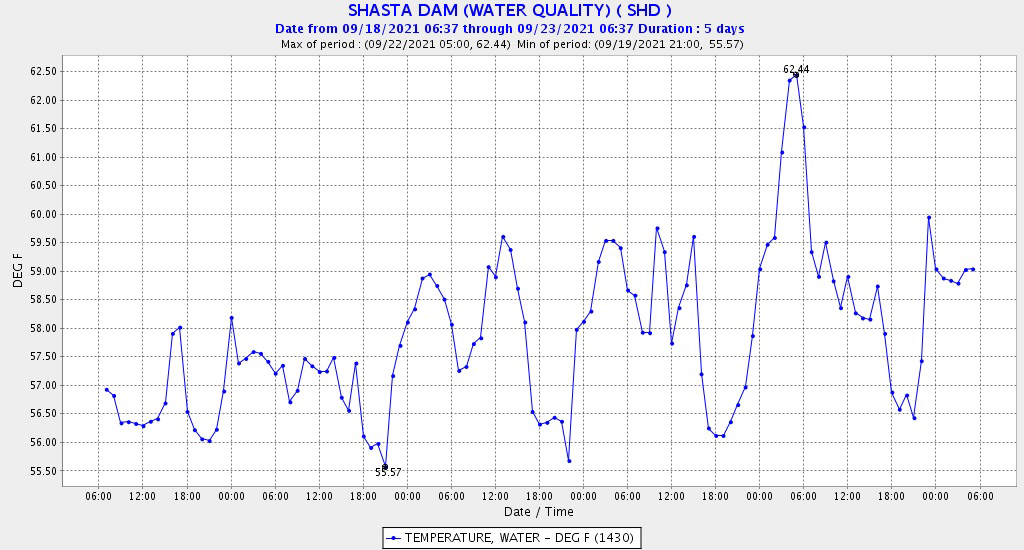
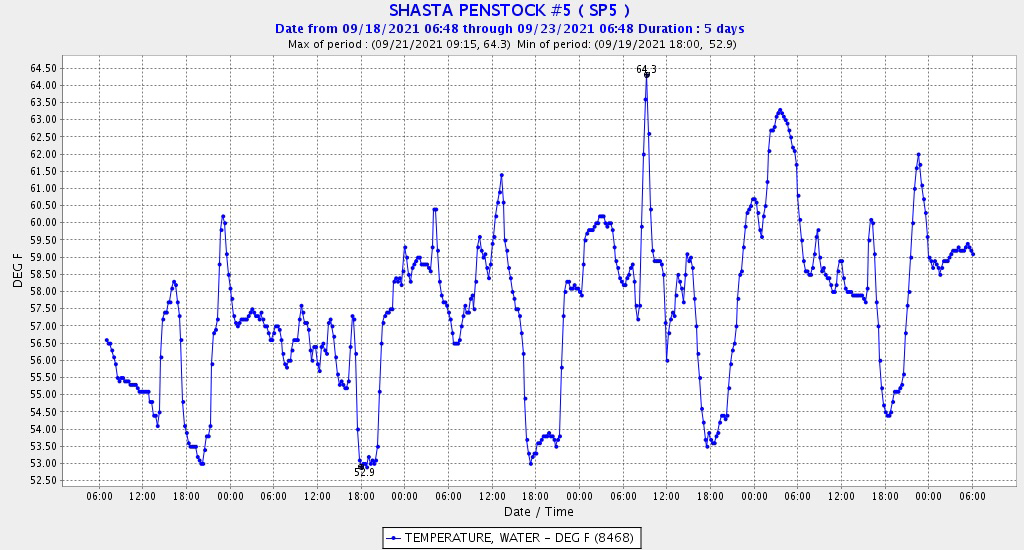
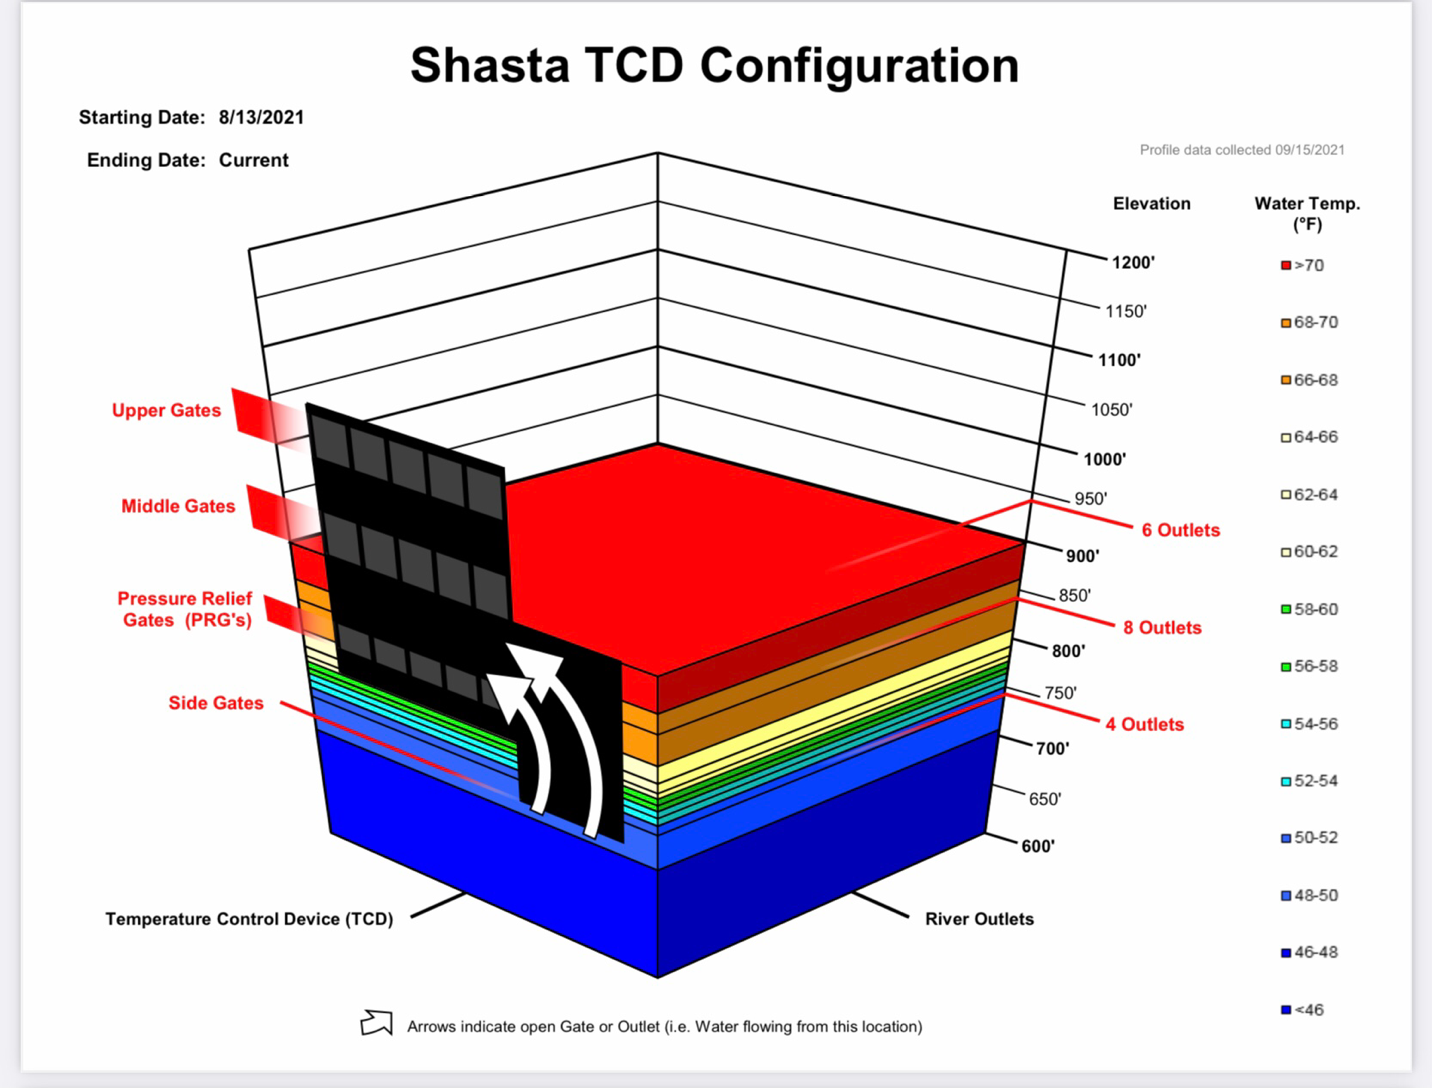
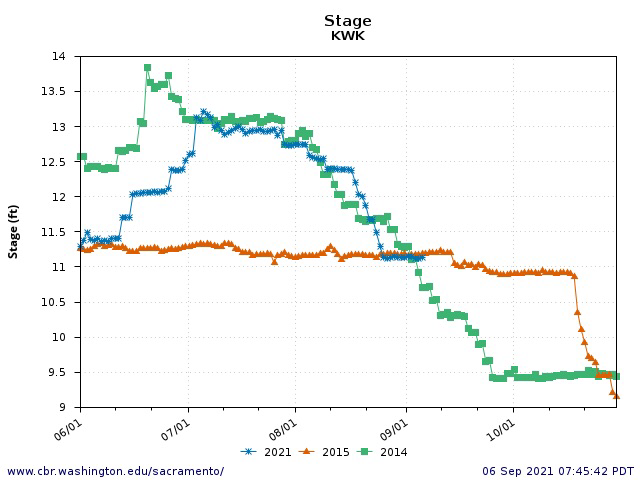
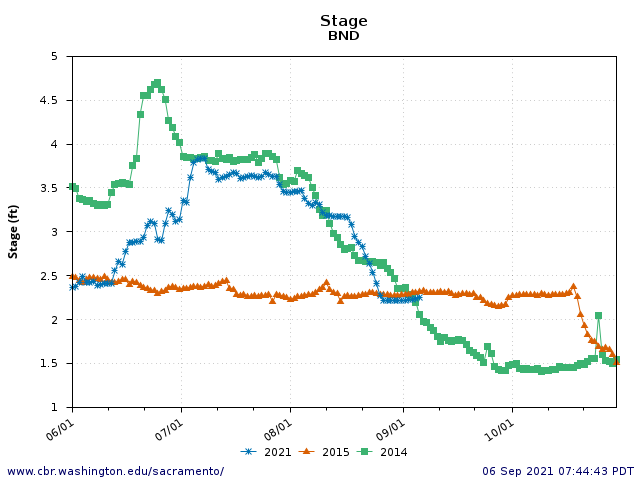
Figure 4. Winter-run Chinook salmon spawning season conditions in the Sacramento River in 2021. River flows at Keswick Dam (KWK, rm 300) and Bend (BND, rm 250). Water temperatures KWK, BND, and Redding (SAC, rm 290; CCR, rm 280).
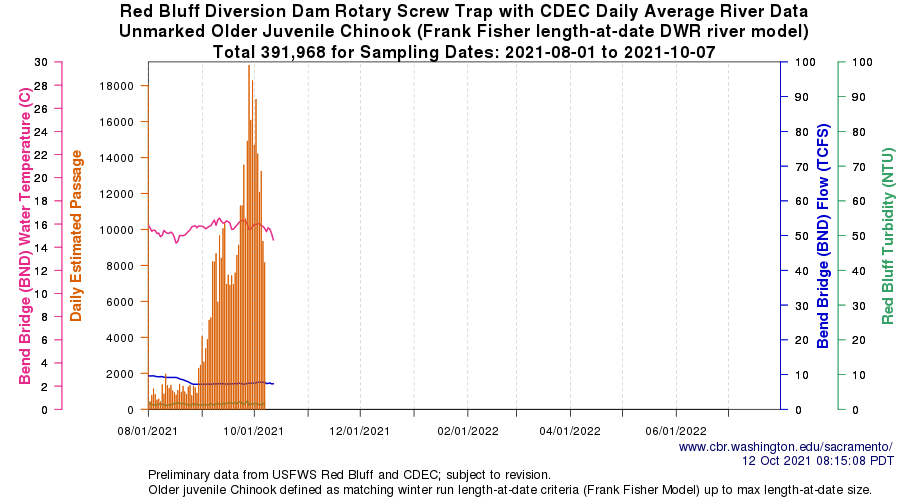
Figure 5. Juvenile winter-run salmon counts in Red Bluff screw traps 8/1-10/7, 2021.
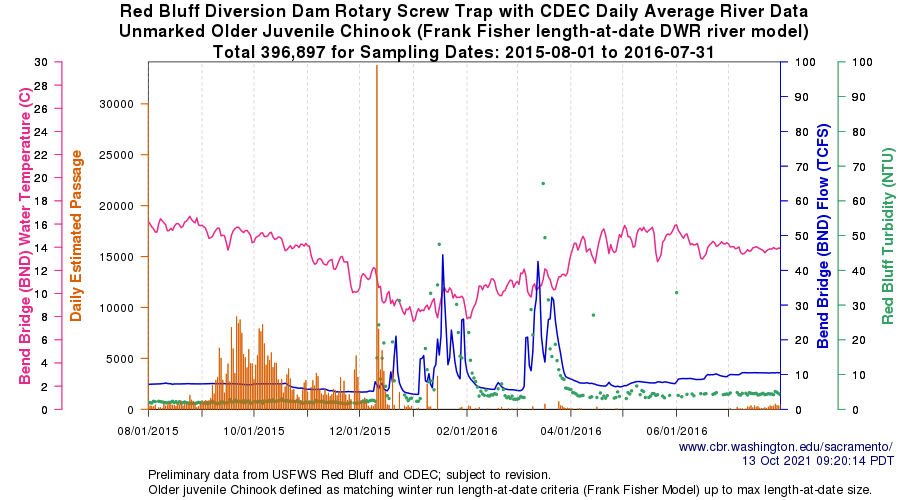
Figure 6. Juvenile winter-run salmon counts in Red Bluff screw traps 8/1/15-8/1/16.
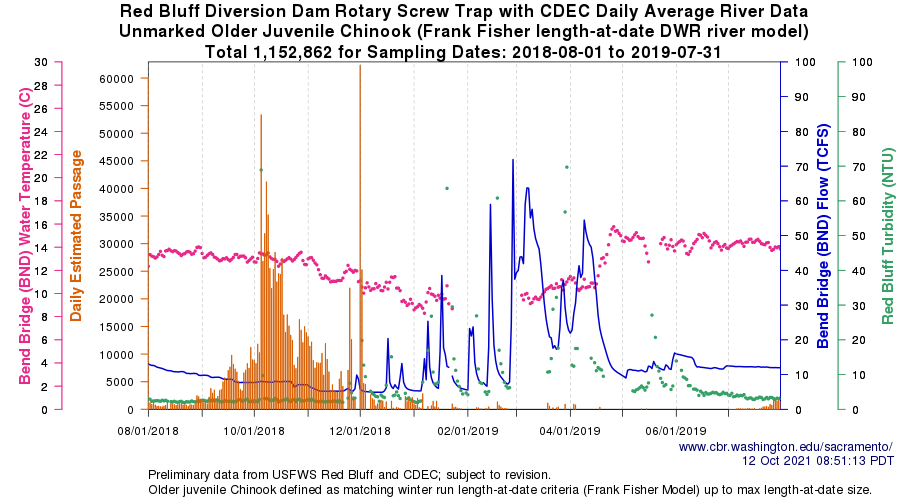
Figure 7. Juvenile winter-run salmon counts in Red Bluff screw traps 8/1/18-8/1/19.
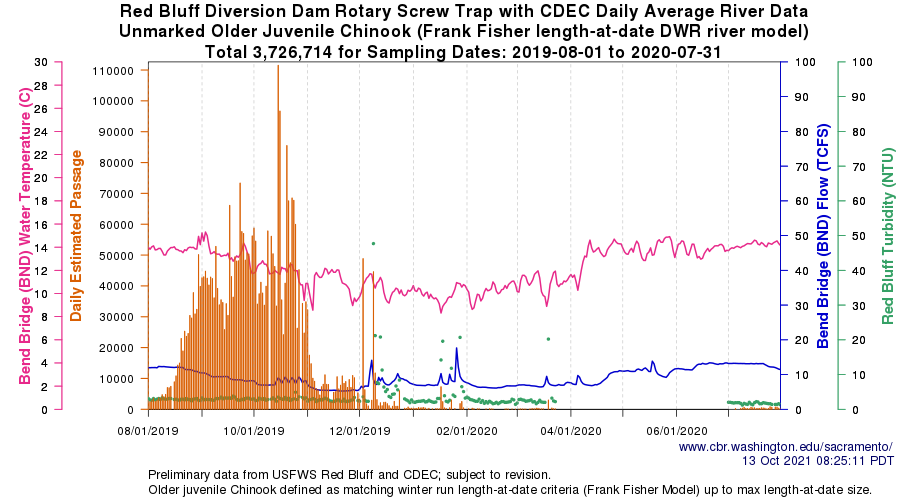
Figure 8. Juvenile winter-run salmon counts in Red Bluff screw traps 8/1/19-8/1/20.
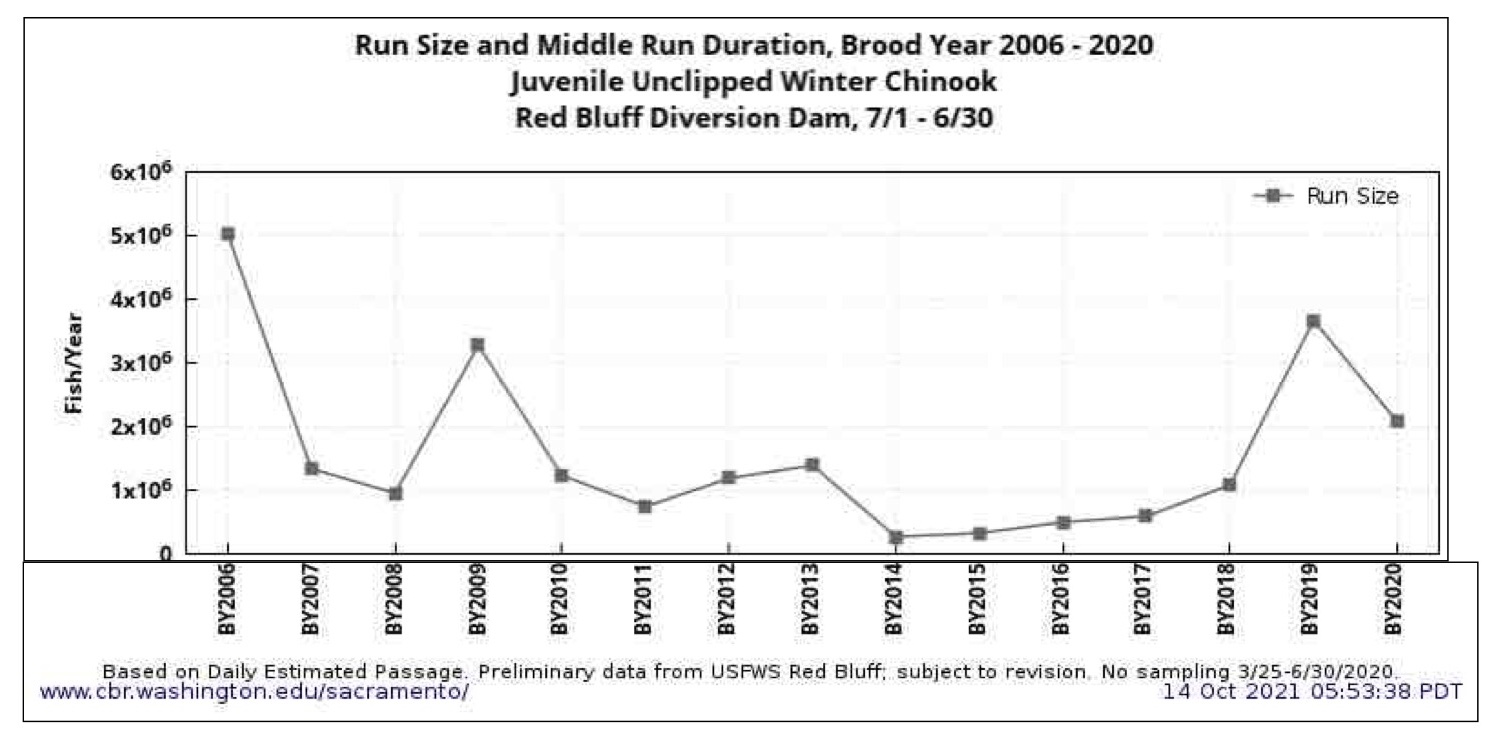
Figure 9. Estimated total passage past Red Bluff of unclipped (naturally produced) juvenile winter-run salmon for brood years 2006-2020.
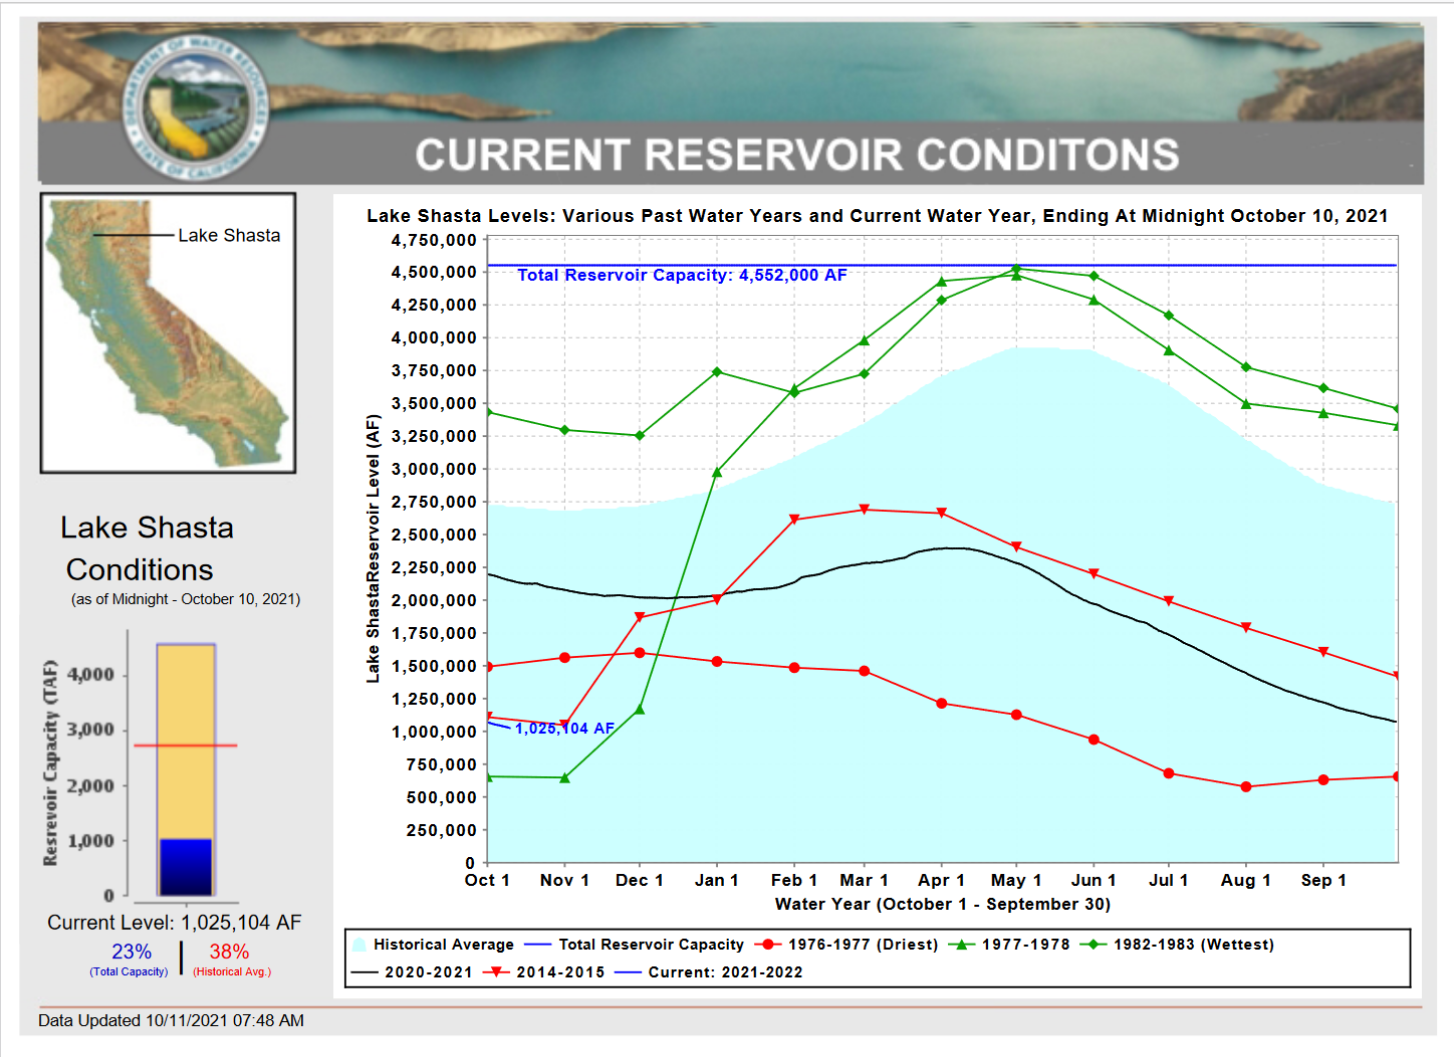
Figure 10. Lake Shasta water level conditions in water year 2021-2022 and other water years, plus historical averages. Source: DWR-CDEC.
- Including smolt introductions to Battle Creek. ↩
- https://calsport.org/fisheriesblog/?p=3912, https://calsport.org/fisheriesblog/?p=3898 ↩